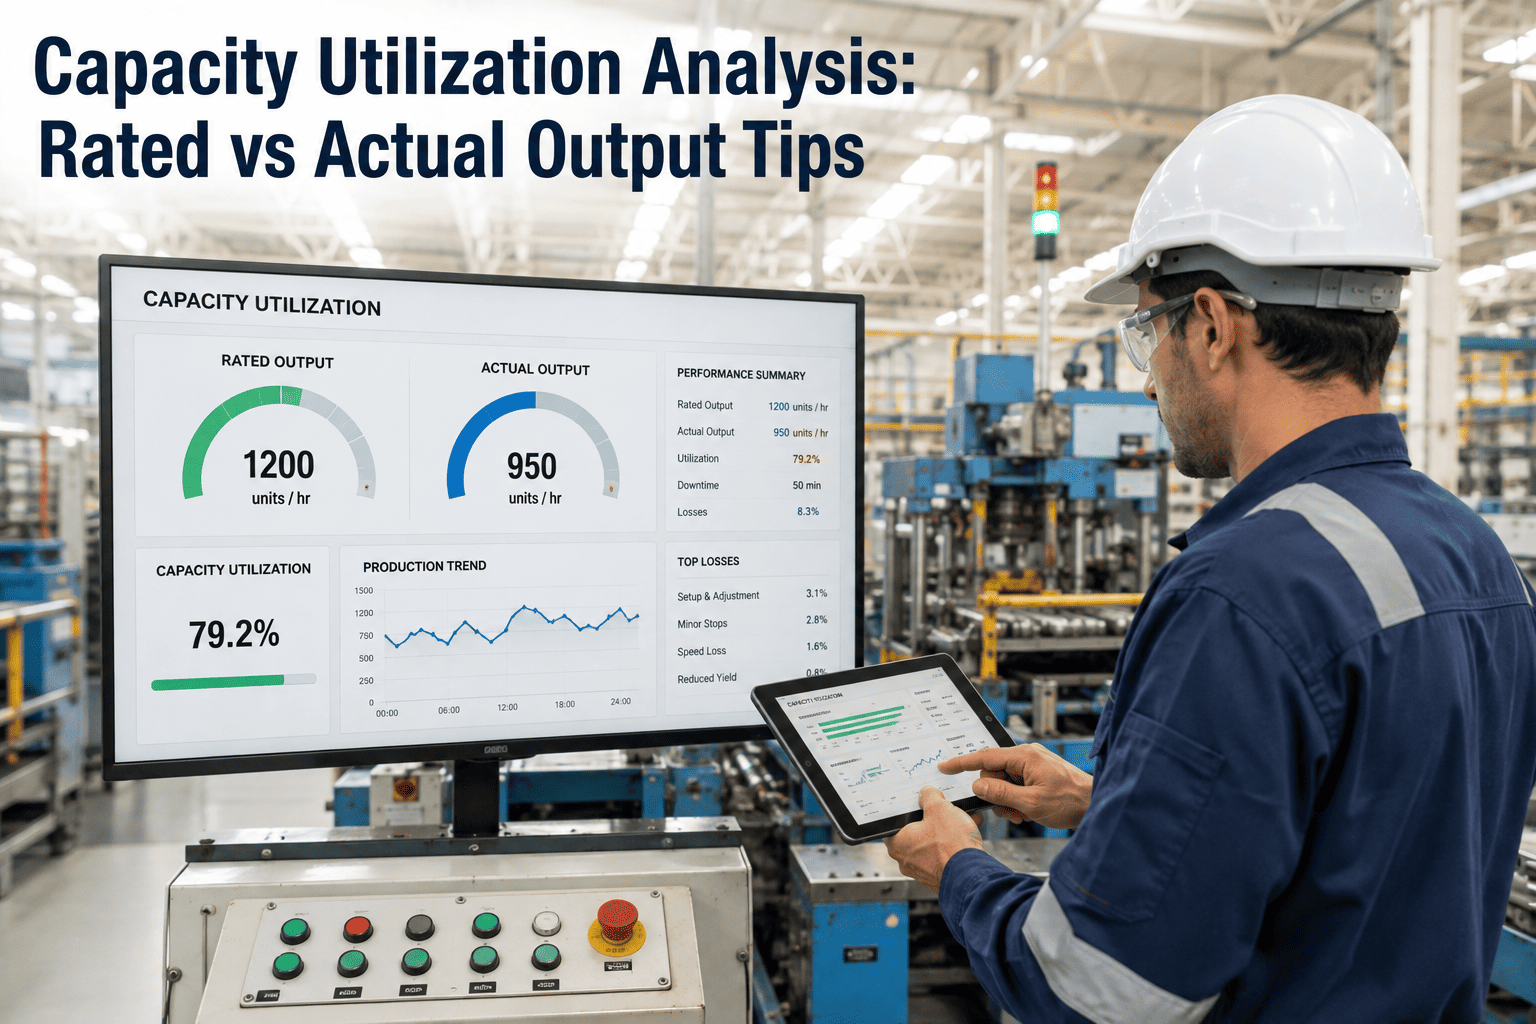
Most plant managers would guess their machine utilization sits somewhere around 60 to 70 percent. The actual average across more than 12,000 connected CNC machines, measured automatically rather than self-reported, comes in closer to 26 percent — with a large cluster of shops sitting between 17 and 20 percent. That gap between perception and measured reality is not a rounding error; it's the entire opportunity, and it exists precisely because most utilization figures still come from memory rather than from the machine itself. iFactory's machine utilization tracking captures run, idle, fault, and changeover states automatically from the equipment itself, so the number on the dashboard is the real one, not the optimistic version from an end-of-shift paper log.
Where a Scheduled Shift Actually Goes: The Utilization Waterfall
Available time doesn't become output in one step. It passes through scheduling, idle time, faults, and changeovers before what's left becomes productive runtime — and most plants have never mapped where their hours actually leak.
Three Different Utilization Numbers, Three Different Questions
"What's our utilization rate?" is an underspecified question, because there are at least three legitimate ways to answer it, and each one measures something different. Confusing them is one of the most common sources of a plant manager reading a utilization report and drawing the wrong conclusion about what's actually wrong — a low number on one metric can mean a genuine production problem, while the identical low number on a different metric can simply reflect a deliberate, healthy scheduling choice.
Manufacturing Order Utilization
How effectively the shop floor converts scheduled production time into actual output on active orders. The measure most directly tied to operator and equipment performance during a specific job.
Scheduled Capacity Utilization
Production time compared against the hours a machine was planned to run, typically based on shift schedules. A high rate here means planned time is being used well, regardless of whether more shifts could be added.
Absolute Capacity Utilization
Production measured against the theoretical maximum — 24 hours a day, 7 days a week. Almost always the lowest of the three figures, and useful mainly for understanding how much headroom exists if demand increases.
A factory manager who sees a low absolute capacity utilization number might wrongly assume the shop floor is underperforming, when the real explanation is simply that the plant runs a single shift by design and has no current reason to run three. The fix for a low number in one of these three metrics is completely different depending on which one is actually low — which is exactly why the category has to be specified before the number means anything.
The Idle Time Taxonomy: Not All Idle Minutes Are the Same Problem
A machine sitting idle for ten minutes waiting on a tooling changeover is a fundamentally different problem than the same machine sitting idle for ten minutes because nobody has assigned the next job. Categorizing idle time by cause — automatically, from the machine's own state signals, rather than from a technician's memory at end of shift — is what turns a utilization number into an actionable improvement list rather than a single discouraging percentage with no obvious next step attached to it.
| Idle Category | Typical Cause | Who Owns the Fix |
|---|---|---|
| Changeover / Setup | Tooling, fixture, or program change between jobs | Production engineering — setup reduction methods |
| Waiting for Material | Upstream process, inventory, or supplier delay | Materials planning, supply chain |
| Waiting for Operator | Operator assigned to multiple machines or on break | Staffing model, operator-to-machine ratio |
| Equipment Fault | Mechanical, electrical, or software fault stopping the cycle | Maintenance and reliability |
| No Order Scheduled | Insufficient demand or a scheduling gap on this machine | Production planning, sales and operations |
| Quality Hold | Machine stopped pending inspection or rework decision | Quality engineering |
Without automatic categorization, most idle time gets lumped into a single generic "down" bucket on an end-of-shift log, which tells a plant manager that a machine was underutilized without telling them anything about why — and a fix aimed at the wrong cause wastes effort while the real bottleneck continues uninterrupted.
You Can't Fix Idle Time You Can't Categorize
iFactory captures machine state directly from the equipment and automatically tags idle periods by cause — so the utilization report points to a specific fix, not just a percentage.
A Composite Scenario: The Machine That Looked Busy But Wasn't
A contract manufacturer running a mix of five-axis machining centers had, for years, operated under the assumption that its shop was running near capacity — jobs were backed up, the schedule looked full on the whiteboard, and operators seemed constantly occupied. When the plant installed automatic machine-state monitoring for the first time, purely to support a new quoting initiative that needed accurate cycle-time data, the utilization report that came back three weeks later did not match anyone's expectation. The shop's flagship five-axis center, the machine everyone assumed was the busiest asset on the floor, was measured at 34% utilization — not the 70-plus percent the scheduling team had assumed when building quotes.
The gap turned out to be almost entirely changeover and waiting-for-material time, not faults or lack of demand. The machine was genuinely booked with work — the schedule wasn't lying — but between jobs it sat idle for stretches long enough to erode the actual productive percentage far below what a full-looking schedule implied. Digging into the automatically categorized idle data, roughly 40% of the idle time traced to fixture changeovers that averaged nearly ninety minutes each, and another meaningful share traced to raw stock that hadn't arrived from an outside heat-treat vendor before the scheduled start time.
Neither of those causes would have been obvious from a manual log, because operators reasonably didn't think to record forty-five minutes of fixture setup as "idle time" — to them, it was simply part of doing the job. Once the plant could see the changeover time broken out as its own category, a targeted setup-reduction effort on the most common fixture types cut average changeover time by roughly a third within two months, without touching staffing, shift structure, or ordering a single new machine. The lesson the plant took forward: a full-looking schedule and high machine utilization are not the same thing, and only measuring the second one accurately reveals the gap between them. The scheduling team, once shown the categorized data, also realized their quoting assumptions for future jobs on that machine had been built on a utilization figure that had never actually been true.
How Machine State Is Actually Captured
Automatic utilization tracking depends on reliably distinguishing machine states without relying on anyone to type them in. The methods available vary in cost, accuracy, and how much they depend on the machine's existing controller.
Reading machine state directly from the equipment's own programmable logic controller or CNC controller output. The most accurate method where available, since it reflects the machine's actual internal state rather than an inference from an external sensor.
Clamp-on current sensors that infer running versus idle state from power draw patterns. Useful for older equipment without a modern digital controller output, though it requires calibration to distinguish idle power draw from actual cutting or processing load.
Physical sensors detecting spindle rotation or axis motion directly, providing a reliable signal for whether the machine is actively cutting or moving regardless of what the controller reports.
Pulling state data through an existing manufacturing execution system or SCADA layer already connected to the equipment, avoiding duplicate hardware where that integration already exists on the floor.
Whichever capture method fits a given machine's age and connectivity, the goal is the same: a continuous, second-by-second state timeline that doesn't depend on a person remembering to log anything. That timeline is what makes automatic idle categorization possible in the first place — without it, every idle-cause analysis is still ultimately built on estimation rather than measurement, and estimation is exactly the weakness automatic tracking exists to eliminate. Older equipment without a native digital signal doesn't need to be excluded from tracking either; a combination of current sensing and motion detection can produce a reliable state timeline even on machines installed decades before connected monitoring existed as an option.
Turning Idle Categories Into an Improvement Priority List
Once idle time is reliably categorized, the natural next step is ranking categories by total recovered hours available, not just by which one feels most urgent on any given day. A category consuming a large volume of idle minutes across many machines, even if each individual instance seems minor, often represents more recoverable capacity than a dramatic but rare fault.
Rank by Total Hours, Not Frequency
A category that occurs often but briefly can consume more total idle time across a month than a rare but lengthy stoppage — sort the categorized data by cumulative hours lost before deciding where to focus improvement effort.
Match the Fix to the Category Owner
Changeover time belongs to production engineering; material delays belong to supply chain; equipment faults belong to maintenance. Routing each category to the team that actually controls the fix avoids months of a generic "reduce idle time" initiative that nobody is specifically accountable for.
Recheck After Each Intervention
After a targeted fix — a faster changeover procedure, a revised material lead time, a maintenance schedule change — recheck the utilization data for that specific category to confirm the intervention actually reduced idle time rather than simply shifting it elsewhere.
Before automated machine-state capture became standard, utilization was calculated from end-of-shift paper logs filled in from memory — and that method is systematically optimistic, typically overstating actual utilization by eight to fifteen percentage points. The gap isn't dishonesty; it's simply that a ten-minute idle period rarely feels worth writing down in the moment, and dozens of those small gaps accumulate into a meaningfully inflated number by the end of a shift.
Manual Logs vs. Automatic State Capture: Why the Numbers Never Match
The uncomfortable side effect many plants report the first time they switch from manual logs to automatic capture: published utilization numbers drop overnight. That drop isn't a sign anything got worse — it's a sign the number finally became honest, and an honest lower number is worth more than a flattering one that was never true in the first place.
Reading Your Number Against the Real Benchmark
Federal Reserve data has US manufacturing capacity utilization sitting around the mid-70s percent range, several points below the long-run average — and that's the aggregate industry figure, not a per-machine number. At the individual machine level, connected-equipment data across thousands of CNC machines shows typical discrete manufacturing utilization clustering in the 20 to 40 percent range, with the broad average closer to 26 percent.
Discrete manufacturing machine utilization commonly falls between 20% and 40% when measured automatically, a figure that surprises most plant managers who assumed their number was substantially higher.
A large share of shops cluster specifically in the 17-20% band, with a smaller high-performing tail extending well above the typical range once idle causes are systematically addressed.
A commonly cited industry average is not automatically your target. The right approach is measuring accurately first, establishing your own baseline, and pursuing steady gains rather than chasing an arbitrary ceiling number.
Mature plants often track utilization intensively only on identified constraint or bottleneck machines, while tracking takt adherence on the rest — the same underlying data, applied with a different intent depending on the equipment's role.
Utilization, OEE, and TEEP: Three Metrics at Different Zoom Levels
Machine utilization is often discussed alongside OEE and TEEP, and the three are related but answer different business questions — a machine can score well on one and poorly on another without contradicting itself. A machine with high operational utilization, strong OEE, and comparatively low TEEP simply means it's running well within its scheduled hours but has meaningful unscheduled capacity available if demand justified using it. None of the three numbers is wrong when this happens; they're each answering a different question about the same machine, and reading only one of them in isolation risks either overstating how well the equipment is actually being used or understating how much genuine headroom exists.
Utilization
Measures runtime against available or scheduled hours — the foundational time-based question of how much of the available window was actually used for production.
OEE (Overall Equipment Effectiveness)
Combines availability, performance, and quality into a single score measured against loading time — a deeper question about how well the machine performed during the time it was scheduled to run.
TEEP (Total Effective Equipment Performance)
The same effectiveness calculation as OEE, but measured against total calendar time rather than scheduled loading time — almost always the lowest of the three figures, and the truest picture of untapped capacity.
Stop Guessing at a Number That Automated Capture Can Just Show You
iFactory reads machine state directly from your equipment, categorizes every idle minute automatically, and gives you a utilization number you can actually trust — live, not at the end of the shift.
Building Utilization Review Into a Regular Operating Cadence
A utilization dashboard that only gets opened when someone asks a pointed question in a leadership meeting rarely drives sustained improvement. The plants that actually close the gap between measured and target utilization treat the data as a recurring input to daily and weekly production decisions, not an occasional report.
Daily Shift Review
A brief daily look at the prior shift's idle categorization — not to assign blame, but to catch an emerging pattern early, such as a specific fixture consistently driving longer-than-normal changeover times.
Weekly Category Ranking
A weekly rollup ranking idle categories by total hours lost across the whole department, used to decide which improvement initiative gets attention in the coming week rather than reacting to whichever problem was most visible yesterday.
Monthly Trend Review
A monthly look at the utilization trend line by machine and by category, checking whether interventions from prior weeks actually produced a sustained improvement or whether the gains quietly reversed once attention moved elsewhere.
The cadence matters more than any single number. A plant that reviews utilization data only once a quarter tends to discover problems long after they've already cost real output, while a plant that builds the review into a daily and weekly rhythm catches drift early enough to correct it before it compounds — the same underlying data, producing very different outcomes depending on how often anyone actually looks at it.
Frequently Asked Questions
The questions below reflect what plant managers most often ask once they start looking closely at their own utilization numbers for the first time, whether the data comes from a brand-new monitoring rollout or a program that's been running for years.
Why does our utilization number drop after switching from manual logs to automatic tracking?
Manual end-of-shift logging is systematically optimistic, typically overstating actual utilization by eight to fifteen percentage points, mainly because short idle periods under a few minutes rarely get written down in the moment. Automatic state capture reads every state change directly from the machine, so the number that appears is the honest one — the drop reflects newly accurate measurement, not a sudden decline in actual performance. Visit support to see how state capture works on your equipment type.
What utilization rate should we be targeting?
There's no single universal target worth chasing — typical discrete manufacturing utilization clusters between 20% and 40% when measured automatically, but the right approach is establishing your own accurate baseline first and pursuing steady, sustained improvement from it rather than aiming at a number pulled from a general industry report. Book a demo to see how a facility-specific baseline gets established.
Should we track utilization on every machine or just the bottlenecks?
Many mature plants concentrate intensive utilization tracking specifically on identified constraint or bottleneck resources, since improving throughput there has the largest impact on overall output, while tracking a different metric like takt adherence on non-constraint equipment. The underlying data collection can still run plant-wide — the difference is which metric drives daily decisions on which machines.
How is idle time different from downtime?
Downtime typically refers to unplanned stoppages caused by faults or failures, while idle time is a broader category that includes any period a machine isn't actively producing — waiting for material, waiting for an operator, a scheduling gap, or a changeover, in addition to actual faults. Categorizing idle time by specific cause, rather than treating it as one undifferentiated block, is what makes the resulting data actionable. Contact support to see the full idle categorization taxonomy.
Can low utilization actually mean the plant doesn't need more equipment?
Yes — this is one of the most valuable insights automatic tracking surfaces. A plant considering a capital purchase to add capacity may discover that existing machines are running at 25-30% utilization, meaning the real constraint is scheduling, changeover time, or idle causes rather than a genuine equipment shortage, and the capital investment would be better spent closing that gap first.