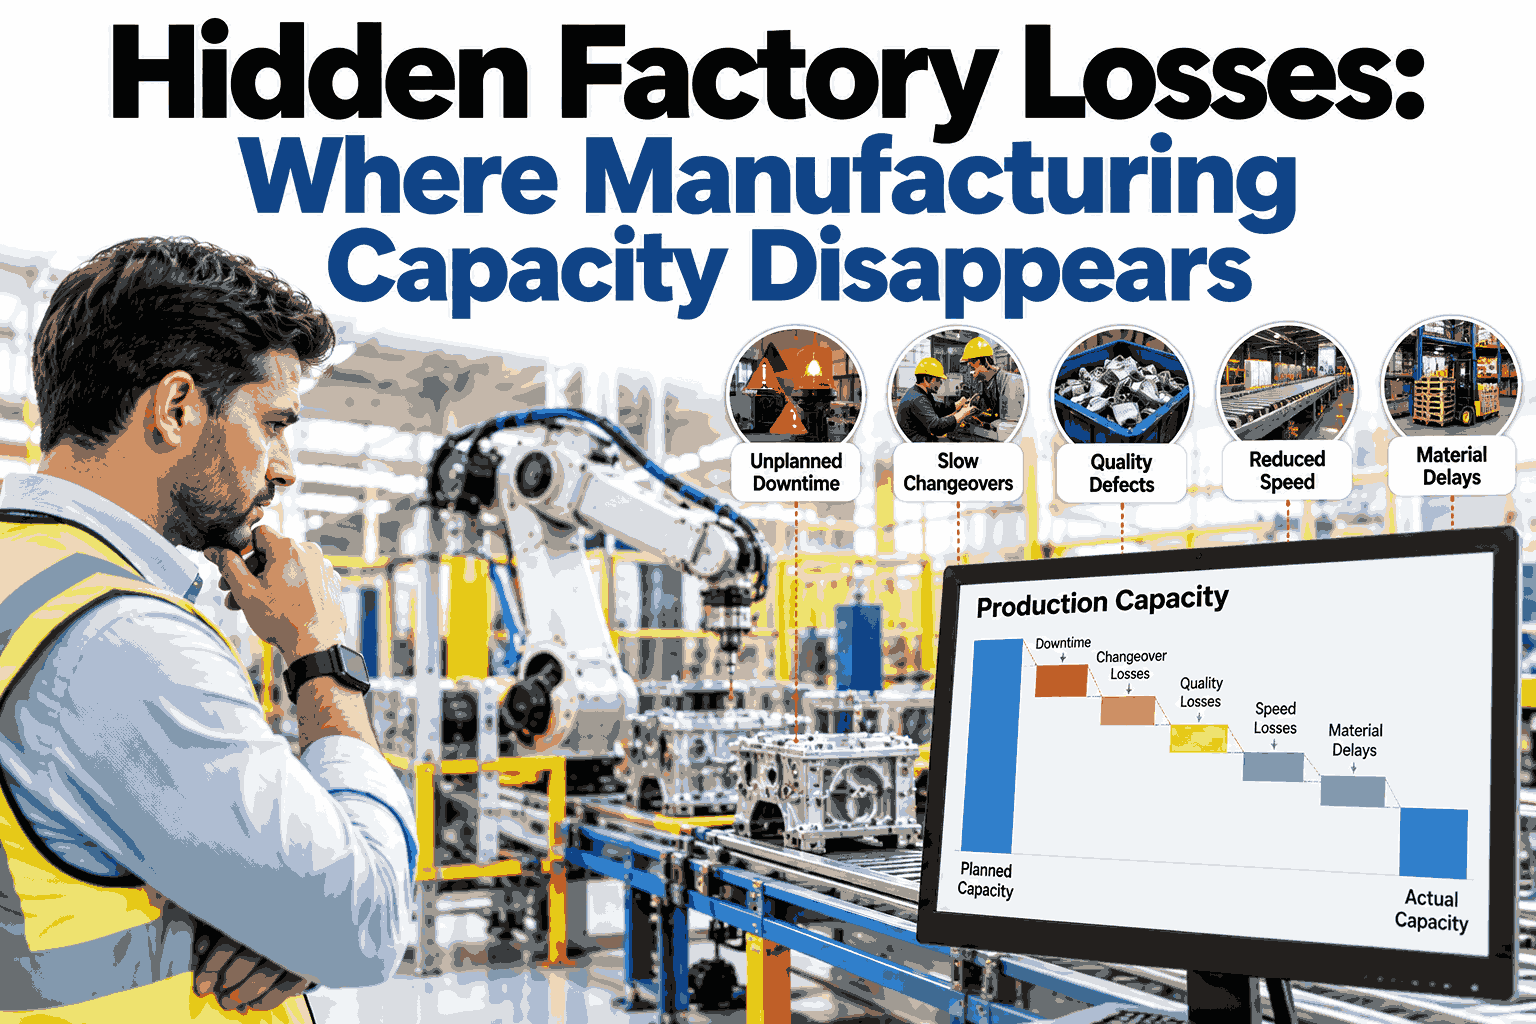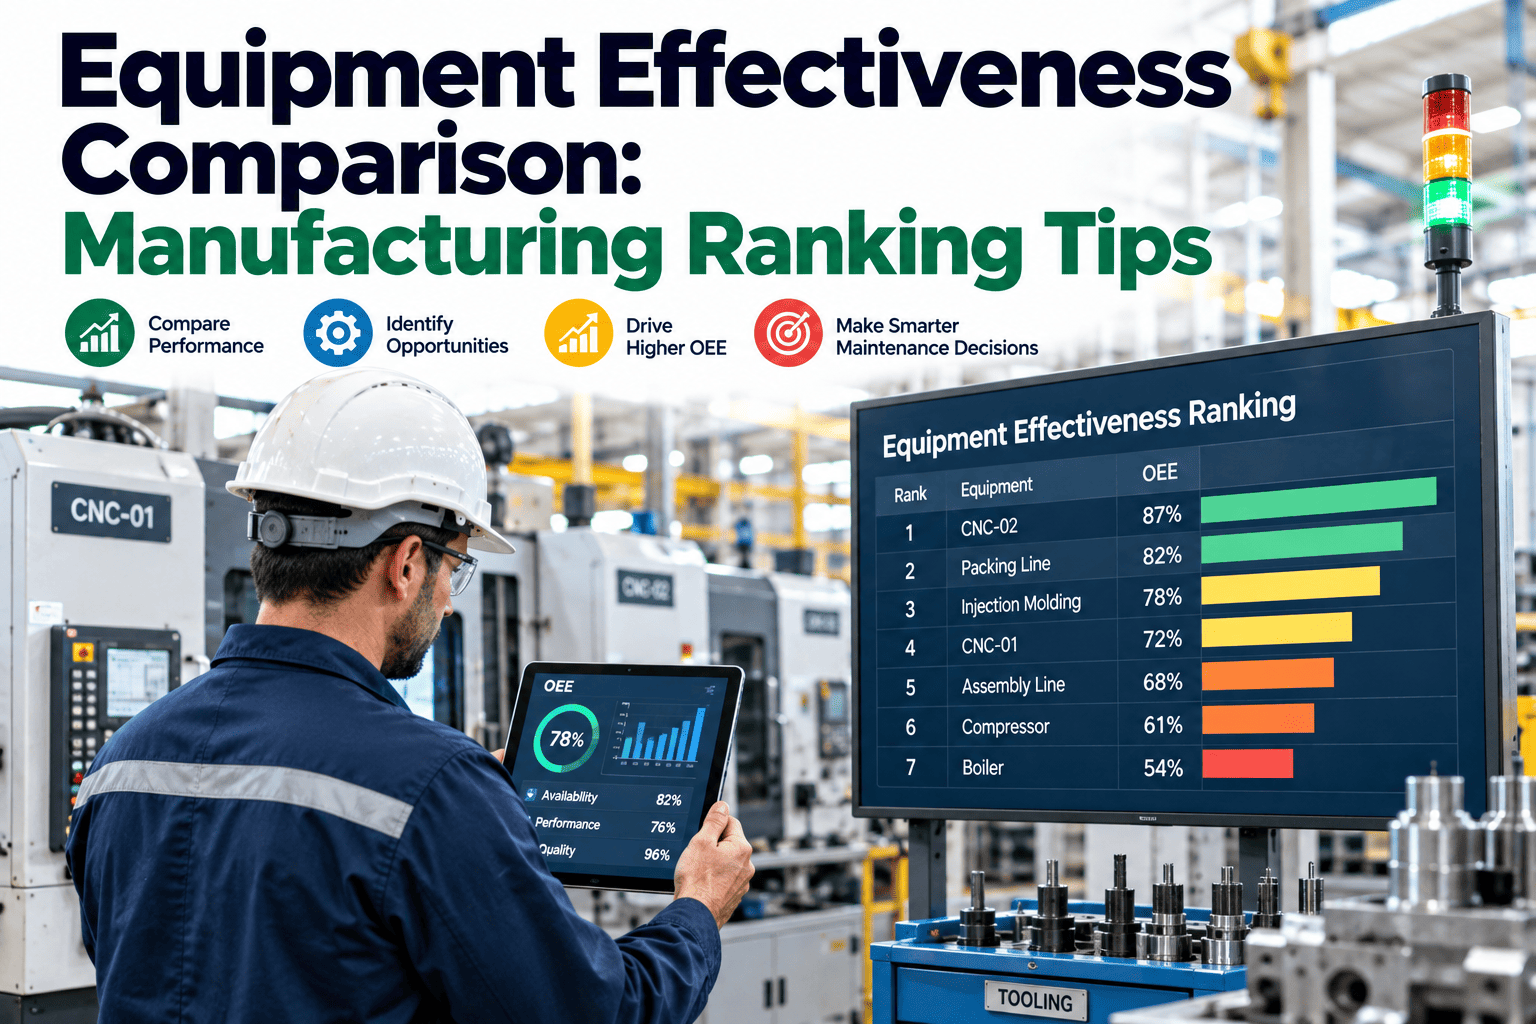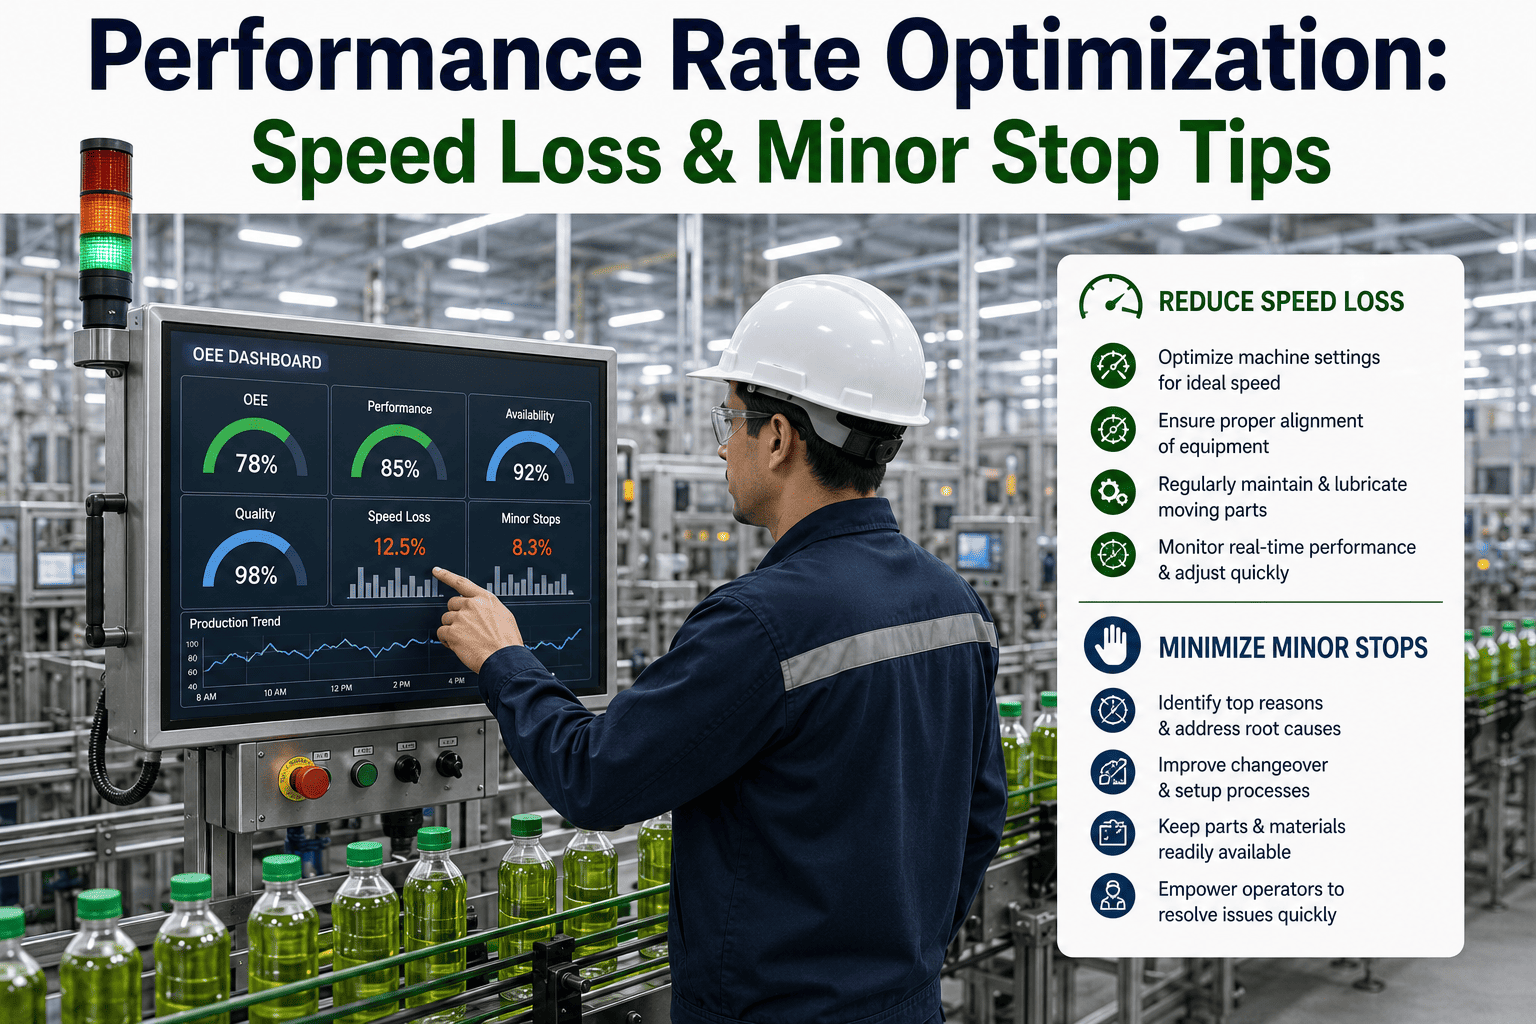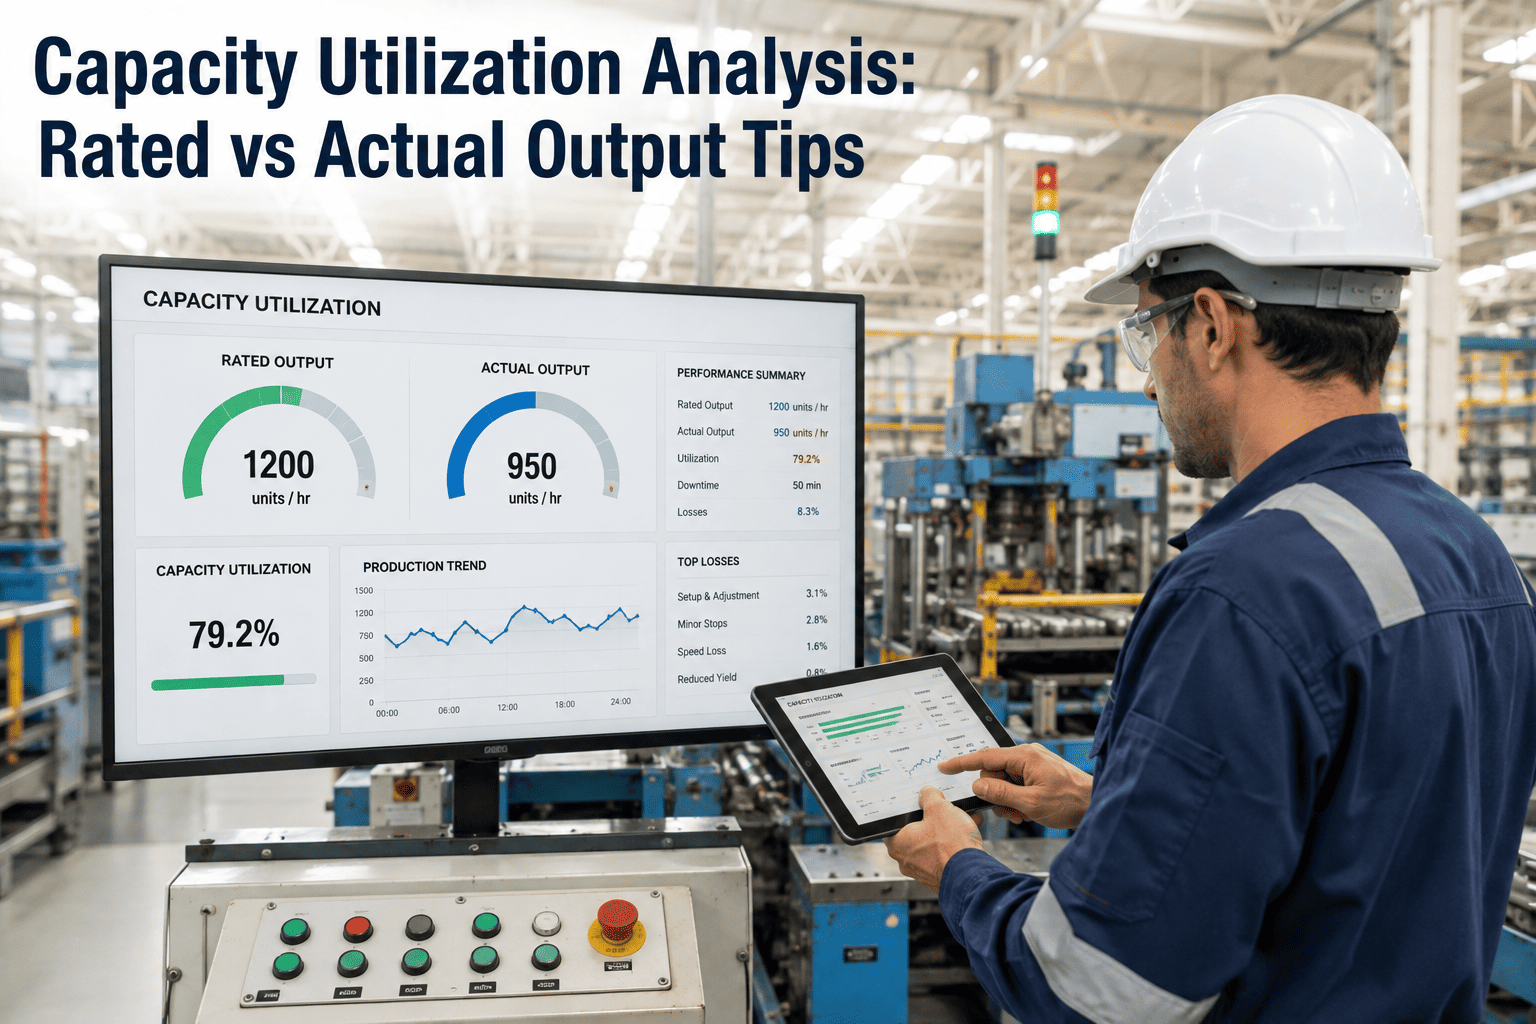
Nameplate capacity is a promise made by an equipment manufacturer under ideal conditions that rarely exist on an actual plant floor — clean material, perfect ambient temperature, no changeovers, no minor stops. Actual output almost always falls short of that number, and the gap between the two isn't a single problem with a single fix, it's usually several smaller losses stacked on top of each other that nobody has separated out. Measuring the gap without decomposing it just produces a discouraging percentage; decomposing it turns the same number into a prioritized list of what to fix first, and a working session with our team can help build that breakdown from your own production data.
Capacity Utilization Analysis: Closing the Gap Between Rated and Actual Output
Every piece of equipment has a rated capacity and an actual output, and the difference between them is where most of the recoverable throughput on a plant floor is hiding. This is how to break that gap into its component losses and decide where to act first.
The Core Comparison
Rated Capacity vs Actual Output — Three Reference Points
Rated Capacity
The manufacturer's theoretical maximum output under ideal, continuous operating conditions.
Demonstrated Capacity
The best output the equipment has actually achieved on this plant floor, under real conditions, at any point.
Actual Output
What the equipment produces on average, across a normal period, including all planned and unplanned losses.
Decomposing the Gap
The Loss Categories That Separate Rated From Actual
Treating the gap between rated and actual output as one undifferentiated number hides where the recoverable throughput actually is. Breaking it into distinct categories — each with a different root cause and a different fix — is what turns a discouraging utilization percentage into an action list.
See Your Own Capacity Gap Broken Into Its Component Losses
A short session pulls your equipment's rated, demonstrated, and actual output side by side and separates the gap into planned downtime, unplanned downtime, speed loss, and quality loss.
Root Cause by Category
What Typically Drives Each Loss Category
| Loss Category | Common Root Cause | Typical First Fix |
|---|---|---|
| Speed Loss | Material variability or aging tooling | Standardize material specs, restore tooling condition |
| Unplanned Downtime | Reactive maintenance culture | Shift toward condition-based maintenance |
| Quality Loss | Process drift undetected until final inspection | Move inspection earlier in the process |
| Planned Downtime | Long changeovers built into the schedule | Apply SMED-based setup time reduction |
Setting a Realistic Target
Why Demonstrated Capacity Is a Better Benchmark Than Rated Capacity
Chasing rated capacity as the target is usually a mistake, because it was calculated under conditions the plant floor rarely replicates — and comparing actual performance against an unreachable number tends to demoralize a team rather than direct their effort. Demonstrated capacity, the best output the equipment has actually achieved under real plant conditions, is a far more useful benchmark because it proves the number is achievable and shows exactly what conditions produced it. The gap worth chasing first isn't the full distance down to rated capacity — it's the distance between average actual output and the plant's own demonstrated best, since closing that gap means recreating conditions the equipment has already proven it can hit rather than reaching for a theoretical ceiling that was never realistic to begin with.
Set a Capacity Target Your Team Can Actually Hit
See what your equipment has already demonstrated it can do, and use that as the benchmark instead of an unreachable rated number.
Measurement Practice
Why the Measurement Window Matters as Much as the Number Itself
A single utilization percentage calculated over a month can hide a lot — a line that ran at ninety percent for three weeks and thirty percent for one week averages to a number that looks acceptable but obscures a serious event worth investigating. Measuring utilization at a shift or daily level, and only rolling it up to a monthly view for trend reporting, keeps the underlying volatility visible instead of averaging it away. It also matters what "available time" the calculation uses as its denominator — total calendar time, scheduled production time, and planned run time after breaks all produce meaningfully different utilization percentages from the same actual output, so comparing numbers across plants or even across lines within the same plant requires confirming everyone is using the same denominator before drawing conclusions from the comparison.
The plants that make the fastest progress on capacity utilization are the ones that stop treating it as a single number to improve and start treating it as four separate numbers stacked on top of each other. Once a team can see that half their gap is speed loss from aging tooling and the other half is unplanned downtime from a specific failure mode, the conversation changes from "we need to run faster" to two very specific, fundable projects.
Anaïs Bergström-Oduya
Capacity Planning & Utilization Analyst · 10 years across discrete and process manufacturing
Frequently Asked
Capacity Utilization Analysis — Common Questions
What's a realistic capacity utilization target for most manufacturing equipment?
There's no universal number since it depends heavily on process type and equipment category, which is exactly why demonstrated capacity — your own equipment's proven best — is a more useful target than a generic industry benchmark pulled from a different context. Book a review to establish a realistic target from your own historical data.
How is capacity utilization different from OEE?
OEE combines availability, performance, and quality into a single equipment-level score, while capacity utilization analysis specifically compares actual output against a rated or demonstrated benchmark — the two overlap conceptually but utilization analysis is typically used for longer-term planning and investment decisions rather than shift-level monitoring.
Should planned downtime count against utilization at all?
Most plants track two versions — one that excludes planned downtime to isolate unplanned losses, and one that includes it to reflect true available capacity for scheduling purposes — since both answer different questions and conflating them tends to hide changeover time as a cause worth addressing. Ask our team which version fits your current planning process.
How often should a capacity gap breakdown be recalculated?
A monthly recalculation is typically enough to catch shifting loss categories, though any major process, tooling, or material change is worth an immediate re-check since the breakdown can shift substantially after a single significant change. Book a session to set up a recurring review cadence.
Can this analysis help justify a capital investment request?
Yes — a clear breakdown showing that a specific loss category, such as speed loss from aging tooling, accounts for a defined share of the total gap gives a far stronger, more specific case for capital than a general statement that the line "isn't running fast enough." Contact support to see how this breakdown has supported capital requests at similar plants.
Turn Your Capacity Gap Into a Prioritized List, Not Just a Percentage
iFactory breaks the gap between rated and actual output into planned downtime, unplanned downtime, speed loss, and quality loss — so you know exactly where to focus first.