A line that never stops for more than a few seconds at a time looks healthy on every dashboard that tracks downtime. It can still be losing more output than a line with a full hour-long breakdown once a month — because nobody is counting the eighty six-second pauses that happened between shift start and lunch. One automotive stamping supplier discovered exactly this: manual logs blamed 70% of lost output on equipment failure, but once every stop was captured automatically, minor stops turned out to be the largest loss category at 34%, with breakdowns accounting for only 18%. iFactory's cycle-time monitoring exists to catch that gap before it costs a plant a year of underperformance nobody can see.
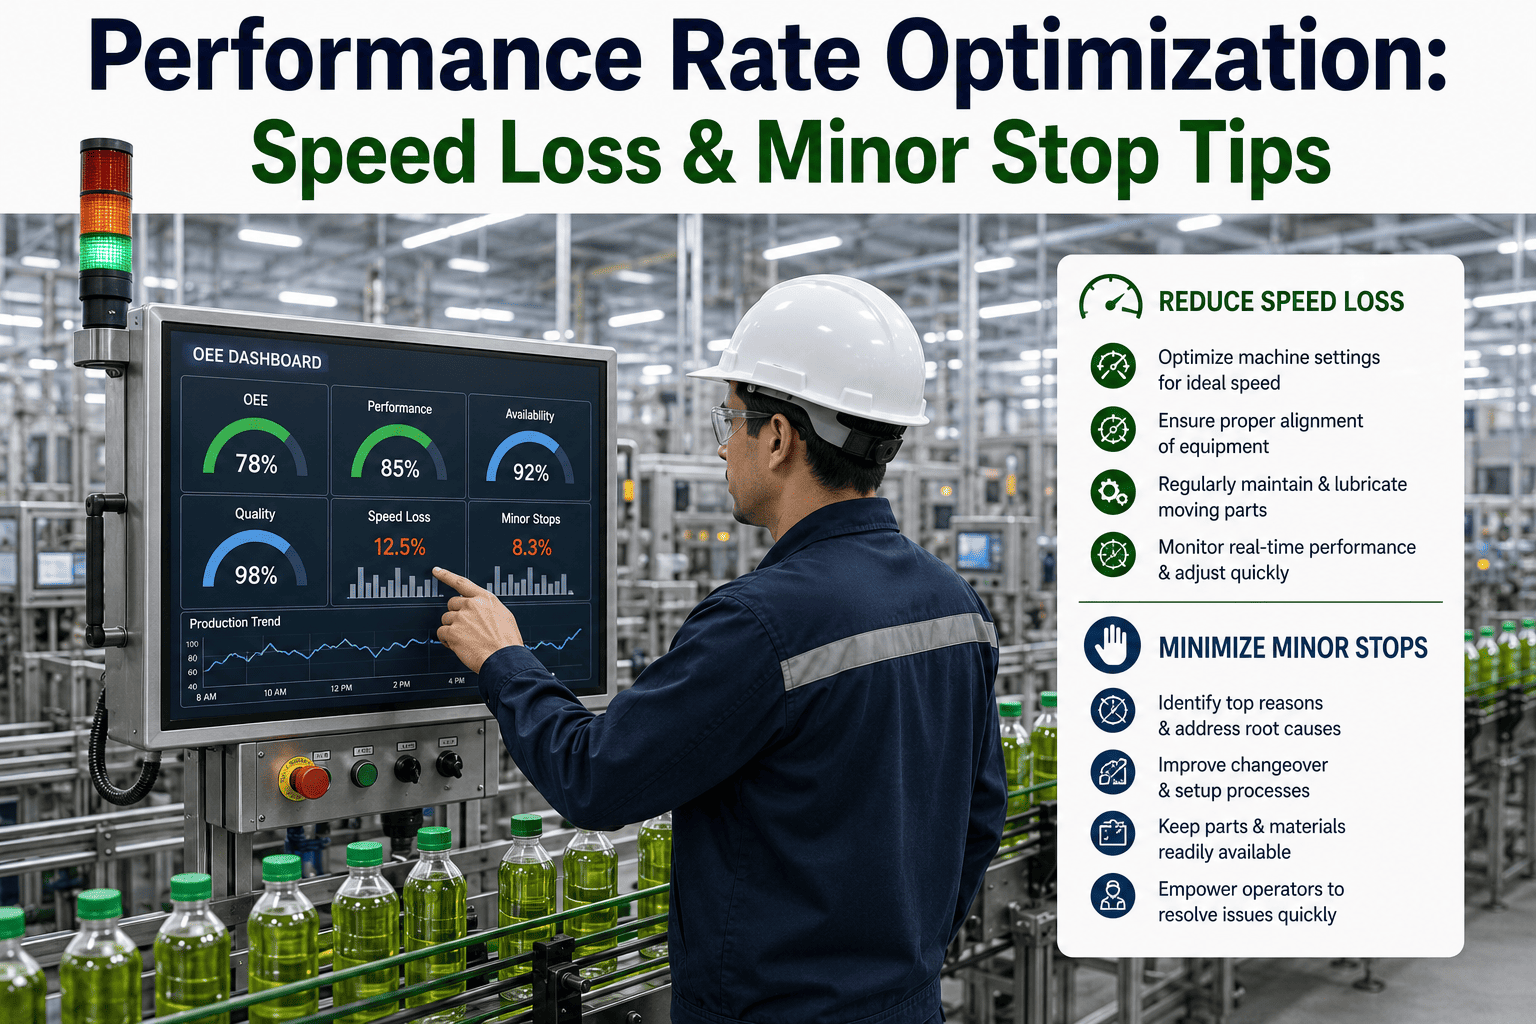
Performance Rate Optimization: Eliminating Speed Loss and Minor Stops
A line can run all shift without a single logged downtime event and still be losing a third of its output. This guide covers how to find that loss, measure it honestly, and close the gap between rated speed and what a line actually produces.
Why Performance Loss Is the Loss Category Nobody Trusts
Of the three OEE components, Performance is the one most likely to be wrong on a standard dashboard — not because it's hard to calculate, but because the input data is almost always incomplete. Availability losses get logged because they're dramatic: a line stops, someone notices, someone writes it down. Performance losses are the opposite of dramatic. A six-second pause to clear a jam, cleared by the operator without ever stopping to think about it, leaves no trace anywhere. By the end of a shift with eighty of these events, the data simply doesn't exist — not buried in a report, not miscategorized, just never captured.
This is why Performance is frequently the most underestimated of the Six Big Losses categories in plants still relying on manual downtime logs. The Intelycx case referenced above is not an isolated finding — it reflects a structural bias in how manual logging works: big, obvious events get written down, and small, forgettable ones don't, regardless of how much output they actually cost in aggregate.
The consequence of that bias compounds in a specific direction. When a plant believes equipment failures are the dominant loss category — because that's what the manual logs show — improvement budget and engineering attention flow toward maintenance and reliability programs. Those programs are rarely wasted effort; breakdowns are real and worth reducing. But if minor stops and speed loss are actually the larger category once measured honestly, the plant is investing heavily in the smaller problem while the larger one continues unaddressed, simply because nobody has visibility into its true size. Correcting the measurement doesn't just produce a more accurate number — it redirects where limited improvement resources actually go.
See Your Real Performance Rate, Not the One Built on Missing Data
iFactory captures every cycle time and every stop automatically from the machine, so Performance is calculated from what actually happened — not from what an operator remembered to write down.
The Two Components of Performance Loss
Performance loss splits into two distinct mechanisms that require different fixes. Treating them as one problem — "the line is slow" — obscures which specific intervention will actually move the number.
Calculating Performance Honestly
The standard OEE Performance formula is straightforward on paper: Performance equals Ideal Cycle Time multiplied by Total Count, divided by Run Time. Equivalently, it's actual production speed divided by ideal speed. If a line's ideal cycle time is 30 seconds per unit and it produced 700 units across 384 minutes of run time, that's 21,000 ideal seconds against 23,040 actual seconds — a Performance rate of 91%.
This is where the formula quietly breaks in most plants: Run Time is supposed to represent every minute the equipment was actually producing, which means minor stops need to be subtracted out of it just as thoroughly as major breakdowns are. If minor stops aren't being logged — because they're too short and too frequent to capture manually — then Run Time is overstated, Total Count divided by that inflated Run Time looks artificially close to ideal, and the calculated Performance rate is simply wrong. The formula isn't broken. The input data feeding it is incomplete, and no formula can correct for data that was never captured.
Setting an Honest Ideal Cycle Time
Performance is only as meaningful as the ideal cycle time it's measured against, and this number is wrong more often than plants realize. A common failure mode: the ideal cycle time on record is the manufacturer's nameplate speed, set under laboratory conditions that don't reflect the specific product, material, or environment the line actually runs. Recalibrating ideal cycle time against the line's own demonstrated best — the fastest sustained rate it has actually achieved running the current product, not a theoretical spec sheet number — is one of the highest-leverage, lowest-cost interventions available, because it corrects the denominator every subsequent Performance measurement depends on.
Recalibrate Ideal Cycle Time Against What the Line Actually Achieves
iFactory tracks demonstrated best cycle time per product, per line, so Performance targets are grounded in reality — not a nameplate spec that was never realistic for your process.
Diagnosing Speed Loss: The Product Cycle vs. the Machine Cycle
Not every speed shortfall is a mechanical problem. A useful distinction: the machine cycle is the time the equipment itself needs to complete its core operation, while the product cycle includes the handling time before and after — loading, positioning, unloading — that surrounds the machine's actual work.
Consider a machine whose core cycle takes 7 seconds, but the operator needs 9 seconds to load the part beforehand and 12 seconds to unload it afterward. The product cycle is 9 plus 7 plus 12, or 28 seconds — meaning the machine, even while technically "running" and logging no stoppage at all, is only doing productive conversion work for 25% of that cycle. The other 75% is the machine waiting on manual handling. This shows up on a dashboard purely as a speed loss, and a team chasing "why is the machine slow" will find nothing wrong with the machine — because the machine isn't the bottleneck. The handling process around it is.
This distinction matters because it changes where improvement effort should go. A genuine mechanical speed loss — a worn bearing, a degraded servo, an outdated program — gets fixed with maintenance or an engineering change to the equipment itself. A handling-driven speed loss gets fixed with ergonomics, fixturing, or automation of the load/unload step — solutions that have nothing to do with the machine's mechanical condition and everything to do with the process wrapped around it.
Micro-Stop Detection: Why Manual Logging Structurally Fails
Micro-stops are chronically under-reported for a reason baked into how manual logging works, not because operators are careless. A ten-second stop feels insignificant in the moment it happens. Nobody wants to log eighty separate events in a shift — doing so would take longer than the stops themselves consumed. By the time an end-of-shift report gets filled out, the fifty micro-stops that happened three hours earlier are simply gone from memory, and only the handful of longer, more memorable events survive to be recorded.
There is also a normalization effect that compounds the reporting gap over time. When a machine stops fifty times a day, every day, for months, the team stops perceiving those stops as a problem at all — they become the accepted texture of running that line, indistinguishable from normal operation in the operators' day-to-day experience even though each one is genuine lost production. This is different from simple forgetfulness; it's a shift in what counts as noteworthy. A stop that would have triggered an investigation the first week it appeared eventually stops registering as anything worth mentioning, which is precisely why automatic detection matters more the longer a chronic minor-stop pattern has been running uncorrected.
| Detection Method | Micro-Stop Capture Rate | Root Cause Attribution | Practical Limitation |
|---|---|---|---|
| End-of-shift manual log | Very low — mostly memory-dependent | Rare, vague when present | Events forgotten within hours |
| Operator logs in real time | Moderate, degrades under high frequency | Better, but adds operator burden | Logging time exceeds stop time |
| Automatic PLC cycle-time capture | Near-complete | Requires additional context to attribute cause | Needs integration with machine control |
| PLC capture + vision/sensor context | Near-complete | Strong — cause inferred from correlated signals | Highest setup investment, highest accuracy |
Common Mistakes That Keep Performance Rate Flat
Measuring Performance against a nameplate speed nobody has ever achieved. An unrealistic ideal cycle time makes every Performance calculation pessimistic and undermines trust in the metric — teams start ignoring a number that never reflects reality, even when the underlying process genuinely improves.
Treating minor stops as too small to matter individually. Any single six-second stop is negligible. Eighty of them in a shift are not — and the mistake compounds because each one is genuinely too small to justify manual logging, which is exactly why they need to be captured automatically instead of ignored.
Diagnosing every speed shortfall as a mechanical problem. A slow product cycle driven by manual load/unload handling around a perfectly healthy machine will not respond to mechanical maintenance, because the machine was never the bottleneck. Distinguishing machine cycle time from product cycle time is the difference between fixing the right problem and maintaining a component that was already fine.
Letting conservative speed settings from a changeover become permanent. A cautious speed setting applied during a changeover to avoid early-run defects frequently never gets optimized back to standard once the line stabilizes, quietly capping Performance well below what the line is actually capable of for months or years.
Reviewing Performance loss without separating speed loss from minor stops. A single blended Performance number tells you output was lost but not which of the two distinct mechanisms caused it — and the corrective actions for each are different enough that a blended view routinely sends improvement effort in the wrong direction.
Performance Optimization KPIs to Track
Performance Rate
Actual output divided by theoretical maximum output at ideal cycle time. The direct, single-number measure of how close a line runs to its true potential while operating.
Minor Stop Frequency
Count of sub-five-minute stoppages per shift, per line. A rising trend, once capture is automated, often reflects genuine detection improvement before it reflects a genuine process problem — track the trend after automation stabilizes, not the raw jump when logging first improves.
Cycle Time Variance
Spread between fastest and slowest sustained cycle times for the same product on the same line. High variance signals an inconsistent process — worth investigating even when average Performance looks acceptable.
Stale Speed Settings
Machines still running at a changeover-era conservative speed setting more than a defined number of shifts after the changeover, never re-optimized to standard.
Every plant manager I've worked with can tell you their last major breakdown down to the hour. Almost none of them can tell you their minor stop count for last Tuesday, and that asymmetry is exactly the problem. Performance loss doesn't announce itself. It accumulates in increments too small for anyone to notice individually, and by the time it shows up as a disappointing OEE number at month-end, there's no memory left of which specific events caused it. The plants that actually move their Performance rate are the ones that stopped asking operators to remember and started capturing cycle time automatically, every cycle, without exception.
Where to Start: Prioritizing Speed Loss vs. Minor Stops
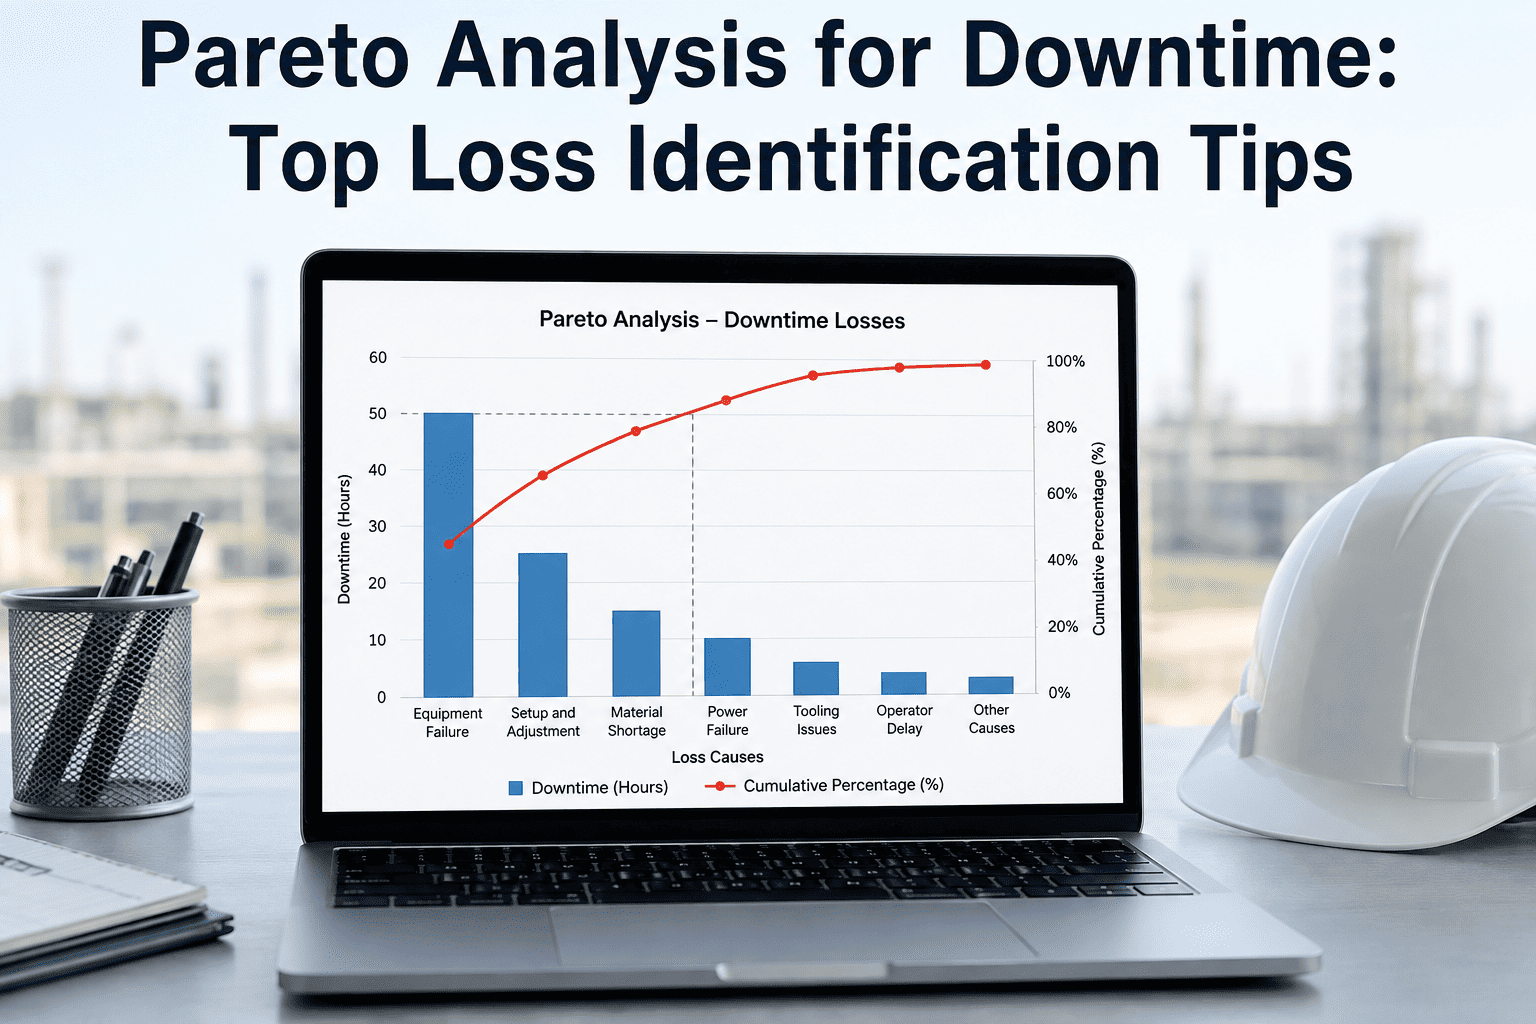
Once Performance loss is measured accurately and separated into its two components, the practical question becomes which one to tackle first. The Pareto principle applies here the same way it does across every other OEE improvement effort: rank the two categories by their actual lost-output impact on a specific line, and concentrate effort on whichever one is larger before splitting attention across both simultaneously.
In practice, the answer differs by line type and often by product. High-cycle-count, high-frequency-stop lines — packaging, filling, small-parts assembly — tend to see minor stops dominate the loss profile, because the sheer number of cycles multiplies even a small per-cycle stop probability into a large cumulative total. Slower, lower-frequency lines producing larger or more complex parts tend to see speed loss dominate instead, because there are fewer opportunities for a jam or misfeed but more opportunity for a cautious, sub-optimal cycle time to persist unnoticed across every single unit produced. Neither pattern is universal, which is exactly why measuring both categories separately — rather than assuming based on general line type — matters more than following a generic industry rule of thumb.
Frequently Asked Questions
The industry-standard convention, established in Nakajima's original TPM framework and still widely used, sets the dividing line at five minutes: stoppages shorter than five minutes are classified as minor stops and count against Performance, while stoppages of five minutes or longer are classified as equipment failures and count against Availability. Some plants adjust this threshold to fit their own process characteristics, but consistency matters more than the exact number — a threshold that changes from shift to shift or line to line makes cross-comparison meaningless. Book a demo to see how iFactory applies a consistent, configurable threshold across every line automatically.
Manual logging is structurally biased toward capturing large, memorable events and missing small, frequent ones — a six-second jam cleared without a second thought leaves no trace, while a one-hour breakdown gets written down because it was disruptive enough to remember. By the end of a shift with dozens of brief stoppages, most of that history is simply gone, not miscategorized or buried in a report but never captured at all. This is why plants that switch from manual logs to automatic cycle-time capture routinely discover minor stops were a far larger loss category than equipment failures, even when equipment failures were the visible, discussed problem beforehand. Book a demo to see your actual minor stop frequency once every event is captured automatically.
An ideal cycle time pulled directly from equipment nameplate specifications is frequently unrealistic, because nameplate speeds are often established under controlled conditions that don't reflect the specific product, material, or environmental factors a real production line contends with. A more reliable approach recalibrates ideal cycle time against the line's own demonstrated best — the fastest sustained rate it has actually achieved producing the current product — since that number reflects genuine achievable performance rather than a theoretical maximum nobody has hit in practice. Book a demo to see how iFactory tracks demonstrated best cycle time automatically per product and line.
Speed loss can originate from manual handling time surrounding the machine's actual work rather than from the machine itself — a product cycle combining load time, machine cycle time, and unload time can be dominated by the handling steps, leaving the machine technically running but productively active for only a small fraction of each cycle. In this scenario, mechanical maintenance won't move the Performance number, because the machine was never the bottleneck; the fix lies in ergonomics, fixturing, or automating the load and unload steps instead. Distinguishing machine cycle time from total product cycle time is essential before committing maintenance resources to a problem that maintenance can't actually solve. Book a demo to see machine cycle time and product cycle time broken out separately on your own lines.
They should be tracked separately, even though both roll up into the same overall Performance figure, because they respond to different corrective actions. Speed loss often traces to equipment wear, cautious operator settings, or material quality variation, and typically responds to engineering, maintenance, or process adjustment. Minor stops trace to a different set of causes — jams, misfeeds, sensor trips — and typically respond to a closed-loop detection-and-fix cycle targeting the specific recurring failure points. A single blended Performance number tells you output was lost without telling you which of these two mechanisms actually caused it, which routinely sends improvement teams after the wrong fix. Book a demo to see speed loss and minor stops broken out as distinct, actionable categories.
Find the Performance Loss Your Current Logs Can't See
iFactory captures every cycle and every stop automatically, separates speed loss from minor stops, and recalibrates ideal cycle time against what your lines actually achieve — so Performance finally reflects what happened, not what got remembered.