A rolling mill loses throughput in places a shift-end report will never show — a coil that ran three percent slow through the finishing stand, a changeover that took eleven minutes longer than the standard, a strip that failed gauge tolerance and got coiled anyway. Individually these look small. Across a year of production they are the difference between a mill running at industry-average efficiency and one running at the top of its class. Most mills discover the gap only after connecting real-time OEE data to every stand — book a demo to see where your throughput is actually going.
Steel Plant · OEE Analytics
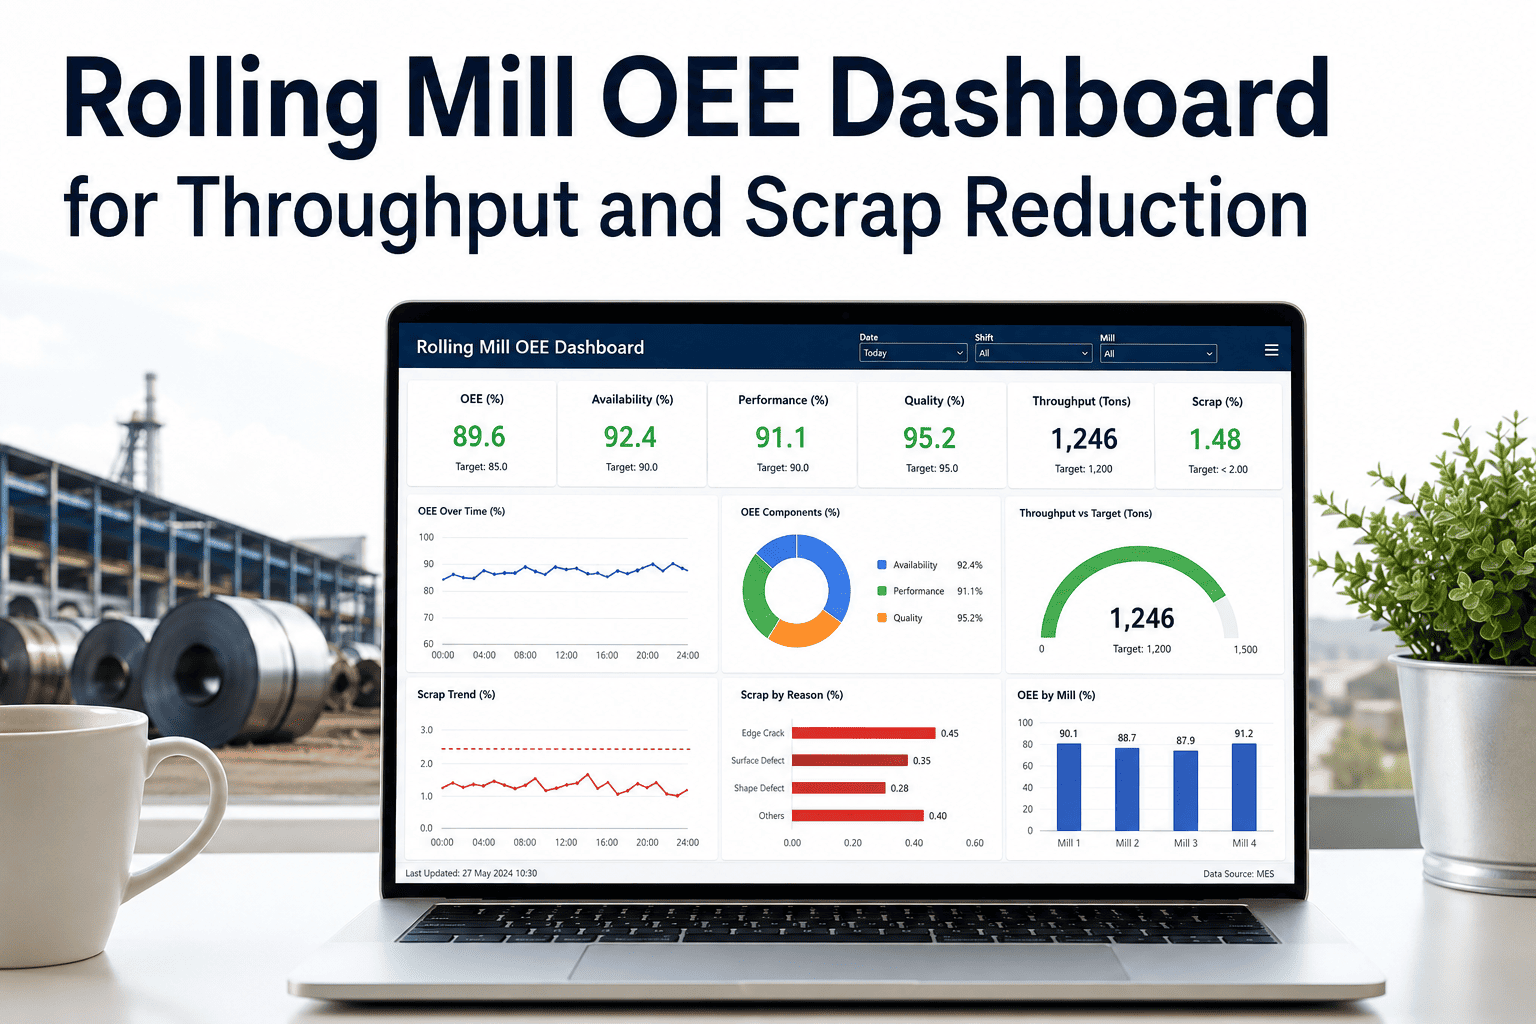
Rolling Mill OEE Dashboard for Throughput and Scrap Reduction
Stand-by-stand visibility into availability, speed, and yield — built to catch the losses that hide inside a rolling mill's changeovers, threading cycles, and gauge drift.
Where a Rolling Mill Loses Throughput
A coil passes through several distinct stages before it reaches the coiler, and each stage has its own way of quietly eating into OEE.
Reheat Furnace
Slab discharge temperature variance forces roughing stands to compensate, slowing the whole line down.
↓
Roughing Stand
Descaling delays and pass-schedule adjustments add seconds per slab that compound over a full shift.
↓
Finishing Mill
Threading failures and strip breaks are the single largest source of unplanned stops on most hot strip mills.
↓
Coiler
Gauge and width deviations caught only at the coiler mean scrap has already consumed energy and time upstream.
The Three Numbers That Multiply Into OEE
A mill can look healthy on any single metric and still be losing significant output once availability, performance, and quality are multiplied together.
Availability — changeovers, breakdowns, threading stops
Performance — roll speed vs. rated line speed
Quality — coils meeting gauge and width on first pass
Five Steps to Lift Mill OEE Without New Equipment
1
Instrument every stand, not just the line
Roughing, finishing, and coiler each need independent speed and stop data — a single line-level number hides which stand is the real bottleneck.
2
Track scrap back to its root cause
Coding rejects by gauge deviation, width, surface defect, or edge crack turns a scrap percentage into a prioritized action list.
3
Standardize changeover sequencing
Roll changes and width transitions run faster and more consistently when the sequence is enforced digitally instead of by memory.
4
Correlate reheat temperature with downstream speed loss
Slabs leaving the furnace outside target temperature are a leading indicator of the roughing stand having to slow down minutes later.
5
Review live OEE at every shift handover
Crews reacting to the current shift's losses close gaps far faster than crews reviewing a report from three days ago.
A single hour of unplanned finishing mill downtime can cost more than a week of software subscription. Threading failures and strip breaks are preventable once the leading indicators are visible in real time.
What Mills Report After Connecting Stand-Level OEE
68% → 79%
OEE improvement on a hot strip mill after adding stand-level speed and stop tracking across roughing and finishing.
-31%
Reduction in gauge-related scrap after linking coiler rejects back to reheat furnace discharge temperature trends.
Line-Level Reporting vs. Stand-Level OEE
| Factor | Line-Level Reporting | Stand-Level OEE |
|---|
| Bottleneck identification | One number for the whole mill | Bottleneck stand identified directly |
| Scrap attribution | Total scrap percentage only | Coded by defect type and stand |
| Changeover analysis | Average changeover time | Sequence-by-sequence breakdown |
| Reaction time | Next-shift or next-day review | Live during the current shift |
Frequently Asked Questions
What is a realistic OEE target for a hot strip or cold rolling mill?
Targets vary by mill configuration and product mix, but most integrated hot strip mills operate in the 65 to 75 percent range while top-performing lines with strong changeover discipline push into the high 70s and low 80s. Cold rolling mills with fewer stand transitions can often run a few points higher. The more useful benchmark is steady improvement against your own accurately measured stand-level baseline rather than a generic industry figure.
Book a demo to get a benchmark specific to your mill configuration.
How does stand-level tracking find losses that line-level reporting misses?
A line-level OEE number averages every stand together, so a finishing mill running well below rated speed can be masked by a roughing stand running close to target. Stand-level tracking separates speed, stop, and reject data by location, which is what actually reveals whether the bottleneck sits in threading, in a specific stand's roll wear, or in coiler gauge control.
Contact support to see how stand-level breakdowns apply to your mill layout.
Can this connect to our existing Level 2 automation and PLC systems?
Yes, the platform is designed to read speed, stop, and reject signals from existing Level 2 automation, PLCs, and drive systems rather than requiring new field instrumentation on every stand. This means most mills can have stand-level OEE running within weeks using data that already exists in the control system, without a shutdown for installation.
Book a demo to review integration with your current automation stack.
How is scrap linked back to its root cause instead of just totaled?
Every rejected coil is tagged with a defect code — gauge deviation, width out of tolerance, edge crack, or surface defect — and cross-referenced against upstream process data such as reheat temperature and roll force at the time that section of strip was produced. Over time this builds a Pareto view showing which upstream condition is driving the majority of scrap, rather than leaving teams to guess.
Contact support for help setting up defect coding on your line.
How quickly can a mill expect to see OEE improvement?
Most mills identify their top three loss categories within the first two to three weeks of live data collection, since stand-level Pareto charts surface patterns that were previously invisible in aggregate reporting. Measurable OEE gains typically follow within one to two production quarters as crews act on daily data during shift huddles instead of reviewing historical reports after the fact.
Book a demo to see a realistic improvement timeline for your mill.
See Every Stand's OEE, Not Just the Mill Average
Stand-by-stand availability, performance, and quality tracking that turns scrap and downtime into a prioritized action list.