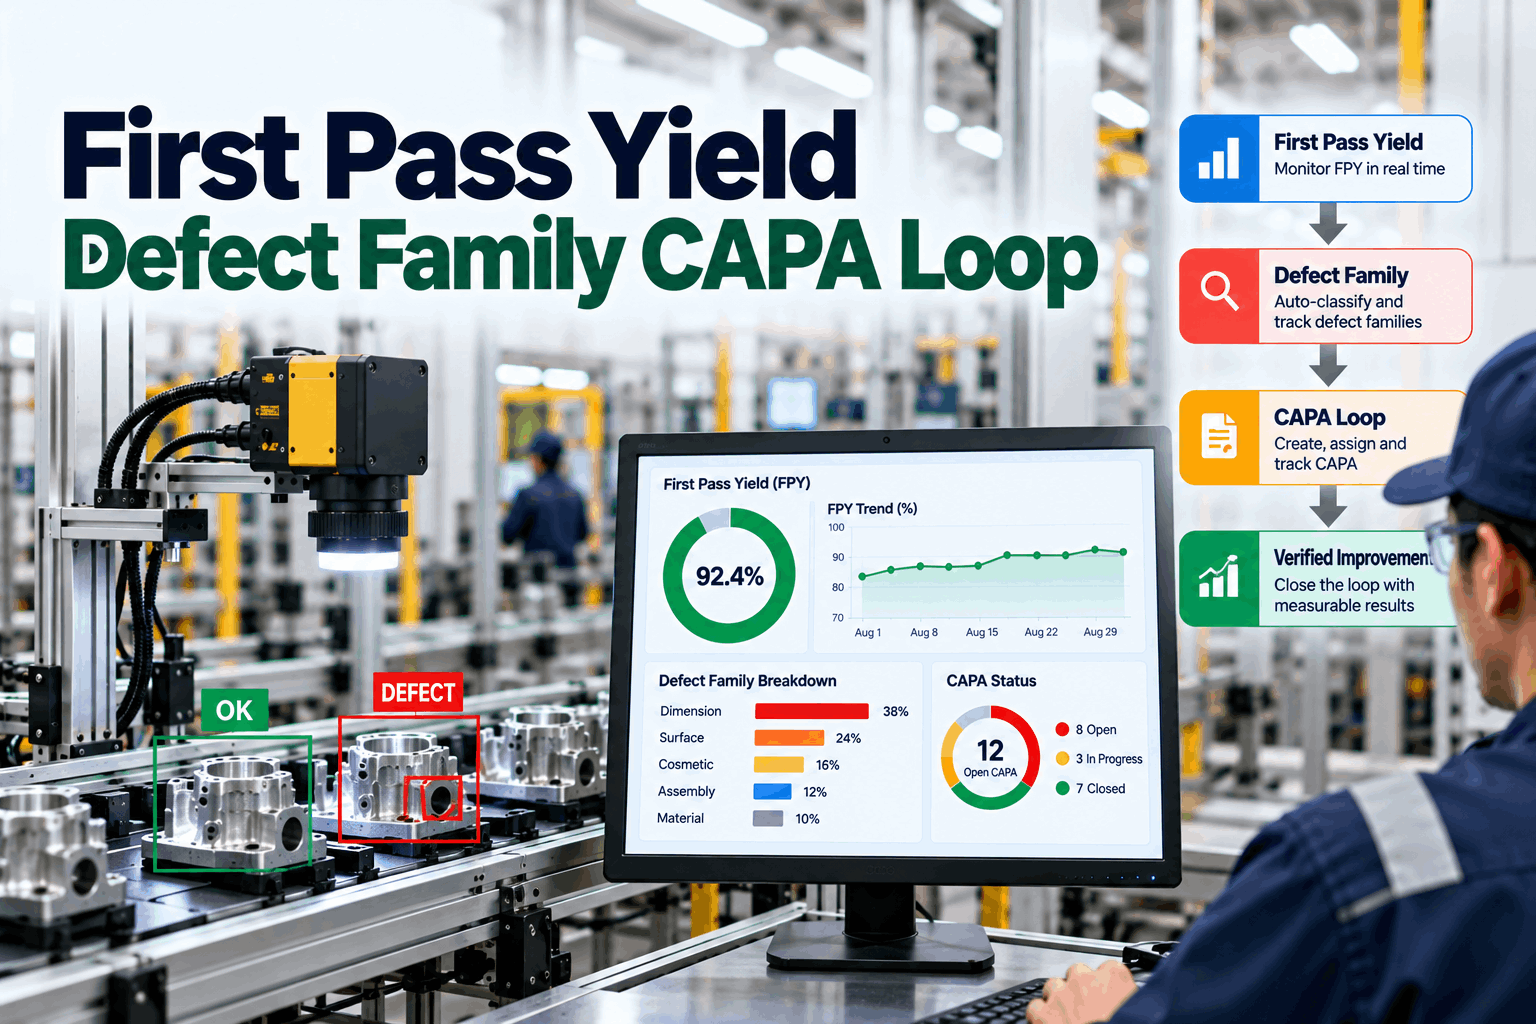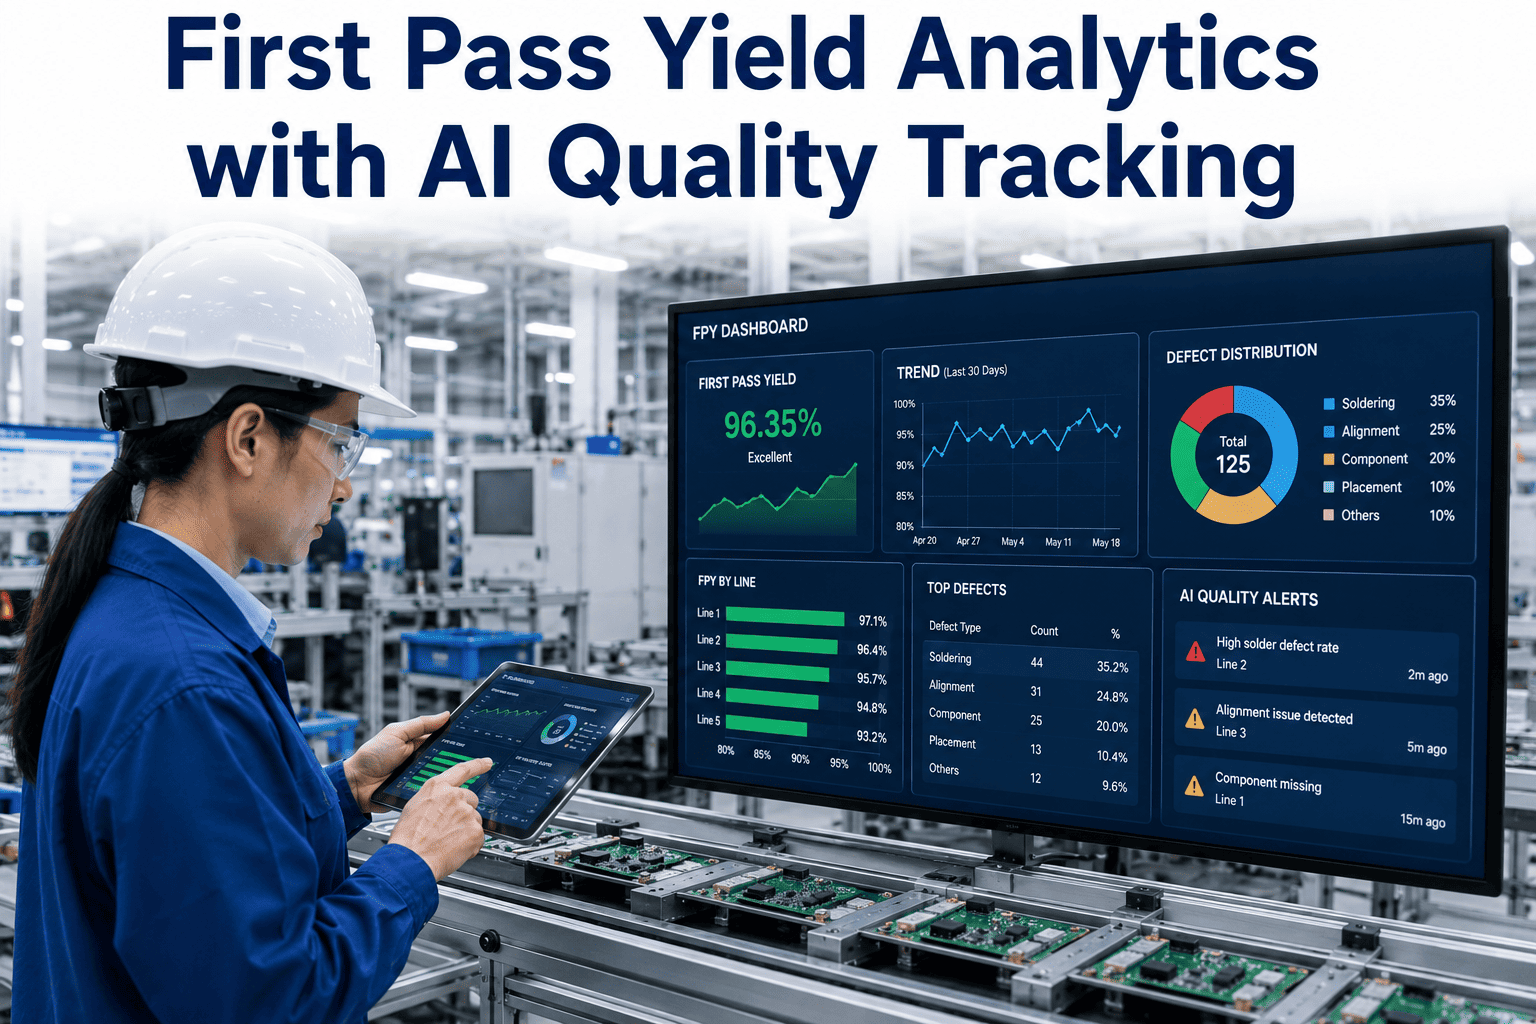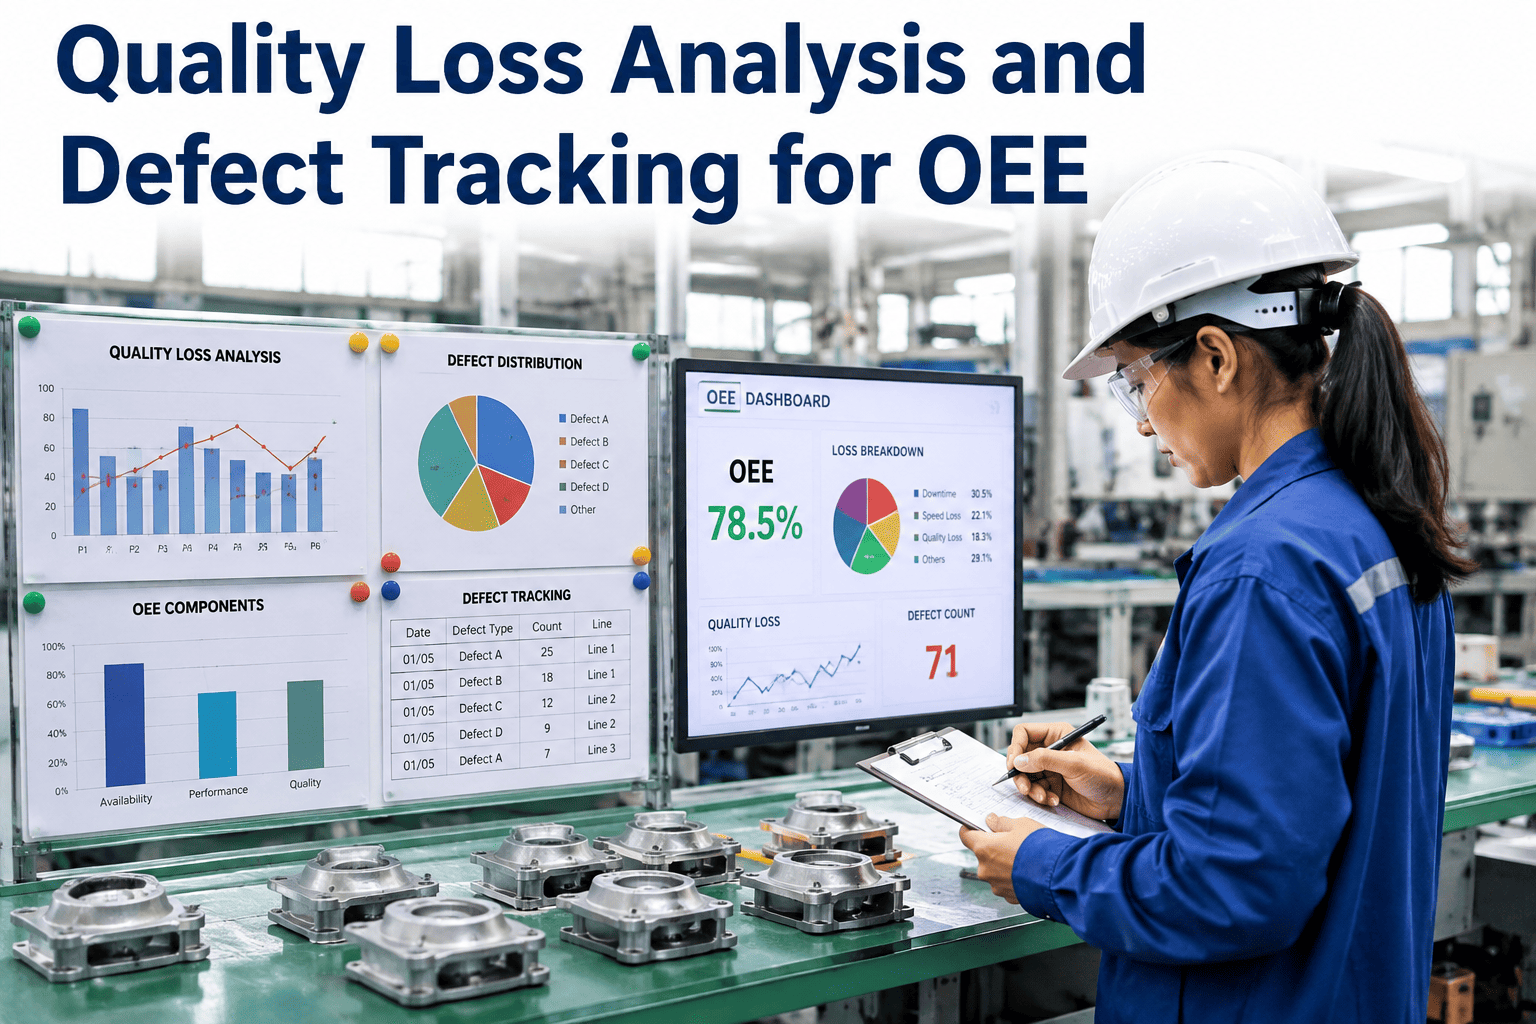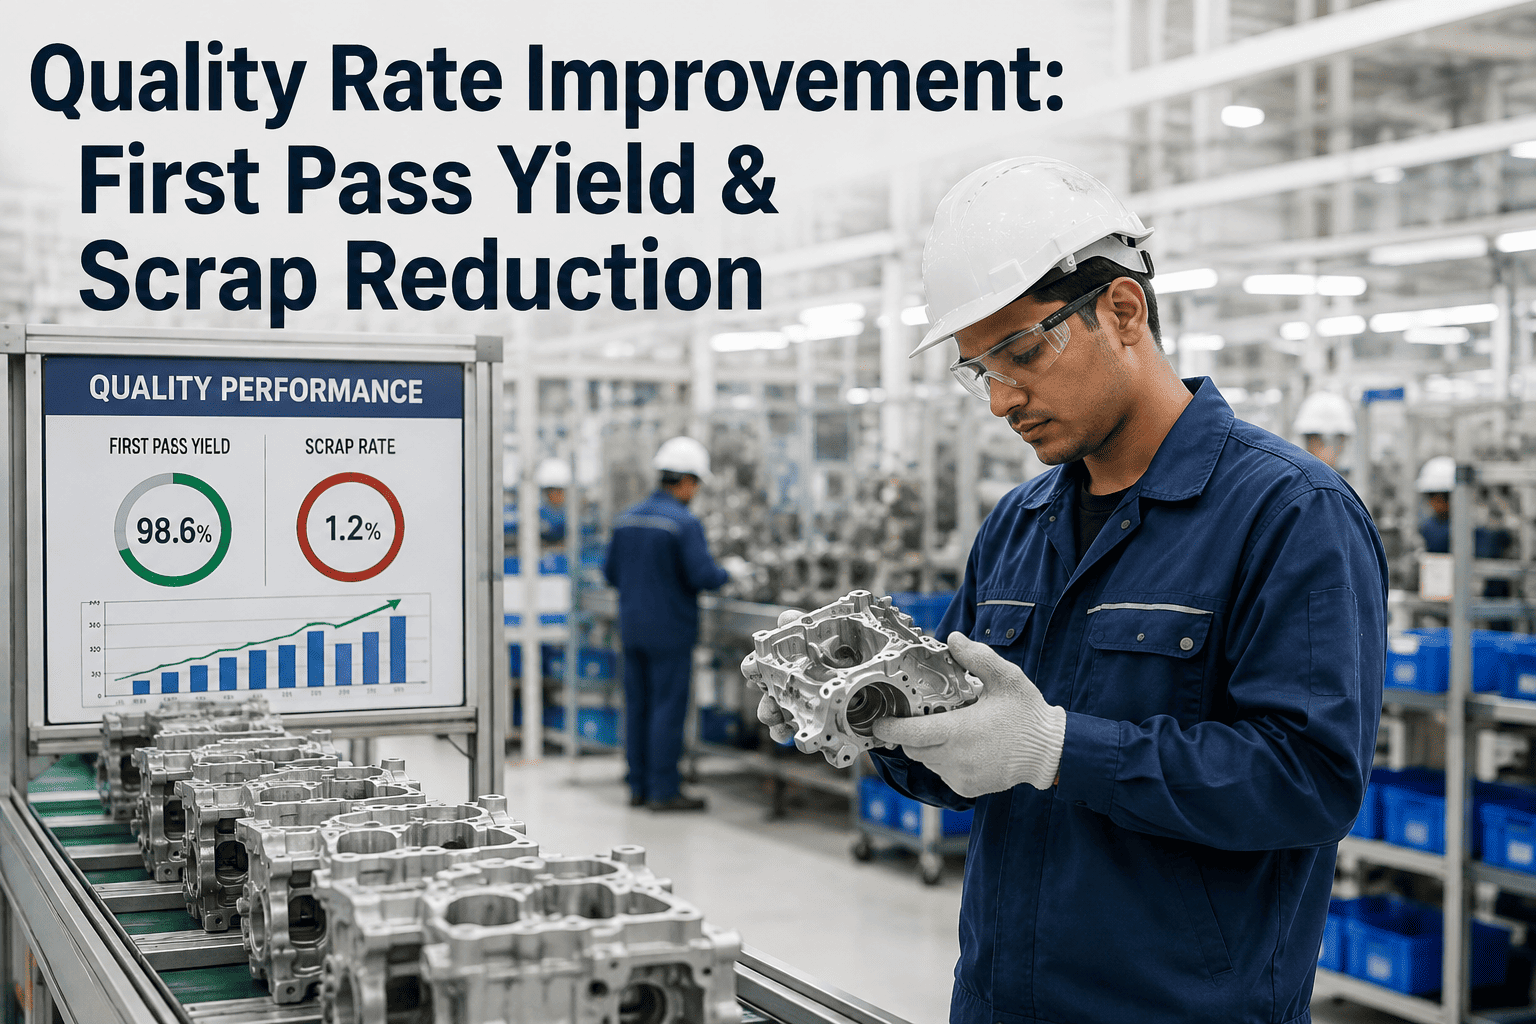
Most quality reports show a number in the high nineties and a plant that feels, on the floor, nowhere near that good. The gap is not a reporting error. It is a definition problem: standard OEE Quality counts a part as good once it eventually passes, even if it took a second pass, a rework loop, and extra labor to get there. iFactory's quality loss tracking separates first-time-right output from output that was rescued, so the number on the dashboard finally matches what the floor already knows.
The Quality Number on Your Dashboard Is Probably Hiding a Second, Worse Number
OEE Quality and First Pass Yield answer two different questions. One counts a part as good once it eventually ships. The other counts a part as good only if nothing went wrong the first time. The distance between them is your hidden factory.
Two Numbers, One Process, Very Different Stories
A part that failed inspection, got reworked, and then passed counts as a good part in the standard OEE Quality calculation — the formula only asks whether the part eventually met specification, not how many attempts that took. First Pass Yield asks the harder question: did the part come out right the first time, with no scrap, no repair, and no rework loop consuming extra labor, cycle time, and material handling. A line can post a 99% OEE Quality score while its true First Pass Yield sits at 85% or lower, with the gap absorbed entirely by a rework operation that never shows up as a separate line item on the scrap report.
That gap matters because rework is expensive in ways that don't show up where people are looking. Scrap is loud — it appears in the material write-off line, the cost-of-goods variance, the morning production report. Rework is quiet. It consumes machine capacity that nobody budgeted against quality, lengthens lead times that get attributed to scheduling rather than defects, and defends a headline yield number that looks considerably healthier than the plant actually runs. Tracking good count, reject count, and rework count as three separate categories — rather than collapsing rework into "eventually good" — is the single change that makes a quality program honest.
See Your True First Pass Yield Next to Your OEE Quality Score
iFactory tracks good count, reject count, and rework count as three distinct categories on every line, so the hidden factory stops hiding.
Where Quality Loss Actually Comes From
The Six Big Losses framework splits quality loss into two categories, and treating them as the same problem is one of the more common mistakes in a quality improvement effort — they have different root causes and respond to different fixes.
The financial stakes behind both categories are larger than most quality reports suggest. Industry benchmarks for the Cost of Poor Quality — the combined total of scrap, rework, warranty claims, and returns — commonly fall between 10% and 30% of annual revenue for a typical manufacturer, with mature Six Sigma operations bringing that figure below 5%. For a facility running $50 million in annual revenue, the difference between a typical COPQ and a world-class one is not a rounding error; it is several million dollars a year moving from waste to margin.
Most of that gap is invisible on a standard financial report, not because the costs don't exist, but because they are scattered across accounts that nobody reviews together. Scrap material shows up in cost of goods sold. Rework labor shows up as ordinary production hours, indistinguishable from time spent making a part correctly the first time. Warranty claims land in a customer service or finance line months after the part that caused them left the plant. A quality team measuring only the scrap bin typically sees a fraction of the total cost their process is actually generating — which is exactly why a facility can be confident its quality costs are under control while an honest, complete accounting tells a very different story.
Rolled Throughput Yield: Why a "Good" Line Can Still Lose Output
Most manufacturing processes run through multiple stations, and a First Pass Yield that looks acceptable at each individual step can still produce a disappointing result across the full route. Rolled Throughput Yield multiplies the FPY of every sequential step together, which reveals how compounding losses behave differently from isolated ones.
Consider a process with five stations, each individually running a 97.5% First Pass Yield — a number that would look comfortably acceptable on any single station's scorecard. Multiplied across all five stations in sequence, Rolled Throughput Yield comes out to roughly 88%, not 97.5%. Each station looks fine in isolation. Together, the full route loses more than one unit in ten before clean, first-time output reaches the customer. This is exactly why a defect caught early is dramatically cheaper than one caught late: a small cutting issue that goes undetected becomes an assembly delay, and a small assembly issue that goes undetected becomes final inspection scrap — the same underlying defect, but with cost added at every station it passed through undetected.
Find Out Which Station Is Actually Driving Your Yield Loss
iFactory tracks FPY station by station, not just line by line, so a compounding loss that hides inside an acceptable-looking average finally becomes visible.
Statistical Process Control: Catching Deviation Before It Becomes Scrap
Statistical process control monitors key process variables continuously and flags a signal the moment a process begins drifting out of its normal operating range — before that drift produces an actual out-of-spec part. This is the mechanism that separates a reactive quality program, which finds defects at final inspection, from a proactive one, which prevents most of them from being produced at all.
SPC earns its return by addressing two distinct scrap sources with two distinct mechanisms. Setup scrap — the parts produced during the first run after a changeover — responds to first-article verification, a documented check of the first parts off a new setup before full production resumes. In-process scrap — defects produced during otherwise-normal steady-state running — responds to real-time monitoring of key process variables, with control limits that trigger an alert the moment a measurement trends toward the edge of tolerance rather than waiting for a part to fail final inspection. Facilities that implement structured SPC on both fronts commonly report scrap reductions in the 40-70% range, because the majority of process-driven defects are preceded by a detectable trend rather than appearing without warning.
Quality Loss Comparison: What Each Metric Actually Tells You
Different quality metrics answer different questions, and a program that tracks only one of them is structurally blind to whatever that metric doesn't capture. The comparison below is meant to be read as a set, not a menu — a mature quality program tracks all five together, because each one exposes a blind spot the others leave uncovered.
| Metric | What It Measures | What It Misses | World-Class Benchmark |
|---|---|---|---|
| OEE Quality Rate | Good units divided by total units started, including reworked parts | Labor and cycle time consumed by rework loops | 99.9% |
| First Pass Yield | Units correct on the first attempt, no scrap or rework | Compounding loss across multiple process steps | 95%+ per station |
| Rolled Throughput Yield | FPY multiplied across every sequential station in the process | Which specific station is driving the compounding loss | 90%+ end-to-end |
| Scrap Rate | Unrecoverable units as a percentage of total production | Rework cost, which does not appear in scrap figures at all | Under 1-2% |
| Cost of Poor Quality | Total financial impact — scrap, rework, warranty, returns | Nothing, if measured completely — the most honest single number | Under 5% of revenue |
Common Mistakes That Keep Quality Rate Flat
Most quality plateaus trace back to a handful of measurement and process gaps that repeat across plants, regardless of industry or product complexity.
Letting rework hide inside the OEE Quality number. If rework is not tracked as its own category, the dashboard reports a headline number that looks healthier than the plant actually runs, and improvement teams end up chasing the wrong problem.
Blending quality data across lines, shifts, and products. A facility-wide quality rate can look moderately concerning while masking that the loss is heavily concentrated in one specific line, one specific shift, or one specific product running through it. Aggregated numbers hide exactly the pattern an improvement team needs to see.
Treating startup scrap as unavoidable. The first parts after any changeover are routinely written off as a fixed cost of switching products, when a documented first-article verification step catches most of that loss before it accumulates across every changeover in a shift.
Investigating each process step in isolation. A comfortable per-station FPY can still produce a disappointing Rolled Throughput Yield once every station's small loss compounds across the full route. Reviewing only individual stations misses this entirely.
Waiting for final inspection to catch defects. A defect caught at final inspection has already consumed every resource spent processing it through every prior station. SPC control limits that flag a drifting variable in real time catch the same defect at a fraction of the accumulated cost.
Quality Rate KPIs to Track
First Pass Yield
Units correct on the first attempt at a given station, with no scrap, repair, or rework. The most actionable quality KPI because it captures the problem at the exact point of production.
Rolled Throughput Yield
FPY multiplied across every sequential process step. Reveals compounding loss that per-station metrics alone will miss.
Cost of Poor Quality
Total financial impact of scrap, rework, warranty claims, and returns as a percentage of revenue. The single most honest quality number, because it captures cost regardless of which account it lands in.
Rework Rate
Share of units failing first inspection but recoverable through additional work. Tracked separately from scrap rate, since the two behave very differently financially and operationally.
Process Capability (Cpk)
Statistical measure of how well a process performs relative to its specification limits. A rising Cpk trend is the clearest sign that SPC interventions are actually tightening process variation, not just catching individual defects.
Startup Scrap per Changeover
Units scrapped during the first run after any changeover, tracked as its own category rather than absorbed into overall scrap rate. Directly measures whether first-article verification is actually catching setup problems.
The plants that struggle most with quality are almost never the ones with a bad process. They're the ones measuring the wrong number. I have walked into facilities proudly reporting 99% OEE Quality while their operators could tell you, from memory, which shift and which line was quietly reworking one part in six. The number on the wall and the reality on the floor had stopped agreeing with each other years earlier, and nobody had noticed because rework was never tracked as its own category. Once you separate first-time-right from eventually-right, the real improvement targets stop hiding.
Where to Start: Prioritizing the First Fix
A plant looking at a low quality rate for the first time rarely benefits from attacking every category at once. The Pareto principle applies here just as it does to reliability and availability improvement: rank quality losses by their financial or unit impact, and concentrate improvement resources on the single largest category until it stabilizes before moving to the next one.
In practice, that ranking usually surfaces one of three starting points. If startup and changeover scrap dominates the loss, the fastest win is typically a documented first-article verification step — a low-cost, low-technology intervention that catches the majority of setup-driven defects before they accumulate across every changeover in a shift. If in-process defects dominate, the higher-leverage move is usually statistical process control on the specific variables most correlated with the defect pattern, since steady-state quality loss is more often a process drift problem than a one-time setup error. If rework volume is large relative to scrap volume, the priority shifts toward station-level root cause investigation, because a high rework rate with low scrap typically means defects are being caught and corrected reliably but the underlying cause producing them in the first place has never actually been fixed.
Whichever category comes first, the underlying discipline is the same one that applies across every improvement effort in this guide: measure the categories separately, rank them honestly, and resist the instinct to spread limited improvement time evenly across every line and every defect type. Concentrated effort on the largest, best-understood loss category consistently outperforms diffuse effort applied everywhere at once. A quality program that revisits this ranking quarterly, rather than setting it once and assuming the picture stays static, catches the moment a newly stabilized category gets overtaken by a different one — which is the natural pattern as improvement work steadily shrinks whichever loss was largest.
Frequently Asked Questions
The standard OEE Quality formula counts a unit as good once it eventually meets specification, which means a part that failed inspection, went through rework, and then passed still counts as a good part for OEE purposes. First Pass Yield asks a stricter question — was the part correct on the first attempt, with no scrap, repair, or rework — which is why the two numbers can diverge significantly on a line with a substantial rework operation. The gap between them is a direct measurement of how much labor and cycle time your process is spending to rescue parts rather than producing them right the first time. Book a demo to see both numbers calculated side by side on your own production data.
Scrap rate measures units that are unrecoverable and must be discarded, while rework rate measures units that failed first inspection but can be brought back to specification through additional work, cycle time, or material. Both describe the same underlying problem — the process did not produce a conforming unit on the first try — but they hit the plant financially in very different ways: scrap shows up clearly in material write-offs, while rework quietly consumes machine capacity and labor that rarely gets attributed to a quality cause. Tracking them as one blended number hides which lever actually needs to be pulled. Book a demo to see scrap and rework tracked as separate, auditable categories.
Facilities implementing structured statistical process control commonly report scrap reductions in the 40-70% range, because the majority of process-driven defects are preceded by a measurable trend in a key process variable rather than appearing without warning. The mechanism is early intervention: control limits flag a variable drifting toward the edge of tolerance while the process is still producing conforming parts, giving operators time to correct the drift before it produces an actual defect. The size of the improvement depends heavily on how many of a plant's defects are genuinely process-driven versus caused by material or equipment issues that SPC alone cannot address. Book a demo to see how iFactory surfaces process drift signals before they become scrap.
Rolled Throughput Yield multiplies the First Pass Yield of every sequential process step together, which reveals how individually acceptable-looking stations can still produce a disappointing result across the full production route. A five-station process where every station runs 97.5% FPY looks comfortable at each individual step, but the compounded Rolled Throughput Yield comes out closer to 88% — over one unit in ten lost before reaching clean, first-time output. Reviewing FPY only at the per-station level misses this compounding effect entirely. Book a demo to see Rolled Throughput Yield calculated automatically across your full process route.
Not necessarily — a sudden or gradual decline in quality rate is frequently a leading indicator of a developing mechanical fault rather than a pure process or training issue. A part that drifts slightly out of spec is often an early symptom of a machine that is heading toward a larger failure, which means quality data reviewed alongside maintenance history can reveal correlations that neither dataset shows on its own. Treating quality loss purely as a quality department metric, disconnected from maintenance and reliability data, misses this connection entirely. Book a demo to see how iFactory correlates quality dips with equipment health history on the same timeline.
Stop Reporting the Number That Hides Your Real Quality Problem
iFactory tracks good count, reject count, and rework count as three separate categories on every line, station, and shift — so your team improves the number that actually reflects the floor, not the one that flatters the dashboard.