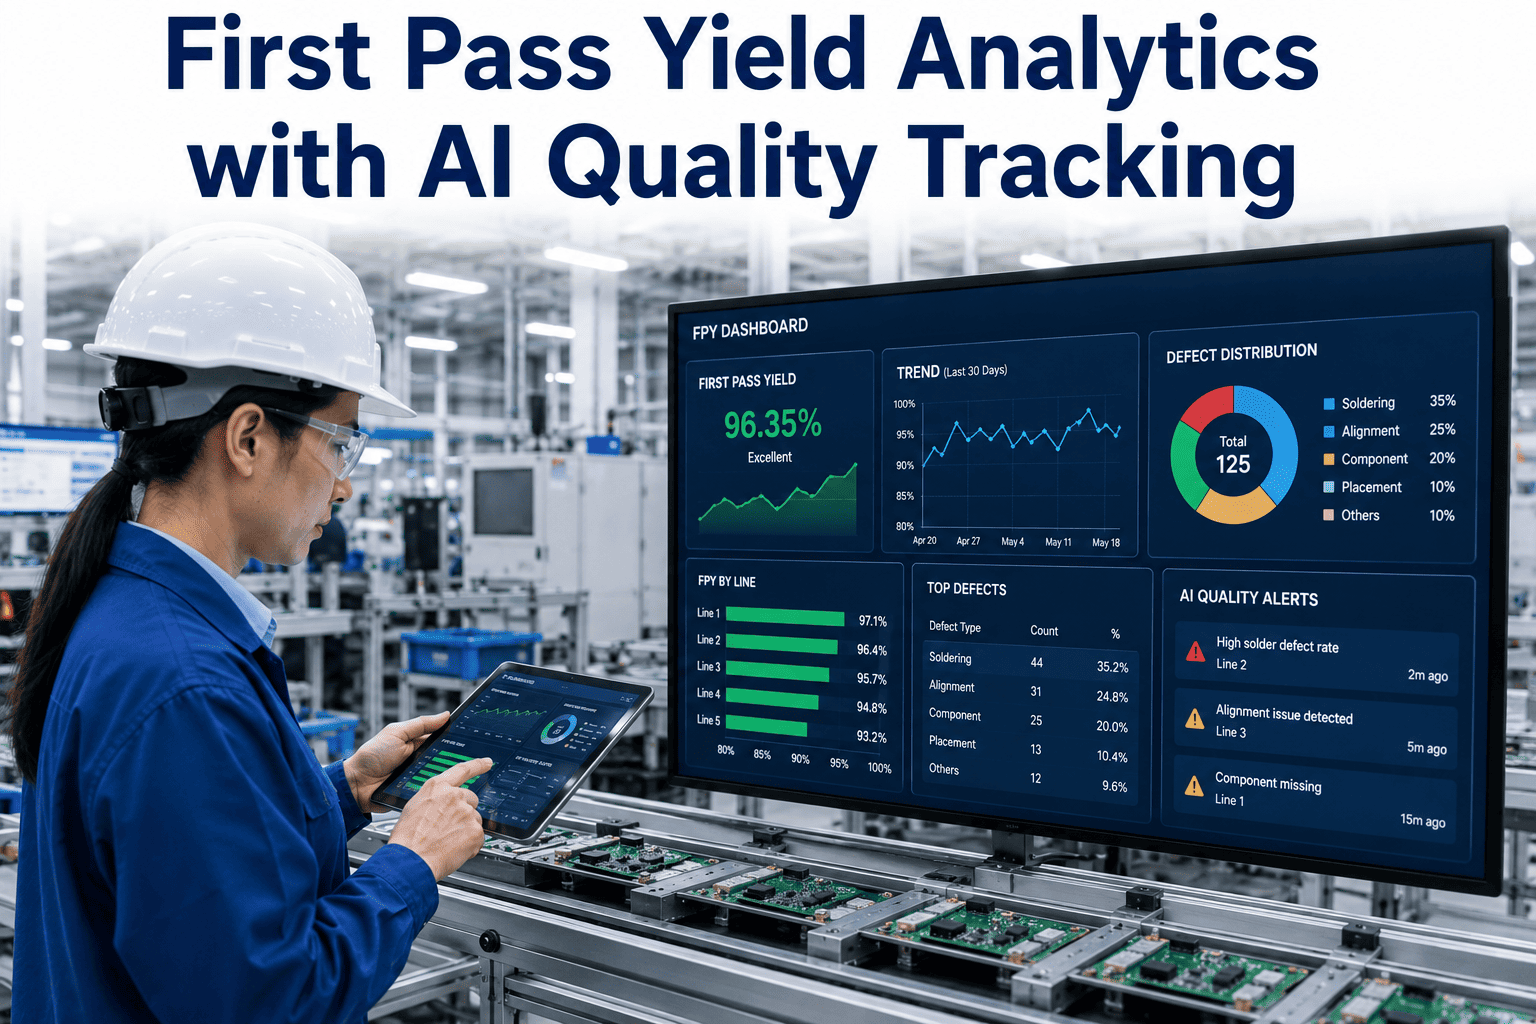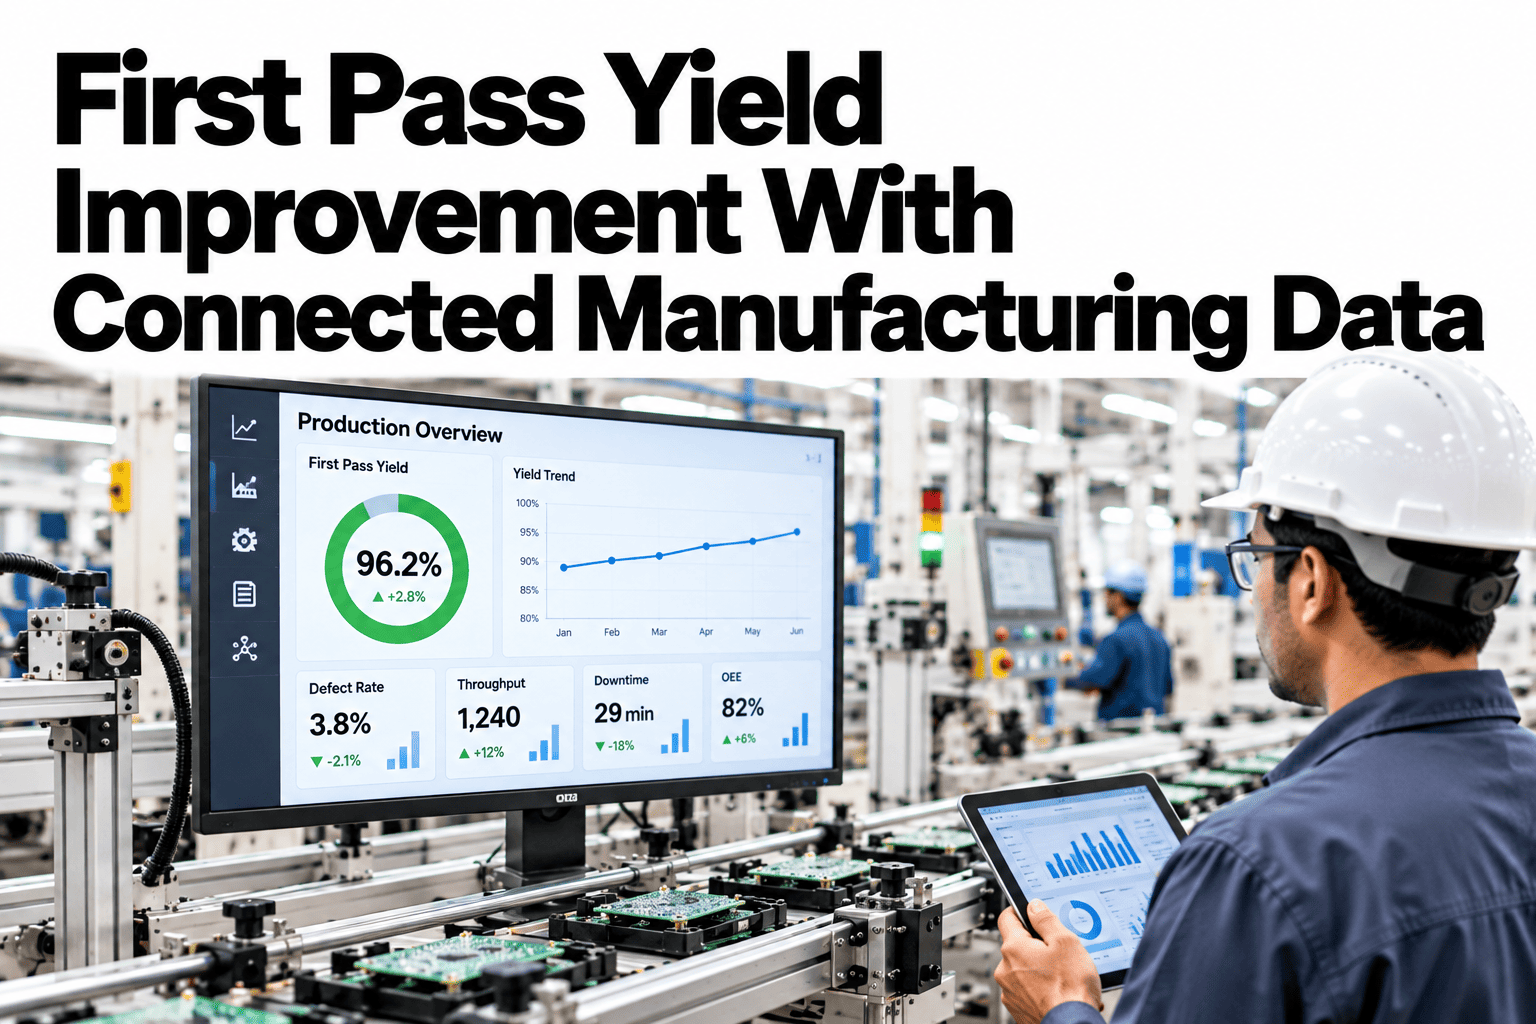
A plant can ship good product and still be losing money, because first pass yield counts only the units that were right the first time. Every piece that is reworked, retested or scrapped has already used material, machine time and labour before it counts. Connecting machine, material and quality data shows where those first-time failures start, instead of leaving them buried in a single yield number. Manufacturers who want that visibility can ask iFactory AI how first pass yield is tracked across their lines.
Raise First Pass Yield by Seeing Where Units Fail the First Time
iFactory AI connects machine, material and inspection data so every first-time failure is traced to its process step, and yield improves where it actually leaks.
What First Pass Yield Actually Measures
First pass yield looks simple, but its definition decides whether it tells the truth. Agree it once and use it everywhere.
The Worked Example: Why Four Good Steps Make a Weak Line
Each step below looks strong on its own. The chart shows how their yields multiply into a much lower rolled throughput yield.
Final Yield Hides What First Pass Yield Shows
Rework brings units back, so final yield forgives the cost of the detour. First pass yield does not.
Where First Pass Yield Usually Leaks
Failures cluster around a few causes. The matrix, shown as an illustration, helps decide where to look first.
| Cause | Machining and Forming | Assembly | Test and Inspection |
|---|---|---|---|
| Machine setup and parameter drift | High | Moderate | Moderate |
| Material lot variation | High | Moderate | Low |
| Operator method differences | Moderate | High | Moderate |
| Tooling and fixture wear | High | High | Low |
| Measurement and test error | Low | Moderate | High |
Find Out Where Your Line Loses Units on the First Pass
Book a 30-minute session and iFactory AI will review your yield definitions and line data to show which step leaks the most first-time quality.
Why Connected Data Changes the Answer
A yield number needs context to be useful. Connecting four data sources turns a percentage into a diagnosis.
The Data You Need for Yield Analysis
You do not need perfect data on day one. These items give most of the value.
| Data Item | Question It Answers | Typical Source |
|---|---|---|
| Unit or lot identifier | Which units belong together | Barcode, MES or traveller record |
| Pass or fail at each step | Where units fail first | Inspection and test stations |
| Defect type and position | What kind of failure it was | Inspection record |
| Machine and shift at the time | Which machine and crew were involved | Machine log and shift register |
| Material lot and supplier | Whether the input mattered | Receiving and stores records |
A Fix Order That Avoids Wasted Effort
When yield is low, teams often change many things at once. A fixed order isolates the real cause.
Confirm the measurement
Check that pass and fail decisions are trustworthy first.
Find the weakest step
Rank steps by first pass yield, not by volume.
Split by machine, shift and lot
See which dimension the failures cluster on.
Test one change at a time
Change a single factor and measure the result.
Lock the fix into the standard
Record the change so the gain does not fade.
A Composite Scenario: The Step Nobody Blamed
This is a composite example, not a named plant. It shows how a connected view redirects an improvement effort.
What Improving First Pass Yield Is Worth
Every first-time pass avoids a stack of hidden costs. The chart shows an illustrative view of where the savings land.
What iFactory AI Adds to Yield Improvement
iFactory AI is smart manufacturing and industrial software that connects machine, quality and material data. Explore yield analytics in a live product tour on realistic line data.
Step-Level Yield Tracking
First pass yield and rolled throughput yield are calculated per step and per route.
Cause Clustering
Failures are grouped by machine, shift, lot and operator so patterns appear.
Early Drift Alerts
Steps trending toward a yield drop are flagged before the loss builds.
Closed-Loop Tracking
Each fix is tracked until first pass yield recovers.
Getting Started in Four Steps
A narrow start finishes faster and proves the value sooner.
Agree one definition of first pass yield for the pilot line.
Link pass and fail data to machine, shift and lot.
Find the weakest step and the biggest cluster.
Change one factor and confirm the yield moves.
Review of First Pass Yield Improvement
A practical review of what makes yield work succeed, written as editorial guidance rather than a named expert quote.
Define it once
Two plants measuring first pass yield differently cannot learn from each other.
Look at steps, not totals
A single plant yield hides the step that is actually leaking.
Link the data
Failures only make sense beside the machine, shift and lot that produced them.
Frequently Asked Questions
What is the difference between first pass yield and final yield?
First pass yield counts only units that were right the first time, while final yield also counts units rescued by rework. See both measures on a live dashboard in a short demo. The gap between them shows the cost of the hidden factory.
How do I calculate rolled throughput yield?
Multiply the first pass yield of every step in the route. Four steps at 98%, 97%, 95% and 99% give about 89% overall. This shows why a line of good steps can still be weak.
Do we need new sensors to track first pass yield?
Usually not at the start. Many plants already record pass and fail results, and linking them to units and lots is the first gain. Ask support what your existing records can already show before buying hardware.
Which step should we fix first?
The step with the lowest first pass yield that also affects the most units. Ranking by yield, not by volume alone, avoids busy but low-impact work. Fix one step, verify, then move on.
How quickly can we see results?
Many plants see a useful yield ranking within weeks of linking data on one line. Book a call to scope your first yield pilot and choose the line. A single clear win makes wider rollout straightforward.
Make Every First Pass Count
iFactory AI connects machine, material and quality data so yield improves where it actually leaks. Book a walkthrough to see it on your own lines.