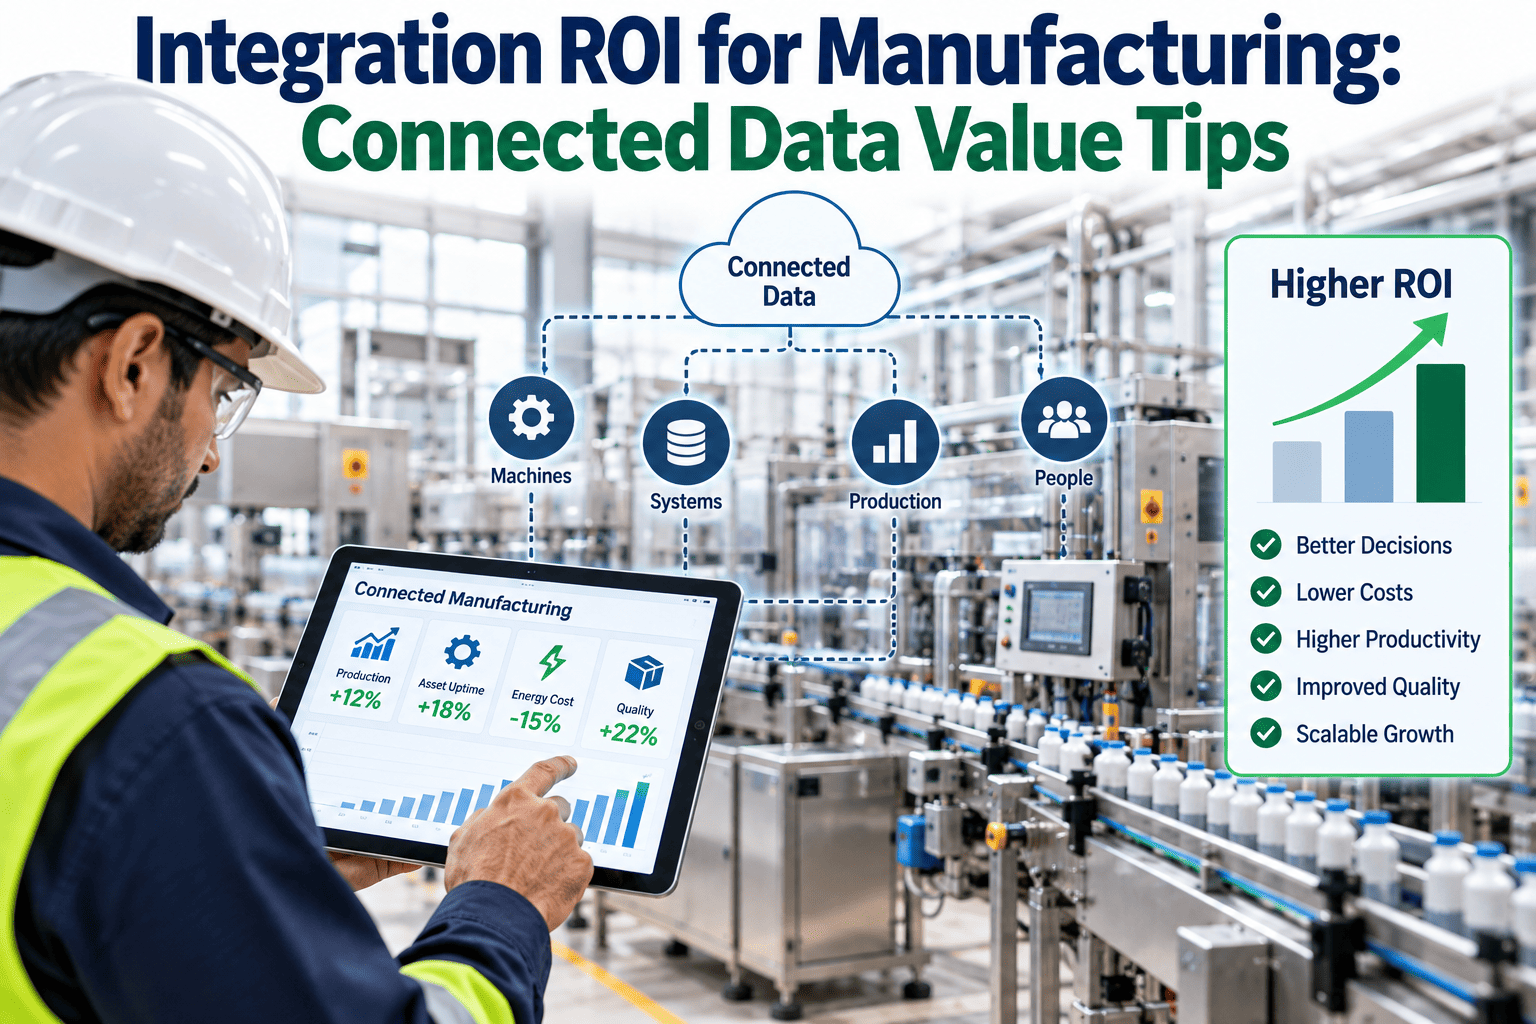
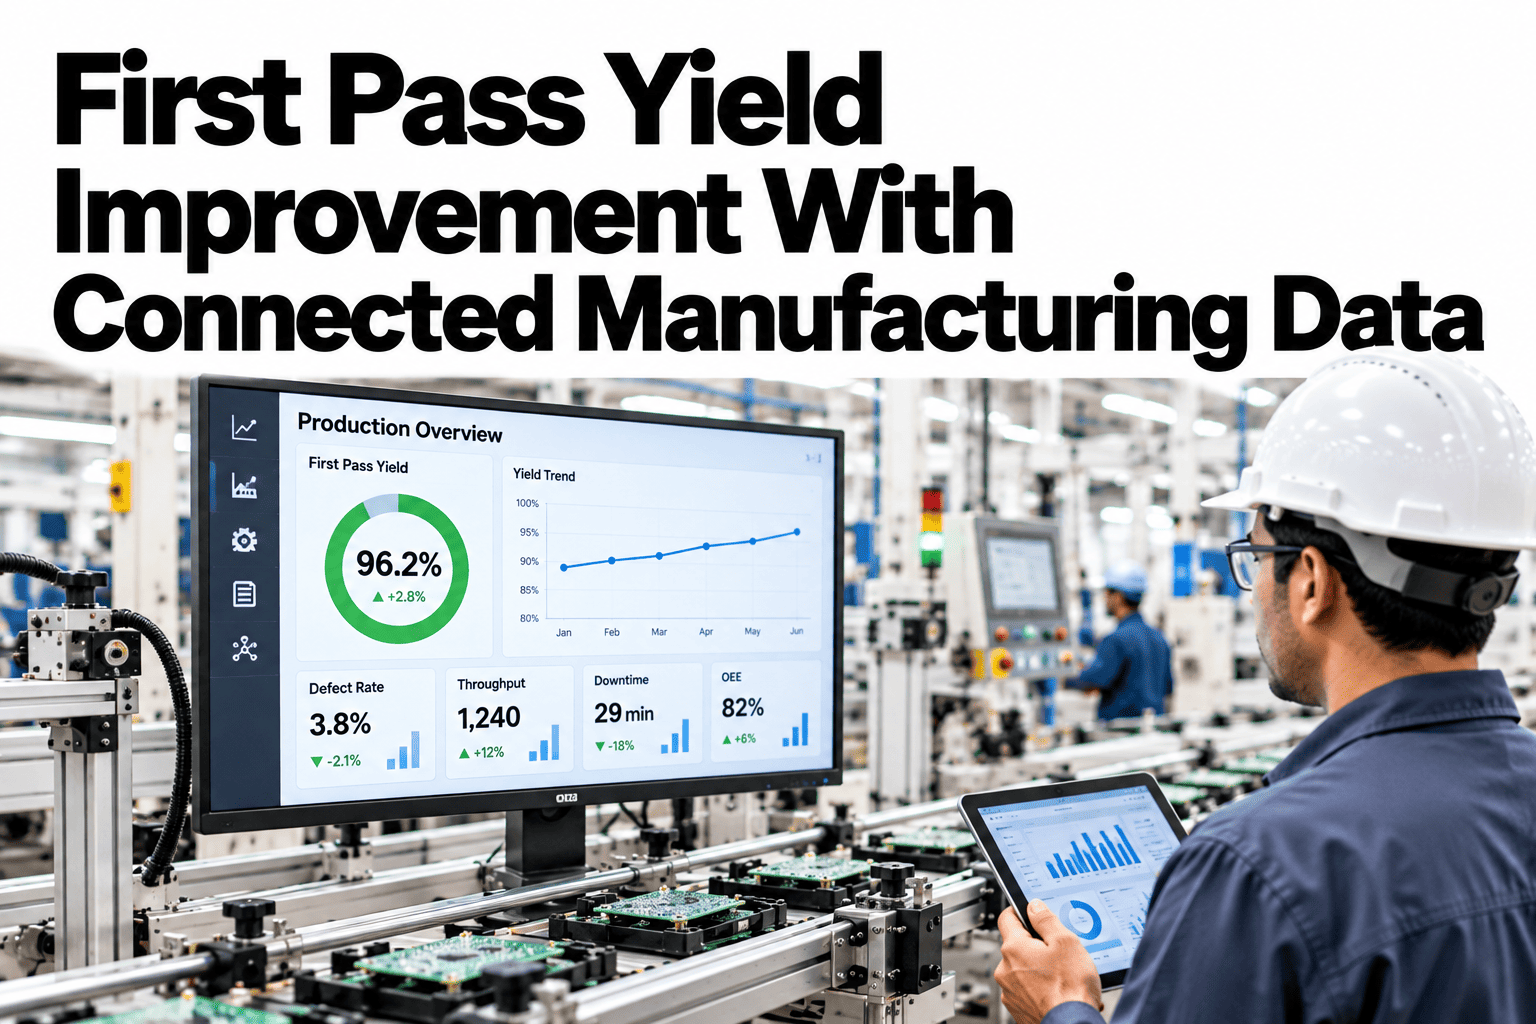
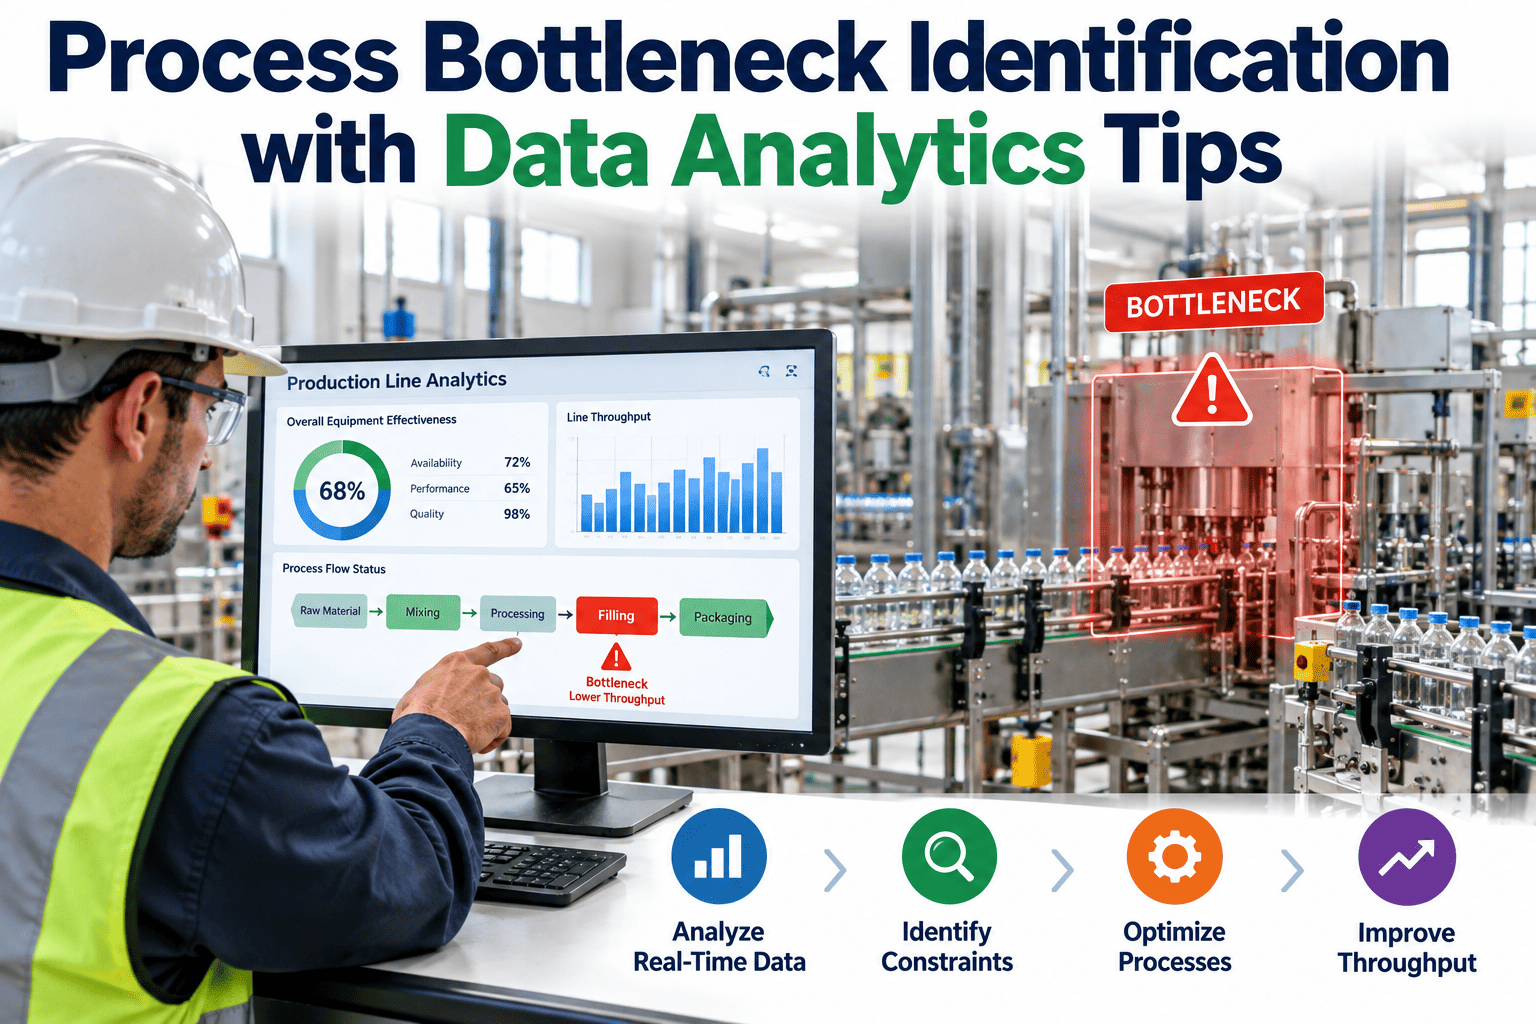
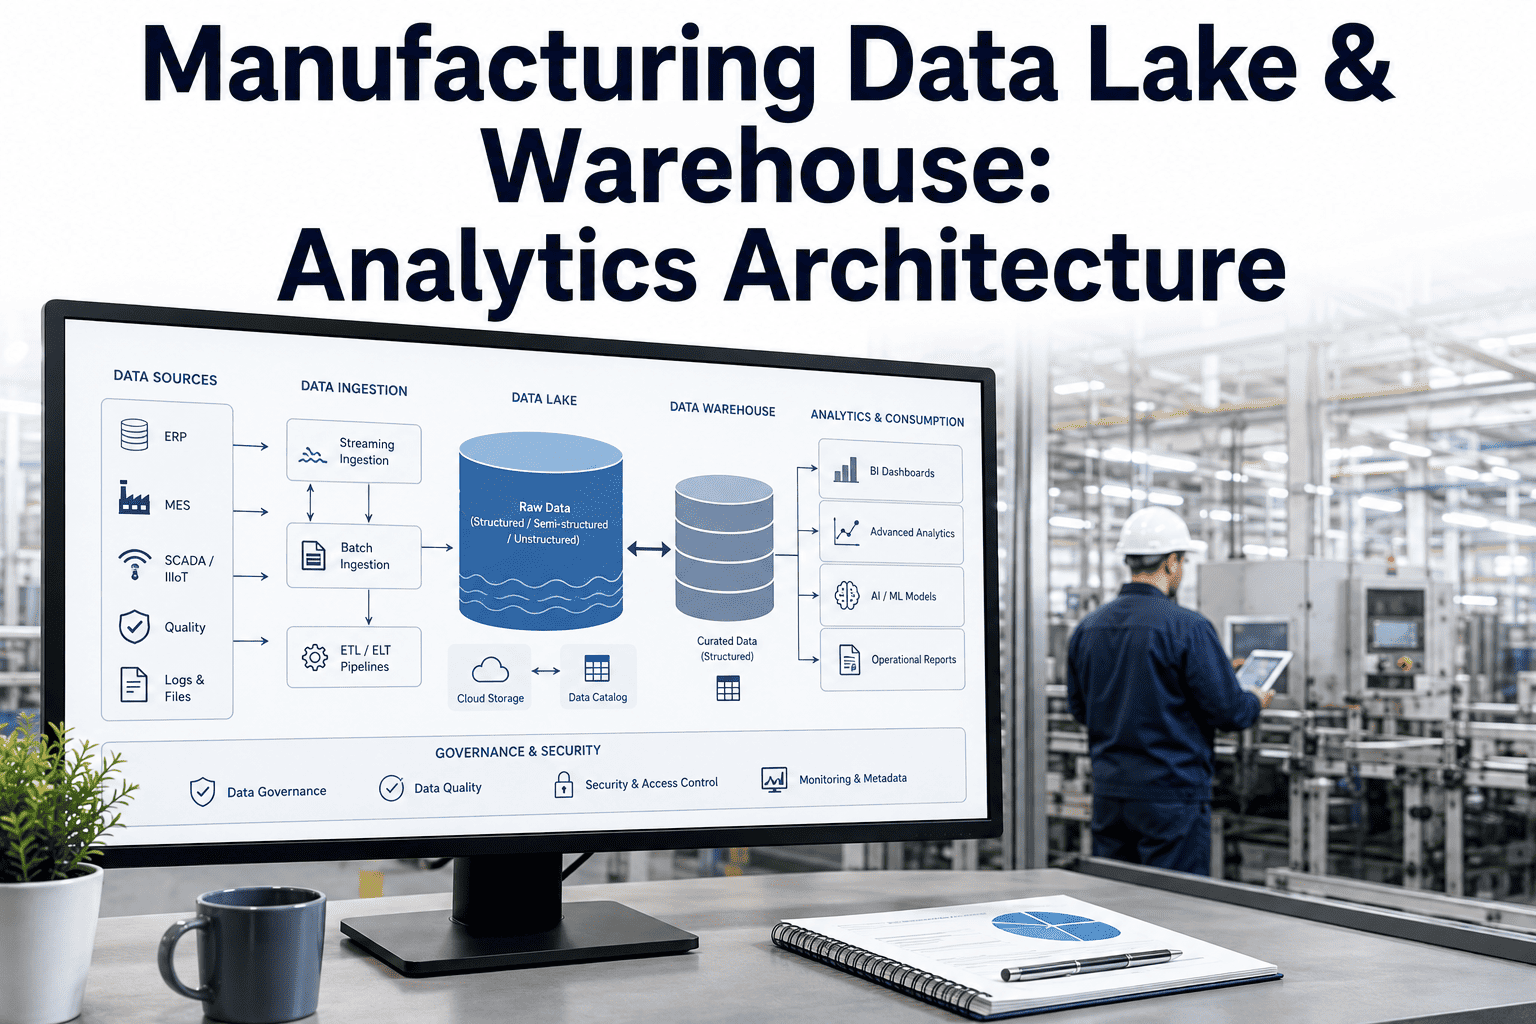
The hardest part of justifying a systems integration project is rarely proving that disconnected data is a problem — everyone on the floor already knows it is. The hard part is turning that everyday frustration into a number a CFO will approve. Data integration projects in manufacturing return an average of 317% ROI over three years, and manufacturers relying on manual reconciliation between systems lose an estimated $847,000 annually in labor, rework, and delayed decisions, yet most integration business cases still get written as a vague appeal to "better visibility" instead of a structured calculation. The four categories below — decision speed, error reduction, analytics enablement, and capacity recovery — are where connected data actually pays for itself, and building your case around them is what gets a project approved instead of shelved. If you want help building the ROI case for your own plant's integration project, book a demo with iFactory's team.
SYSTEMS INTEGRATION · ROI FRAMEWORK · MANUFACTURING
Connected Data Pays for Itself in Four Places — Most ROI Cases Only Measure One
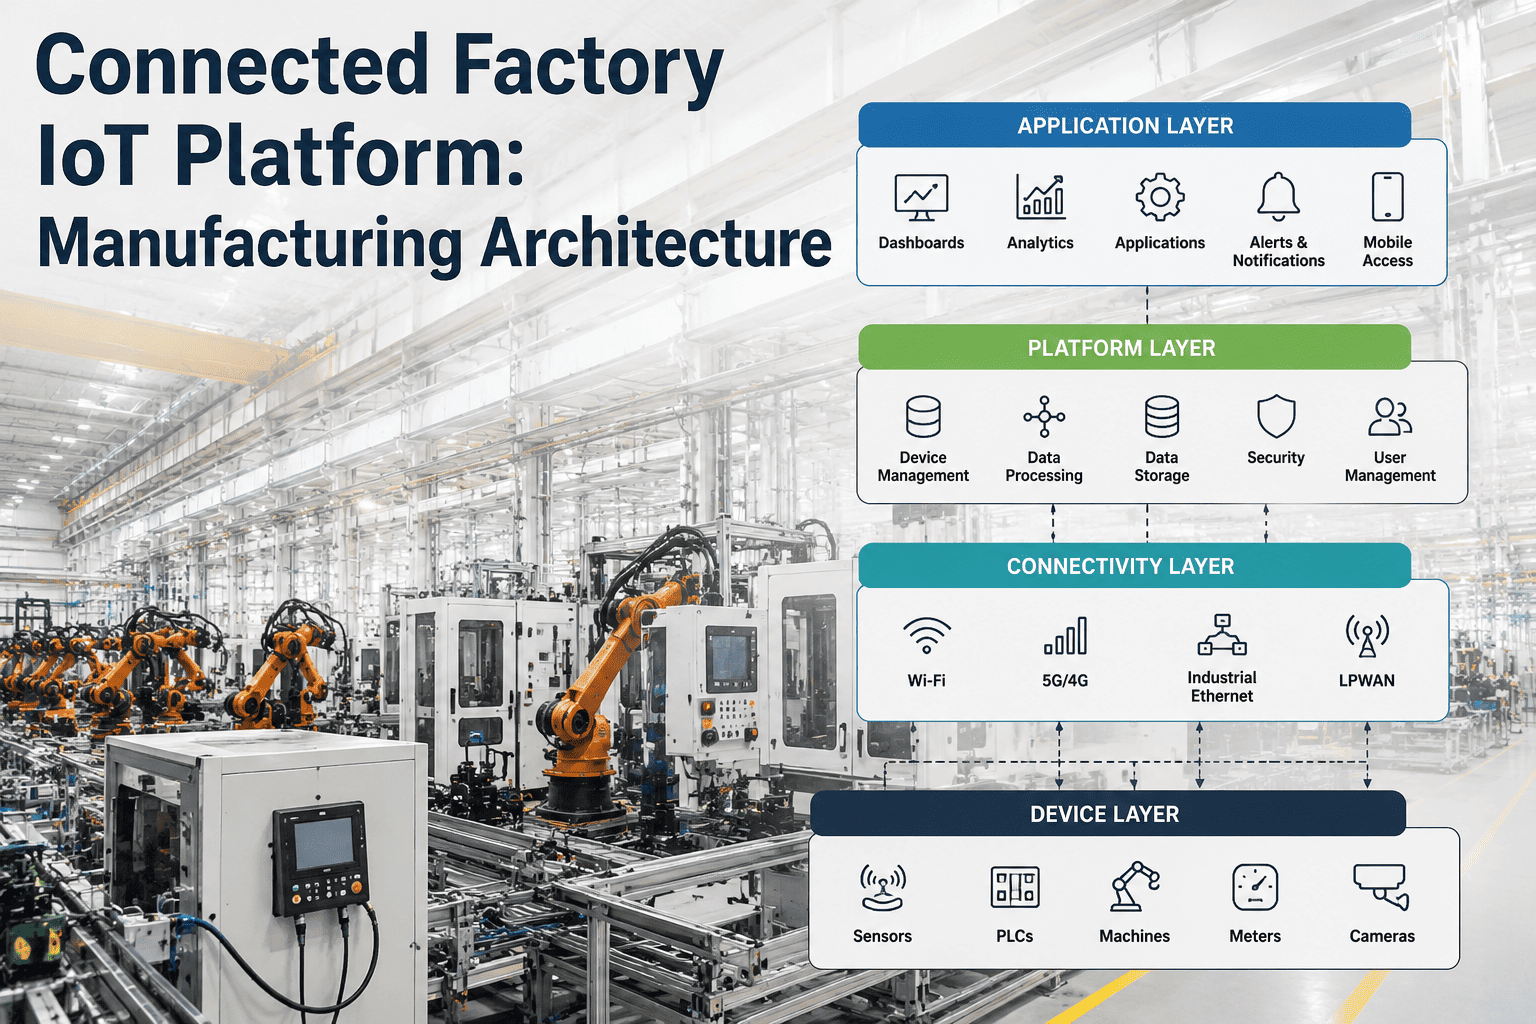
iFactory connects ERP, MES, quality, and maintenance data into a single operational picture, so the value of integration shows up as faster decisions, fewer errors, and analytics your team actually trusts.
317%
Average 3-year ROI from manufacturing data integration projects
$847K
Average annual cost of manual data reconciliation across disconnected systems
28%
Share of manufacturing applications that are actually connected to each other
36%
Manufacturing decision-makers citing lack of available data as their top frustration
THE FOUR VALUE CATEGORIES
Where Integration ROI Actually Comes From
Most integration pitches lead with "real-time visibility," which sounds valuable but is nearly impossible to put a dollar figure on. The four categories below are where connected data converts into measurable financial return, and each one is calculated differently. Decision speed and error reduction are the fastest to quantify because they map directly to time and rework you are already tracking. Analytics enablement and capacity recovery take longer to show up but compound over the life of the system, which is why a three-year ROI horizon consistently outperforms a one-year view in every integration study available.
01
Decision Speed
The time between an operational event and an effective response — a margin variance, a quality drift, a shortage — is decision latency, and it is the single largest hidden cost disconnected systems create. When production, quality, and finance each read a different system, reconciling "what actually happened" before anyone can act consumes hours that should be spent responding.
Calculate it as: hours spent reconciling conflicting reports per week × fully loaded hourly cost of the staff involved × 52
02
Error Reduction
Every manual handoff between systems — retyping a work order number, re-entering inventory counts, copying a quality result into a spreadsheet — is a place where a transcription error can enter the record undetected. Multi-plant manufacturers running separate MES platforms into a single ERP have documented inventory discrepancies over 20% before integration, dropping to near-perfect accuracy afterward.
Calculate it as: annual cost of scrap, rework, and expedited shipping traced to data-entry or reconciliation errors
03
Analytics Enablement
Predictive maintenance and demand forecasting both depend on data that spans multiple systems, and a large share of manufacturers already use integrated data specifically for these two use cases. A predictive model built on maintenance logs alone misses the production context that explains why a failure happened; connected data is what makes the prediction trustworthy enough to act on.
Calculate it as: avoided unplanned downtime hours × cost per hour of downtime, once cross-system models are live
04
Capacity Recovery
Staff hours currently spent building manual reports, chasing data across systems, and re-keying information are hours not spent on higher-value work. Forrester's Total Economic Impact research on manufacturing integration found gains equivalent to roughly a quarter of additional operational capacity once repetitive reconciliation work was automated away.
Calculate it as: hours per week per employee spent on manual reporting × loaded hourly cost × headcount affected
Build Your Own ROI Case Instead of Estimating One
iFactory maps your actual system landscape and shows where decision speed, error reduction, and capacity recovery apply to your plant specifically, before you commit to a platform.
WHAT DISCONNECTED DATA ACTUALLY COSTS
The Silo Costs You Are Already Paying, Just Not Where You're Looking
Disconnected systems rarely produce one obvious failure. Instead they produce a steady accumulation of small, distributed costs across departments, each of which looks minor in isolation and each of which gets absorbed into "the way things are" rather than traced back to its source. Naming these costs individually is what makes an integration business case concrete instead of aspirational.
Conflicting Numbers, Same Event
Production logs one downtime figure, maintenance logs another, and finance eventually reports a third. Nobody is lying — each system is technically accurate for what it measures, but reconciling which number is right consumes meeting time every week.
Decisions Made on Stale Data
A shortage a planner already knew about reaches the buyer two weeks late. A supplier commits to a date based on inventory information that changed since the last manual sync. The data was correct when it was pulled — it just was not pulled often enough.
Emergency Procurement Premiums
When a parts shortage surfaces reactively instead of predictively, the purchase happens under time pressure at a markup instead of through planned sourcing, and that premium repeats every time the same disconnected-data gap causes the same late discovery.
Tribal Knowledge as a Workaround
When the systems do not connect, one experienced employee becomes the connective tissue — the person who knows which report to trust and how to cross-reference it manually. That knowledge does not scale, does not transfer easily, and disappears when they leave.
TIMELINE TO VALUE
What Shows Up First, and What Takes Longer
Integration ROI does not arrive all at once. Some categories of value are visible within weeks of connecting two systems; others take months to compound because they depend on enough data accumulating for a model or a trend to become reliable. Setting the right expectation up front is part of what makes an ROI case credible to finance.
1
Weeks 1–4: Single High-Value Connection
One integration — typically quality data linked to process parameters, or maintenance logs linked to production schedules — goes live and immediately eliminates one specific manual reconciliation task.
2
Months 2–3: Decision Speed Gains Appear
Reports that previously required cross-referencing multiple systems now pull from one source. Meeting time spent reconciling conflicting numbers drops measurably.
3
Months 3–6: Error Rates Begin Falling
Manual re-entry points are removed one at a time. Inventory accuracy, lot traceability speed, and order-to-production lag all improve as fewer handoffs create fewer opportunities for transcription error.
4
Months 6–12: Analytics Models Become Trustworthy
Predictive maintenance and demand forecasting models, now fed by connected cross-system data instead of a single source, produce recommendations accurate enough for teams to act on without double-checking manually.
5
Year 2–3: Capacity Recovery Compounds
Staff hours freed from manual reporting redirect toward higher-value work. This is where the largest share of the three-year ROI figure typically accumulates, since capacity gains compound every quarter rather than resetting.
BUILD VS. UNDERSTATE
Conservative vs. Realistic ROI Assumptions
FREQUENTLY ASKED QUESTIONS
Questions Manufacturing Leaders Ask About Integration ROI
How long does it typically take to see a positive return on an integration project?
Most manufacturers see their first measurable gains — reduced time spent reconciling reports on one specific process — within four to eight weeks of the first system connection going live. Full three-year ROI figures, which include compounding capacity recovery and mature analytics gains, are the number typically used for the initial business case, but early wins on decision speed are what build internal confidence to continue the rollout.
Book a demo to see a realistic timeline for your specific system landscape.
Do we need to replace our ERP or MES to get integration value, or can we connect what we already have?
The highest-ROI integration projects typically connect existing systems rather than replacing them. Multi-plant manufacturers running different MES platforms into a single ERP have documented strong returns without ripping out any individual system, since the value comes from the data flowing between platforms rather than from any one platform itself.
Contact support to discuss your current system landscape.
Which of the four value categories should we prioritize first if we can only start with one integration?
Decision speed and error reduction are almost always the fastest to show measurable value, because they map directly to time and rework you can already quantify from existing records. Analytics enablement and capacity recovery are real but take longer to compound, so starting with a single high-value connection tied to a known reconciliation pain point — quality data linked to process parameters is common — tends to build the fastest internal case for expanding further.
How do we calculate the cost of decision delay if we don't already track it as a line item?
Decision delay rarely appears as its own budget line, but it is measurable indirectly: track hours spent in meetings reconciling conflicting numbers from different systems over a representative month, multiply by the fully loaded cost of the staff involved, and annualize the figure. This proxy is what most manufacturing ROI studies use as a starting estimate before more precise tracking is in place.
Book a demo to work through this calculation for your own operation.
Does integration ROI hold up for smaller or single-site manufacturers, or is it mainly a multi-plant benefit?
Single-site manufacturers see the same four value categories, though the scale differs — a single plant will not see the cross-site reconciliation savings that a multi-facility operation does, but decision speed and error reduction gains from connecting quality, production, and maintenance data apply regardless of site count. Smaller manufacturers pursuing integration are often replacing spreadsheets and disconnected point tools rather than reconciling multiple ERP instances, which is a different but equally quantifiable starting point.
Contact support to discuss what applies at your scale.
WHY MOST BUSINESS CASES STALL
The Two Mistakes That Sink an Integration ROI Case Before It Reaches Finance
The most common cause of integration project failure is not technical — it is that the business case starts with the technology instead of the operational decision it is meant to improve. A pitch built around "connecting our systems" invites the question "connect them to do what, exactly," and if the answer is vague, the project stalls in review regardless of how sound the underlying architecture is. The second most common failure is skipping governance: even a well-connected system produces dashboards nobody trusts if there is no agreed definition of which numbers are authoritative once systems start talking to each other.
Leading With Technology Instead of the Decision
A case that opens with platform features rather than a specific operational decision it will speed up reads as an IT initiative, not a business one, and gets scrutinized on cost rather than evaluated on return.
No Agreed Definition of "Correct"
If production and finance have never agreed on which downtime figure is authoritative, connecting their systems does not resolve the disagreement automatically — it just makes the disagreement visible faster, and it needs governance to actually settle it.
Stop Estimating Integration ROI in the Abstract
iFactory connects your ERP, MES, quality, and maintenance data and shows the actual decision-speed, error-reduction, and capacity numbers your plant would recover. Book a demo to see it mapped to your own systems.