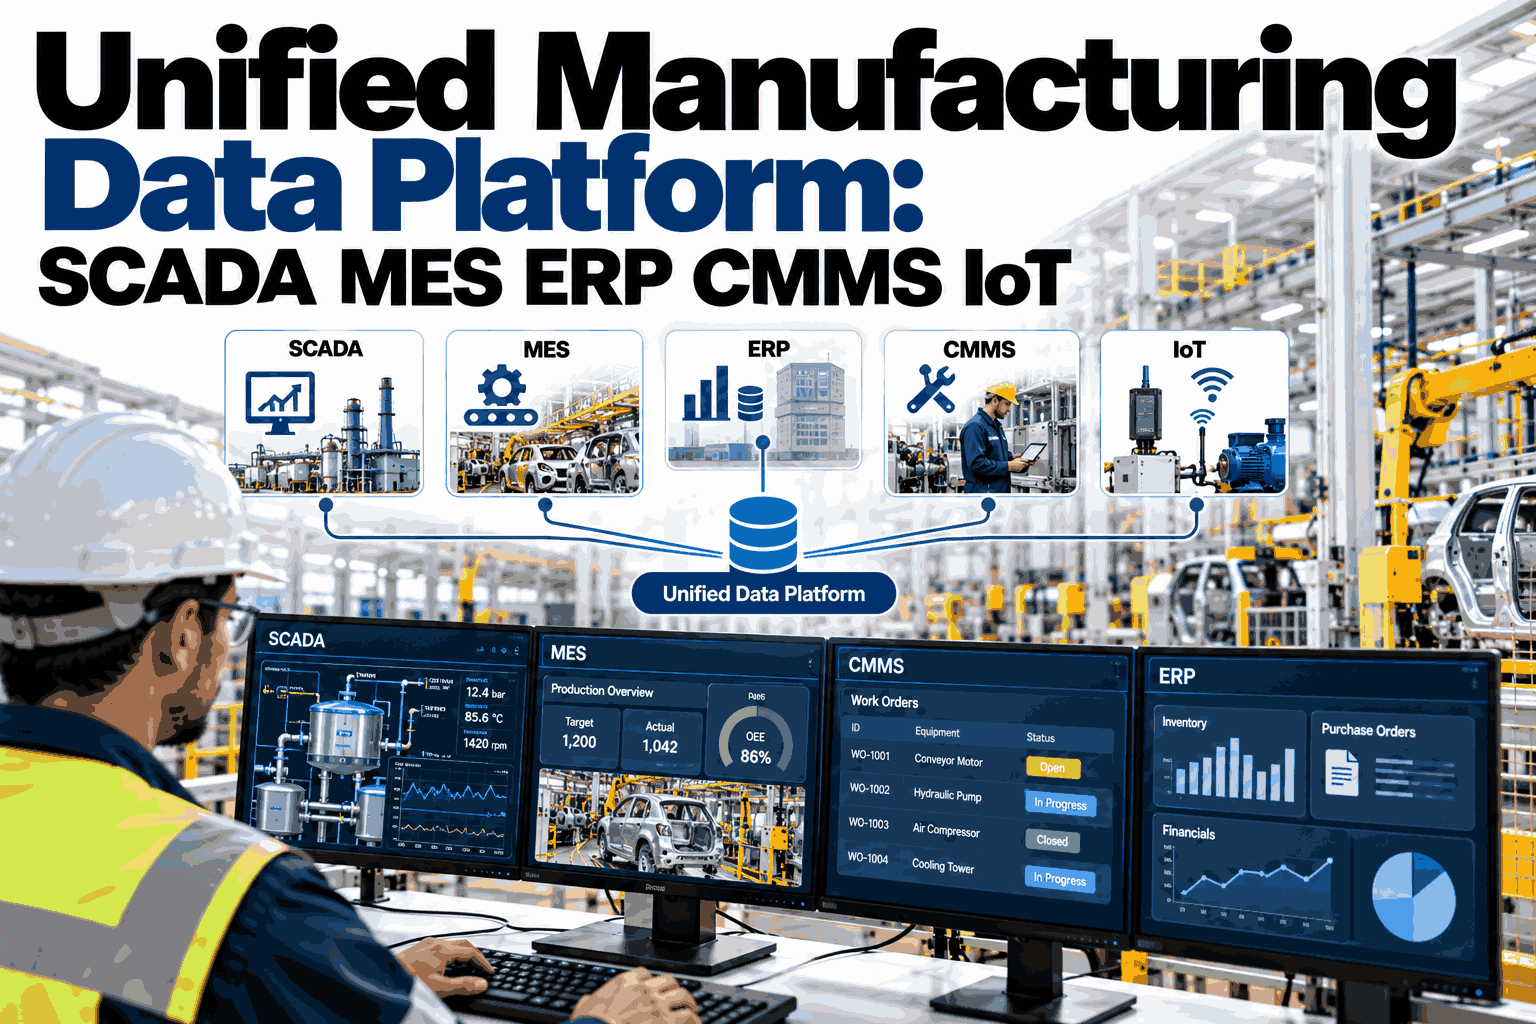
Ask most plants how much of their data actually gets used and the honest answer is a small fraction, historian tags nobody queries after a shift ends, quality records filed and forgotten, MES logs sitting untouched until an audit forces someone to dig through them. The data is being collected, it is just not sitting anywhere an analyst, engineer, or AI model can actually reach it without a manual export and a lot of cleanup. A manufacturing data lake and warehouse architecture solves that by pulling historian, production, and quality data into one analytics-ready structure instead of leaving it scattered across a dozen source systems. iFactory designs and builds that architecture, and you can book a demo to see what it would look like built around your own plant's data sources.
Turn Scattered Plant Data Into One Analytics-Ready Foundation
iFactory unifies historian, production, and quality data into a single lake and warehouse architecture, structured for the analytics and AI models your current systems were never built to support.
Collected Everywhere, Usable Almost Nowhere
Manufacturing generates enormous amounts of data by default, historians alone can produce millions of readings a day, but most of it sits in a format built for one narrow purpose, control-loop trending, a quality checklist, an ERP transaction log, none of it designed to be joined with the others. Building a report that spans production and quality data usually means someone manually exporting from two or three systems and reconciling timestamps by hand.
The people best positioned to spot a meaningful pattern, a process engineer who suspects a subtle correlation between a control parameter and a downstream quality metric, are usually the least equipped to test that hunch quickly, since doing so means learning to query several unfamiliar systems or waiting on an analytics team with a backlog of other requests. Every unified query that used to take a week of manual export and reconciliation work represents a hypothesis that either never got tested, or got tested so late that the operational window to act on it had already passed.
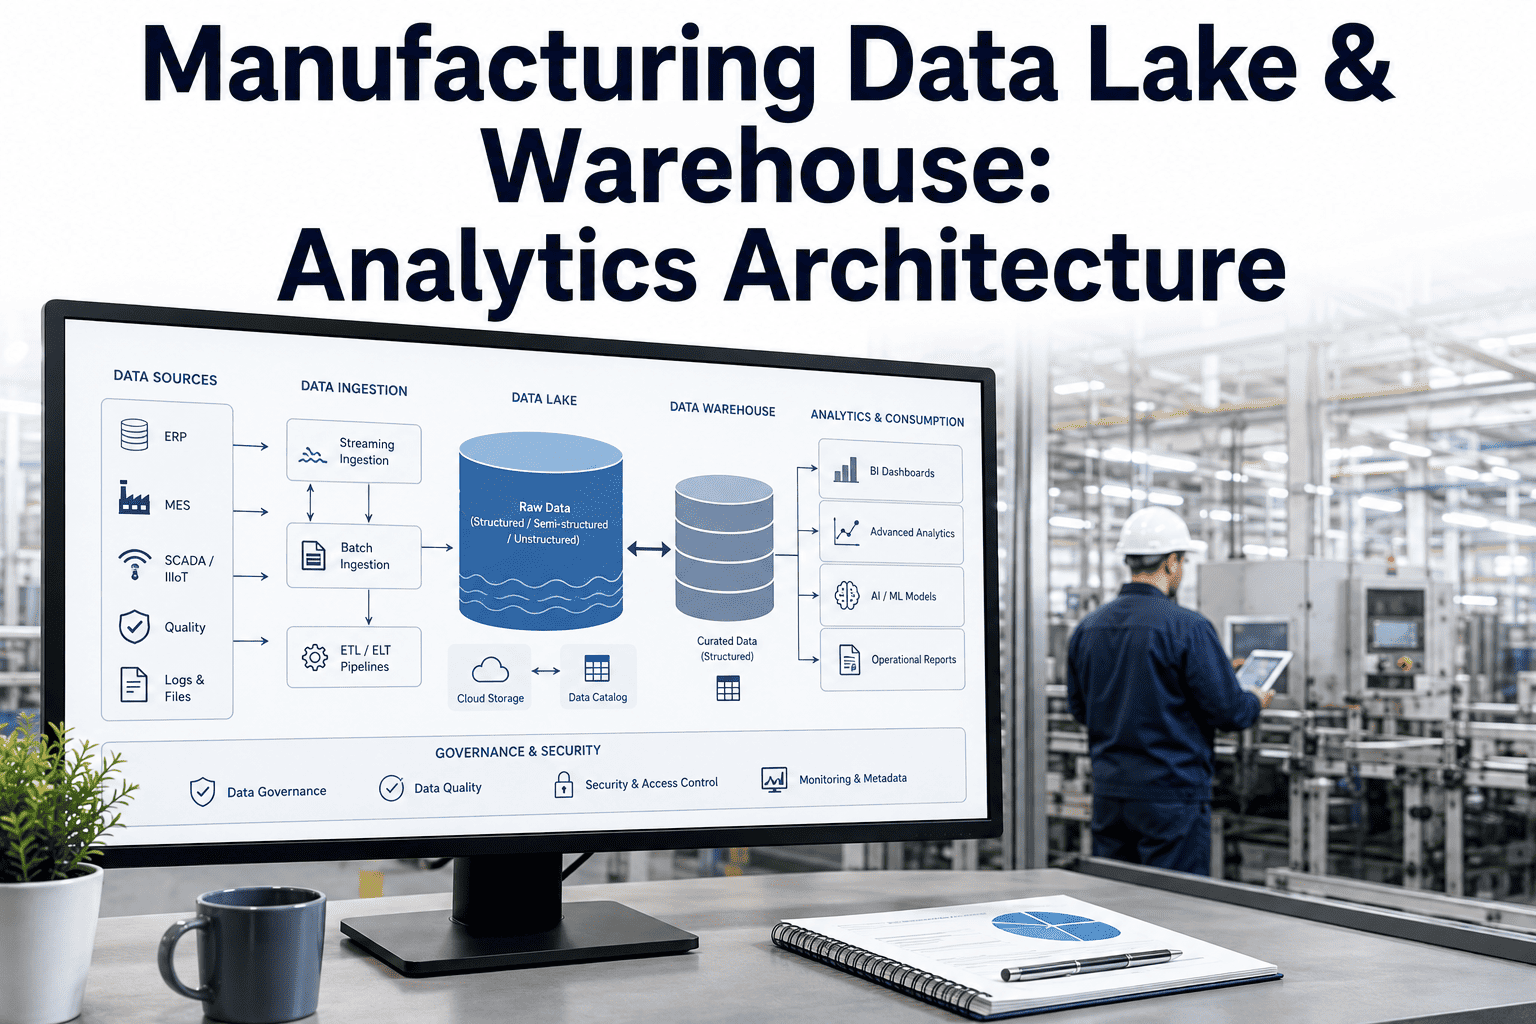
This is not a data volume problem, it is a structure problem. The data lake layer ingests raw data from every source in its native format, while the warehouse layer organizes cleaned, modeled data for fast, reliable querying, giving analysts and engineers one place to look instead of a dozen.
Getting this structure right also matters for a reason many plants only discover once they start their first serious AI or machine learning initiative, model training generally needs large volumes of historical data in a consistent, queryable format, and a scattered data landscape simply cannot supply that without a lengthy, often manual, data preparation phase for every single project. Building the lake and warehouse layer once, as shared infrastructure, means every future analytics or AI initiative starts from a much shorter runway instead of repeating the same data-gathering exercise from scratch.
See Where Your Own Data Is Currently Sitting
iFactory maps your existing historian, MES, ERP, and quality systems before designing the lake and warehouse structure around them. Book a demo to walk through your current data landscape.
Every Source System Has a Defined Path Into the Structure
A manufacturing data lake is only as useful as the sources feeding it, and each source typically carries a different shape, frequency, and reliability of data that the ingestion layer needs to handle appropriately.
Raw Flexibility and Structured Speed Serve Different Purposes
A data lake and a data warehouse are not competing choices, they are two layers of the same architecture, each optimized for a different kind of work.
| Characteristic | Data Lake | Data Warehouse |
|---|---|---|
| Data Format | Raw, native format from source systems | Cleaned, modeled, and structured |
| Primary Users | Data scientists building AI and ML models | Analysts and business users building reports |
| Query Speed | Slower, optimized for flexibility over speed | Fast, optimized for repeated structured queries |
| Schema Approach | Schema-on-read, flexible for unknown future uses | Schema-on-write, defined for known reporting needs |
How to Tell Your Plant Has Outgrown Manual Reporting
Most plants do not decide to build a data lake and warehouse on a whim, they reach a point where manual reporting has become the actual bottleneck to getting an answer.
A Unified Structure Is Only Valuable if People Trust What Is in It
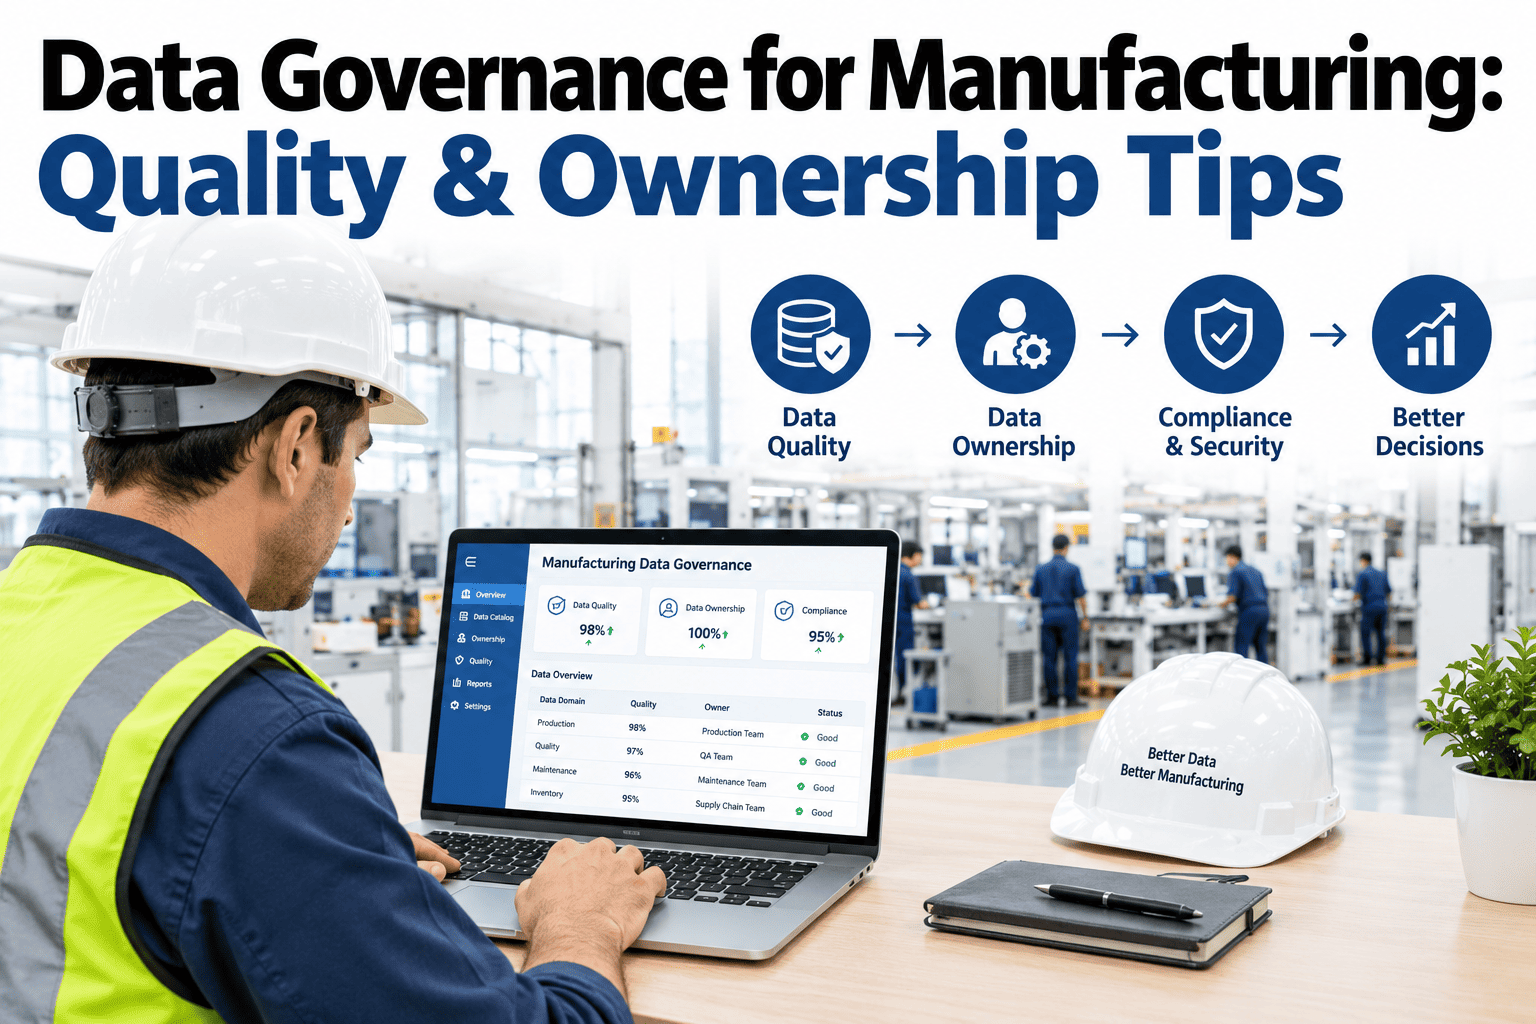
Combining data from many source systems into one architecture raises a question plants sometimes overlook until it becomes a problem, whose definition of a metric is the correct one when two source systems disagree, and who is responsible for fixing a data quality issue once it is discovered in the unified structure rather than buried in a single source system nobody looks at closely. Without clear ownership, a data lake and warehouse can quietly become just as untrustworthy as the scattered systems it replaced, just in one place instead of many.
Building governance into the architecture from the start, clear data ownership by source system, documented definitions for shared metrics, and a defined process for flagging and resolving discrepancies, is what turns a technically sound data platform into one that analysts and engineers actually trust enough to base decisions on. This is as much an organizational commitment as a technical one, and it tends to matter more to long-term adoption than any specific technology choice in the underlying architecture.
Questions Data and Operations Teams Ask First
Give Your Data a Structure Worth Building Analytics On
iFactory unifies your historian, production, and quality data into one analytics-ready architecture. Book a demo to see it designed around your own data sources.