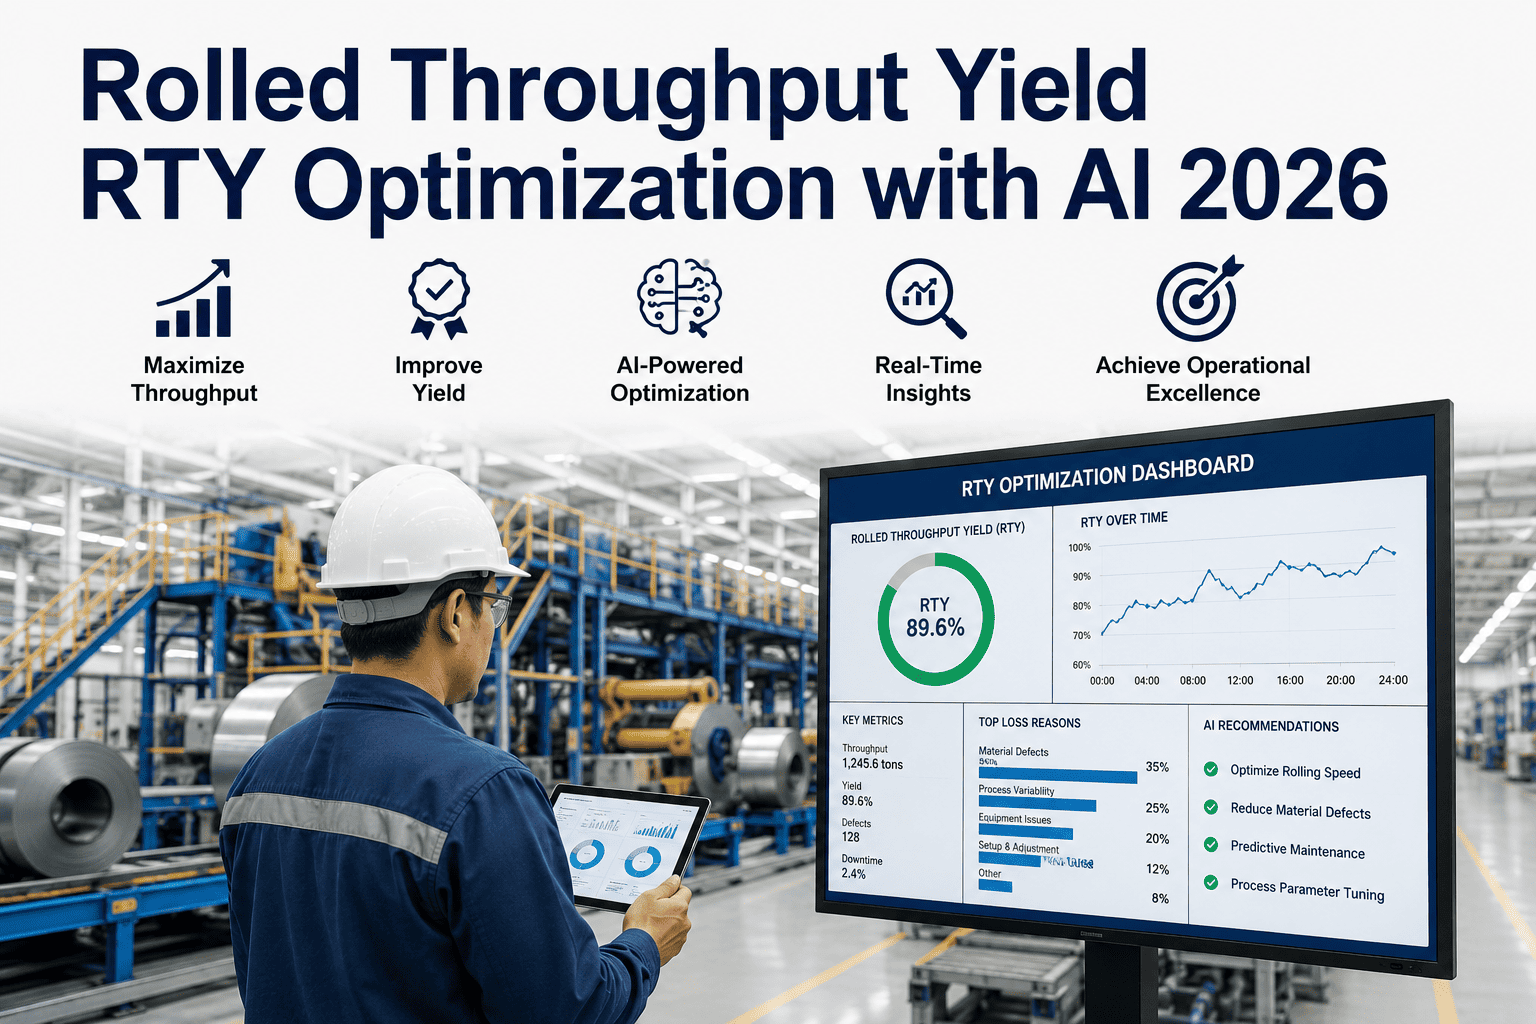
Every quality dashboard in your plant probably shows the same reassuring numbers: Station 1 running at 98.5% yield, Station 2 at 97.8%, Station 3 at 98.2%, Station 4 at 97.5%. Four stations, all above 97%. And yet the end-of-line audit keeps coming back at 82% — and nobody on the morning review call can explain the gap. That gap has a name: it is the rolled throughput yield problem, and it is the most systematically misunderstood concept in manufacturing quality management. Every rework event that station metrics absorbed and hid, every partial reject that was corrected before the count was taken, every unit that passed the station check but carried a latent defect forward — all of it compounds invisibly until it surfaces at final audit or, worse, at the customer. To see how AI decomposes your RTY loss by station and root cause, book a yield analytics session with the iFactory team.
Quality Analytics · Yield Optimization · 2026
Rolled Throughput Yield (RTY) Optimization with AI: Exposing the Compounding Losses That Station Metrics Hide
A Six Sigma practitioner's reference for measuring true end-to-end yield, decomposing compounding losses across multi-step processes, and using AI to identify which station to fix first for maximum RTY recovery.
81.7%
RTY of a 10-step process where every station reports 98% FPY
Hidden
Rework cost never captured in station-level FPY metrics
1–3 steps
Typically drive 70–80% of total RTY loss in any process
AI
Required to correlate which process variable is degrading each step's yield
The Formula Every Quality Director Should Know Cold
RTY: The Arithmetic That Reveals What FPY Conceals
First Pass Yield measures whether a unit passed a given station without rework or rejection on its first attempt. It is a per-station metric, and it is an honest one — at the station level. The problem is that multiplying per-station honesty across a multi-step process produces a system-level number that is almost always far lower than anyone expected.
Rolled Throughput Yield Formula
RTY = FPY₁ × FPY₂ × FPY₃ × … × FPYₙ
Where each FPYᵢ is the true first-pass yield at step i — including all rework, regardless of whether the unit ultimately passed.
The number that shocks every management team the first time they see it
8-step process — each step at 98% FPY
0.98 × 0.98 × 0.98 × 0.98 × 0.98 × 0.98 × 0.98 × 0.98
RTY = 85.1%
10-step process — each step at 98% FPY
0.98¹⁰
RTY = 81.7%
12-step process — each step at 97% FPY
0.97¹²
RTY = 69.4%
Compounding Yield Loss — Visualised
How Eight Steps at 97–99% FPY Compound to 83.2% RTY
The waterfall below shows a real-world 8-step manufacturing process. Each step's FPY looks acceptable in isolation. The compounding effect is only visible when you see all steps together — and it shows exactly which steps carry the most leverage for RTY improvement.
Steps 3 (Welding, −2.7pp) and 4 (Coating, −2.4pp) drive 57% of total RTY loss in this process. Fixing those two steps to 98.5% FPY each recovers 4.8 percentage points of RTY — more than fixing all remaining steps combined.
The Hidden Factory
The Parallel Operation Running Inside Your Plant That Never Appears on Any Report
Phil Crosby named it the "hidden factory" in the 1970s, and it is still running in almost every manufacturing plant today. The hidden factory is the collection of rework loops, repair stations, reinspection cycles, and scrap disposals that absorb the units that failed first pass but never appear in throughput reports because they were corrected before the count was taken. The hidden factory has real headcount, real equipment, real floor space, and real cycle time — none of which appear in your capacity model or your cost of quality calculation unless you are measuring RTY.
What the Dashboard Shows
Station FPY97–99% across all steps
End-of-line outputTarget met (with overtime)
Scrap rate0.8% — within budget
Customer complaintsWithin tolerance
Cost of qualityReported at 3.2% of revenue
RTY exposes
What RTY Reveals
True RTY83.2% — 17% hidden loss
Rework labor14% of total headcount absorbed in hidden factory
Floor space2 rework bays, 1 reinspection lane — never costed to quality
Capacity loss17% of machine time producing units that need rework
True CoQRecalculates to 9.1–11.4% of revenue
Yield Loss Heatmap
Where Losses Compound — Station by Shift by Defect Type
AI-driven RTY analysis generates a multi-dimensional heatmap that identifies not just which step is underperforming, but when and for which defect type — collapsing weeks of manual data assembly into a single view. The grid below shows a representative yield loss heatmap across six process steps and four shifts.
The heatmap instantly shows that Station 3 Welding drives disproportionate loss — especially on Night B shift where FPY drops to 86.1%, an 11.8 point gap from the best-performing shift combination. AI correlation against operator assignments, shielding gas pressure logs, and wire feed parameters for that exact shift/station combination identifies the root cause in minutes.
AI Attribution per Step
What AI Does at Each Stage of the RTY Decomposition
Step 1
Measure True FPY — Including Hidden Rework
Most MES systems record whether a unit ultimately passed, not whether it passed first time. AI cross-references the unit's timestamp trace — time of first inspection, time of any rework event, time of reinspection — to construct the true first-pass outcome. This alone typically reveals FPY figures 3 to 8 percentage points lower than the reported station metric.
Method: Unit-level timestamp tracing across MES, quality, and rework records
Step 2
Compute RTY and Rank Steps by Loss Contribution
With true FPY at each step, AI computes RTY and calculates each step's marginal contribution to total yield loss. The ranking is not by absolute FPY but by RTY leverage — a step with 94% FPY early in a long process chain has more leverage than a step with 96% FPY late in the chain, because more downstream steps will compound the loss.
Method: Marginal RTY sensitivity analysis — ∂RTY/∂FPYᵢ for each step
Step 3
Segment Loss by Shift, Operator, Material, Equipment
AI disaggregates each step's FPY across the attribution dimensions — shift, operator, material lot, machine ID, tooling age. A step averaging 95% FPY may be running at 99% on Day Shift A with Material Lot 4471 and at 88% on Night Shift B with Material Lot 4483. The average hides the intervention target.
Method: Conditional FPY decomposition across categorical variables
Step 4
Correlate Loss to Process Parameters
For the highest-leverage steps identified in Step 2, AI runs a multivariate correlation against every continuous process parameter in the look-back window — temperature, pressure, speed, torque, humidity — to identify the parameter most strongly associated with yield variation at that step. This is where the RTY dashboard becomes an action plan.
Method: SHAP attribution, change-point detection, Pearson correlation on historian data
Step 5
Simulate RTY Recovery Scenarios
Once the attribution is established, AI simulates the RTY outcome of fixing each root cause to varying degrees. "If we tighten temperature control at Station 3 from ±4°C to ±1.5°C, our model projects FPY at S3 improves from 92.9% to 97.2%, and total RTY improves from 83.2% to 88.4%." The quality team can rank scenarios by implementation cost versus RTY recovery before committing to a CAPA.
Method: Sensitivity-weighted RTY simulation from correlation coefficients
Step 6
Monitor RTY Trend in Real Time
Post-CAPA, the RTY dashboard shows the real-time yield trend at each step and the cumulative RTY trajectory. Control limits on RTY allow the system to flag early degradation — a 0.5 percentage point drop at a monitored step triggers a correlation run automatically, before the loss compounds through the remaining process steps.
Method: CUSUM on step FPY with automated correlation trigger on rule violation
Your Hidden Factory Has a Number
Find It Before Your Next Management Review
iFactory's RTY module connects to your existing MES and historian to compute true first-pass yield at every step — including the rework events your current reporting absorbs. The first analysis session typically surfaces 6 to 14 percentage points of RTY loss that nobody in the plant currently knows about.
Yield KPI Reference
The Six Metrics That Form a Complete Yield Intelligence Picture
Rolled Throughput Yield
Target: >95%
The single most honest summary of process quality. Computed as the product of true FPY at every step. World-class manufacturing targets above 95% RTY. Below 85% indicates a hidden factory consuming significant capacity and cost.
True First Pass Yield
Per step: >98.5%
FPY computed from unit-level traceability — not station pass/fail counts that can include rework corrections. The difference between reported FPY and true FPY is the direct measure of hidden factory activity at each step.
RTY Step Sensitivity
Rank all steps
∂RTY/∂FPYᵢ — the marginal improvement in system RTY for a 1% improvement at each step. Steps early in the process chain with many downstream steps have higher sensitivity. Improvement effort at high-sensitivity steps has greater system-wide leverage.
Hidden Factory Index
Target: <2%
Percentage of total production labor hours consumed by rework, reinspection, and repair activities that were necessary because of first-pass failures. A hidden factory index above 10% indicates severe quality system dysfunction.
RTY Degradation Rate
Trend: flat or improving
Week-over-week or month-over-month change in total process RTY. Sustained degradation at more than 0.5 percentage points per month without active root cause investigation is a leading indicator of an upcoming quality escape.
Cost of Poor Quality (COPQ)
Target: <3% of revenue
Total financial cost of quality failures — scrap, rework, warranty, inspection overhead, and customer return handling. RTY provides the mechanism for calculating COPQ accurately by exposing all rework events. Industry average COPQ is 5–8% of revenue; world-class is below 3%.
From the Field
“
Rolled Throughput Yield is the metric that quality directors learn to love and operations directors learn to fear — because it is the first number that makes the hidden factory visible to the finance team. I have run RTY calculations for the first time in fourteen plants over my career, and the reaction is always the same: disbelief, then defensive questioning of the methodology, then a very quiet acceptance that the number is right. The hidden factories I have measured ran between 8 and 23 percent of total production labor. Not rework operators — all operators, including direct production headcount doing informal corrections that never hit a rework log. The plants that reduced their hidden factory to under 3 percent within two years did it the same way every time: they got the data right first. Not better operators. Not new equipment. They measured true FPY at every step, built a real RTY number, ranked the steps by sensitivity, and attacked the top two causes with focused CAPA. The technology to do that automatically — without twelve analysts assembling spreadsheets — is what has changed. That is the only thing that has changed.
Dionne Osei-Mensah, CMQ/OE, CSSBB
Certified Manager of Quality / Organizational Excellence · Certified Six Sigma Black Belt · 26 years leading quality transformations in automotive, medical device, and FMCG · Former VP Quality, Fortune 500 Consumer Goods Manufacturer
Quality Team Questions
Rolled Throughput Yield — Frequently Asked
What is the difference between RTY and traditional yield or FPY, and why does it matter?
Traditional yield measures whether a unit passes final inspection — a unit that was reworked three times before passing counts as a yield success. First Pass Yield measures whether a unit passed a given station on the first attempt, but it is measured independently at each station with no compounding. RTY multiplies the true first-pass rates at every station together to produce a single system-level metric that captures every failure event in the process, whether or not it was corrected. The reason it matters is cost and capacity: rework costs labour, machine time, and floor space. A plant with 90% RTY is spending approximately 10% of its production resource on re-doing work that should have been done right the first time. That cost is real regardless of whether the reworked units ultimately pass final inspection. For a walkthrough of how iFactory computes RTY from your existing MES data, book a demonstration session.
Our MES does not track rework events at the unit level — can we still calculate RTY?
Yes, with some methodology adaptation. If unit-level rework records are absent, RTY can be estimated from defect counts per station relative to throughput — calculating the proportion of units that would have required rework based on defect frequency and defect type distribution. This produces an estimated RTY rather than a measured one, but even an estimated RTY is more accurate than a per-station FPY that ignores rework entirely. The better long-term solution is to implement unit-level traceability — a serial number or barcode scan at every station entry and exit — which iFactory can support as part of its MES integration layer. Most plants that deploy this discover their estimated RTY was actually optimistic by 3 to 6 percentage points. To assess your current data readiness for RTY measurement, contact the iFactory support team.
How do we decide which step to fix first when multiple steps are all underperforming?
The correct prioritisation is not by absolute FPY — it is by RTY sensitivity, which is the marginal improvement in system RTY for a 1% improvement at each specific step. Steps earlier in the process chain have higher sensitivity because more downstream steps will compound their losses. A step at position 2 in a 10-step process has approximately twice the RTY leverage of a step at position 9, all else being equal. After ranking by sensitivity, overlay implementation feasibility — some high-sensitivity steps may have a known low-cost fix available, while others require capital expenditure. The output is a prioritised action list that balances RTY recovery per unit of effort rather than simply attacking the lowest-FPY step first.
How does RTY connect to our Cost of Poor Quality calculation?
RTY is the mechanism that makes COPQ accurate. Without RTY measurement, COPQ calculations typically capture only the visible costs — scrap value, warranty claims, and formal rework orders. The hidden factory costs — informal corrections, operator time spent on adjustments, reinspection labour, and machine time producing units that need rework — are invisible without unit-level yield tracking. Connecting RTY to COPQ typically reveals a total cost 2 to 4 times larger than what was previously reported, because the hidden factory is systematically excluded from the visible cost model. For a demonstration of how iFactory's yield analytics module connects to COPQ reporting, book a quality analytics session.
How quickly should we expect RTY to improve after implementing a CAPA at the highest-sensitivity step?
The response time depends on the nature of the root cause and the type of corrective action. A process parameter adjustment — tightening a temperature control band, correcting a calibration drift — can produce measurable FPY improvement at the target step within 24 to 72 hours if the root cause identification was accurate. A tooling or equipment change may require 1 to 2 weeks to see statistically stable improvement due to warm-up effects and run-in variation. An operator training or procedure change typically requires 4 to 6 weeks to reach the trained operator population and stabilise. The RTY monitoring layer in iFactory tracks the target step's FPY in real time post-CAPA, allowing the quality team to confirm improvement, detect partial recovery, or identify a second contributing cause that the initial CAPA did not address.
The Hidden Factory Has an Address. AI Finds It.
Measure True RTY. Rank the Steps. Fix the Right Two First.
iFactory's RTY module constructs true first-pass yield from unit-level traceability, computes sensitivity-ranked step analysis, and runs automated correlation against process parameters at your highest-leverage steps. The first session typically produces more actionable yield intelligence than the prior 12 months of station-level FPY reporting.