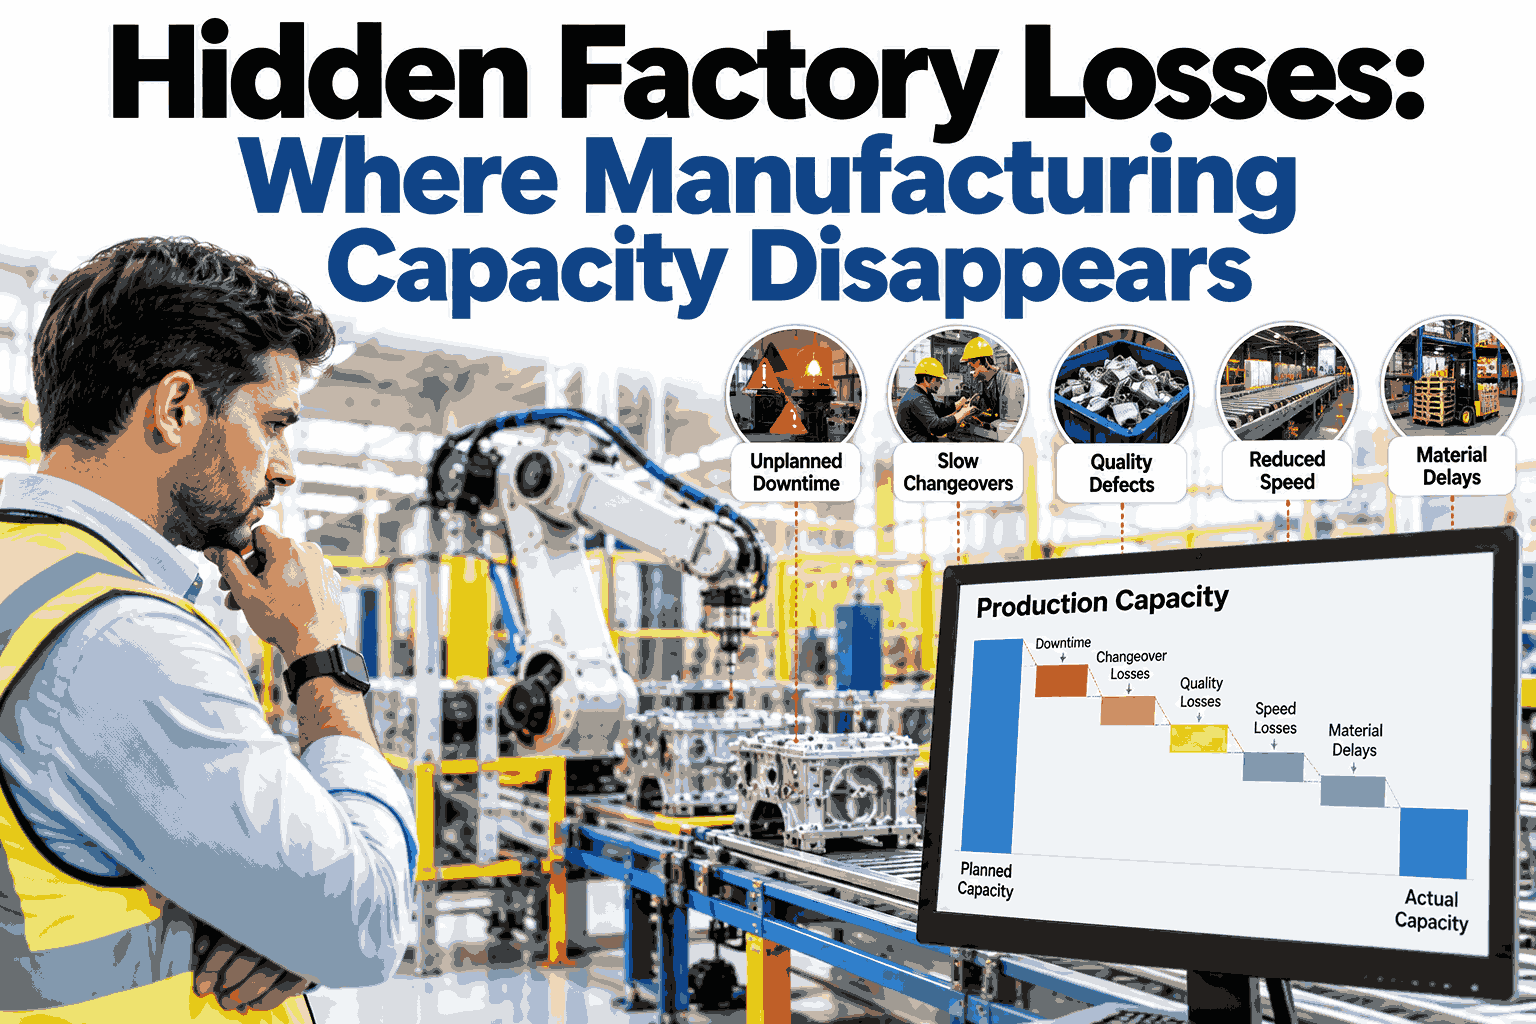
Most factories can tell you how many hours a machine was scheduled, but far fewer can tell you where the missing capacity actually went. Between scheduled hours and good units sit short stops, slow cycles, waiting time and small quality drifts that nobody records because each one feels too minor to write down. Added together, these losses often outweigh the breakdowns everyone talks about in the morning meeting. If you want to see where they sit on your own equipment, book a loss discovery session with the iFactory AI team.
Find the Capacity Your Factory Already Pays For but Never Produces
iFactory AI listens to your machines continuously, so short stops, slow running and waiting time become visible, ranked and ready to fix instead of disappearing into an average.
The Hidden Factory Is the Capacity You Pay For and Never Sell
Every plant has two factories. One produces the goods that ship, and the other quietly consumes labour, energy and machine time on work that never reaches a customer, such as retrying jammed parts, waiting for a forklift or recovering from a rough start. The second factory is hidden because nobody budgets for it and nobody measures it, yet it draws on the same equipment, the same people and the same hours as the first one.
The split above is an example, but the shape is familiar to many operations teams. Reported losses get attention because they are loud and traceable to a work order. Hidden losses are quiet, scattered across dozens of small events, and spread over every shift, which is precisely why they survive for years without a single owner.
Naming those losses is the first real step in reliability work. A problem that has no category cannot be ranked, assigned or fixed, so most improvement programs begin by building a shared vocabulary of loss that operators, maintenance and managers all use the same way.
Eight Places Manufacturing Capacity Quietly Disappears
Hidden losses fall into recognisable families. Walking a line with this list in hand usually turns up several of them within the first hour, and each one has a different cause and a different fix.
Notice that only a couple of these involve a machine actually breaking. The rest are flow, timing and coordination problems, which is why reliability teams that look only at repair records often miss most of the available gain.
Thirty Seconds at a Time: How Micro-Stops Add Up to a Working Week
Micro-stops are the clearest example of why hidden losses are underestimated. A stop of thirty seconds feels trivial to the operator who clears it, and it is almost never entered in a downtime record, but the arithmetic is not trivial at all.
Twenty-five hours is more than three full working days on a single line, lost to events that no report contains. The numbers here are an example, so use your own, but the pattern holds in most plants: frequency matters more than duration, and only continuous capture counts events at that scale.
What the Sheet Says Versus What the Machine Actually Saw
When teams first connect a line to automatic capture, the same eight-hour shift often produces two very different stories. The comparison below shows a typical pattern, and it is usually the moment the conversation about hidden losses becomes real.
The extra sixty-five minutes did not come from one dramatic failure. They came from dozens of brief stops, a few slow starts and some waiting that everyone had mentally filed as part of the job. This example is illustrative, and your own gap could be smaller or larger, but it is rarely zero.
Once the gap is visible, the argument shifts from whether the losses exist to which of them to remove first.
Each Hidden Loss Leaves a Different Trace in Your Data
Different losses need different evidence. This table links each loss to the way it usually hides and to what must be captured before anyone can fix it.
| Hidden loss | How it hides | Typical symptom | What to capture |
|---|---|---|---|
| Micro-stops | Cleared by the operator in seconds | Output below plan with no recorded downtime | Stop count, duration and location on the line |
| Slow running | Looks like a normal running machine | Cycle time creeping above the standard | Actual cycle time against rated speed |
| Waiting for material | Logged as other or not logged at all | Idle line with healthy equipment | Idle periods with a starved or blocked state |
| Changeover overrun | Averaged into planned downtime | Setup taking longer on some shifts | Start, end and step timing per changeover |
| Startup scrap | Counted with normal rejects | High reject rate after every restart | Rejects tagged by time since start |
| Rework loops | Parts counted as good the first time | Machine hours up with output flat | First pass yield and rework counts |
The pattern across the table is consistent. Each loss needs a time-stamped, machine-level record, and each is invisible when the only data source is a daily total entered after the fact.
Ask What Is Hiding Inside Your Own Production Hours
Tell us which lines worry you most, and see how iFactory AI would measure stops, speed losses and waiting time on those machines from the first week.
Why a Ranked Chart Beats a Long List of Complaints
Once stops and slowdowns are captured and tagged, the data forms the classic Pareto shape, where a few causes explain most of the lost time. Teams that see this chart usually stop debating and start assigning owners to the top few bars.
The right-hand column shows the running total. In this example, fixing the top three causes removes two thirds of the problem while ignoring half a dozen smaller ones, which is a far better use of a maintenance team than chasing whichever complaint was loudest this week.
The Reliability Loop That Turns Visible Losses Into Fewer Stops
Seeing a loss is only half of the job. Plants that gain lasting capacity treat visibility as the start of a loop that repeats every week, with each pass removing another layer of the hidden factory.
The loop works because it replaces opinion with evidence at every step. Maintenance sees which stops repeat, production sees which are really flow problems, and quality sees which rejects cluster after restarts, so each team fixes what belongs to it.
Three Ways to Detect Hidden Losses, and What Each One Misses
No single source tells the whole story, which is why capable systems combine several. Understanding what each source sees well helps you decide where to start.
Combining the three gives timing from machines, meaning from people and extra coverage from vision where signals are thin. Teams that want to see which mix suits their equipment can discuss a detection plan for your lines with the iFactory specialists.
A Thirty-Day Plan to Uncover the Hidden Factory on One Line
You do not need a plant-wide project to start. A single line, four weeks and a clear goal are enough to learn how large your own hidden losses are.
By the end of the month the team has a measured baseline, a ranked list and at least one confirmed improvement. That is usually enough evidence to decide, with facts rather than enthusiasm, whether to extend the approach to other lines.
Eight Questions to Ask on the Floor Before You Begin
These questions help a team judge how visible its losses are today and where the biggest blind spots probably sit.
If several answers are no, that is useful information in itself. It means the hidden factory is likely large, and the first benefit of automatic tracking will be simply to measure it.
What Teams Ask Before Hunting for Hidden Factory Losses
Uncover the Hidden Factory Inside Your Production Lines
Book a session with iFactory AI to review where your lines lose time today and see how continuous monitoring can turn hidden losses into ranked, fixable actions.