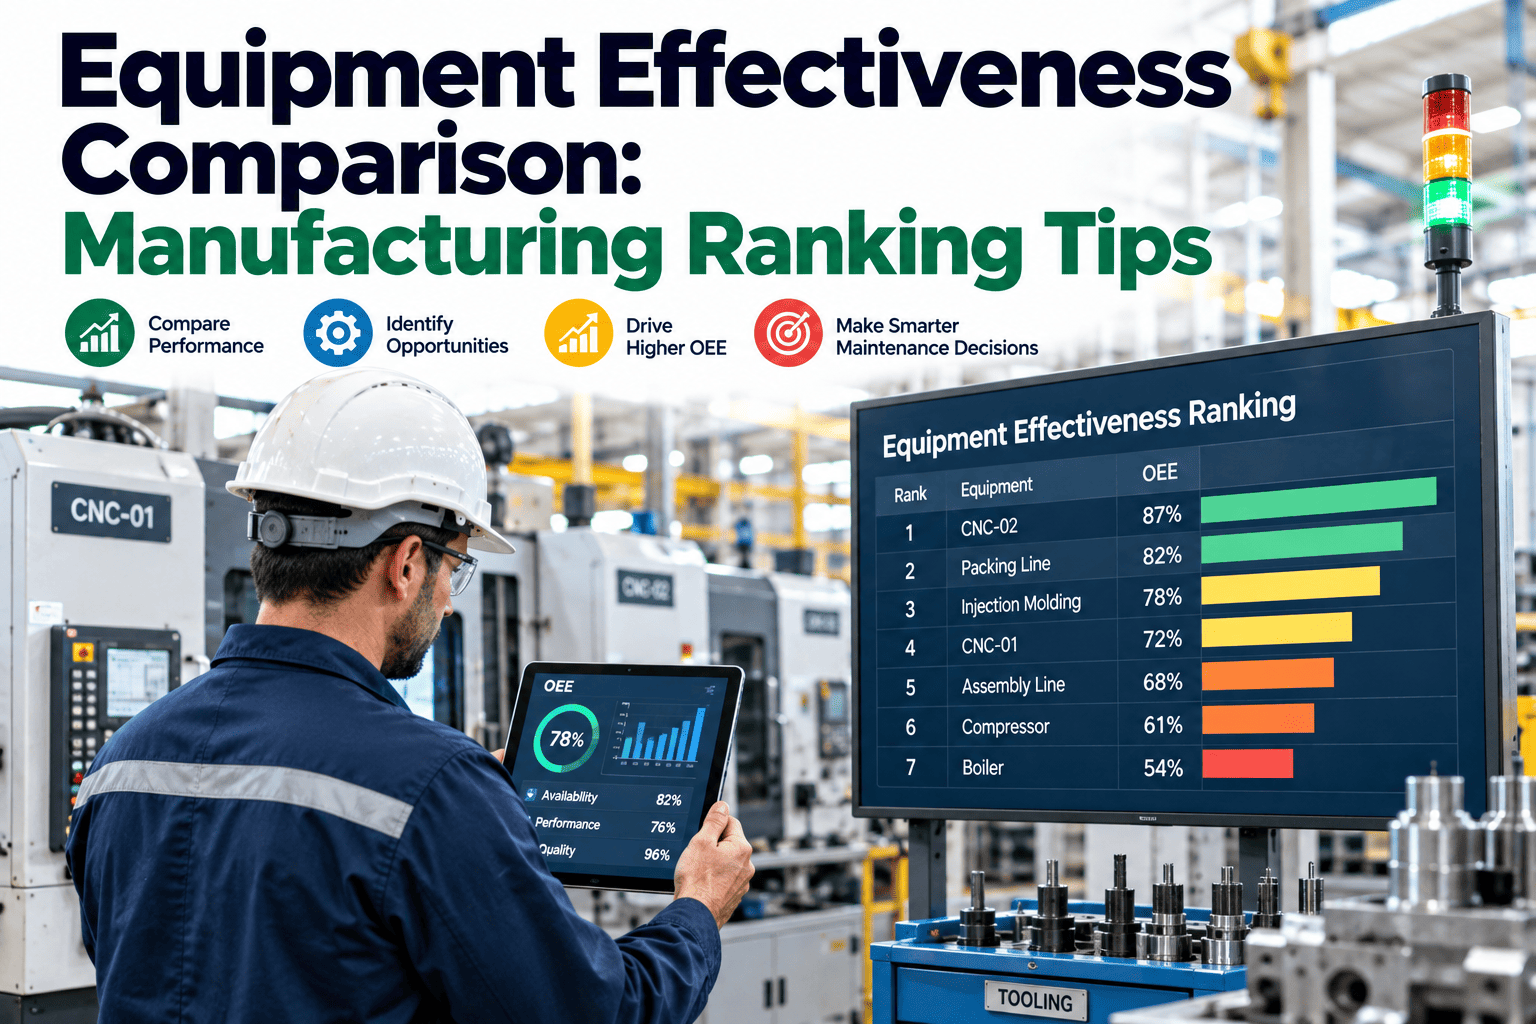
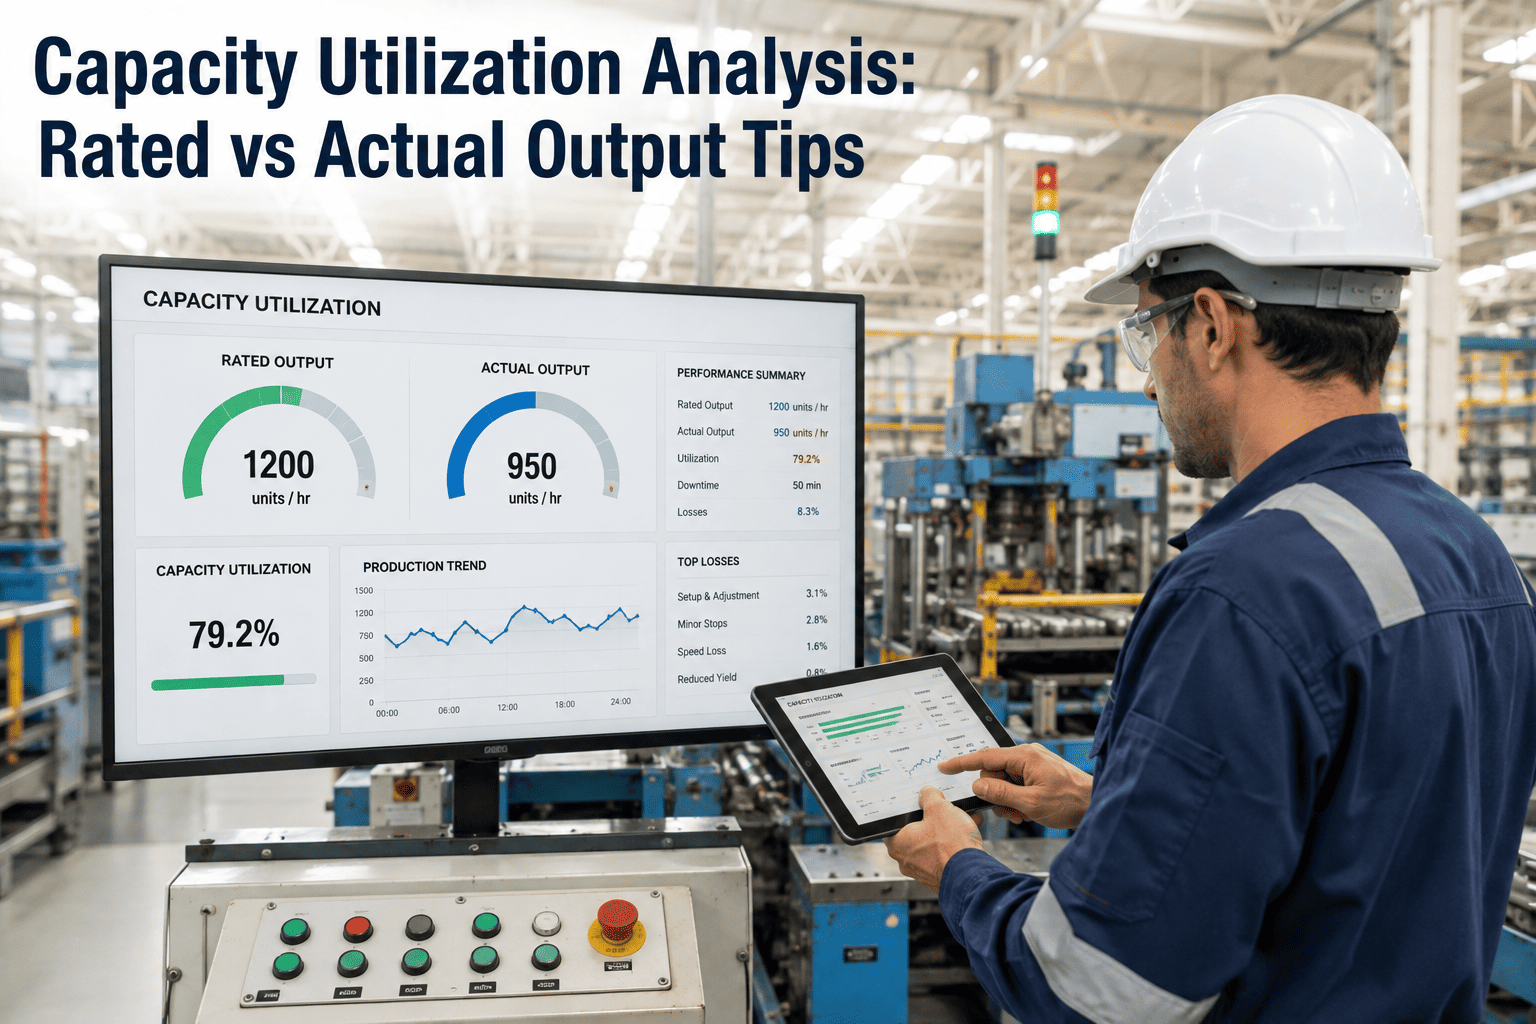
OEE tells you how well a line performs during the hours it is scheduled to run, but it says nothing about the hours it is not scheduled at all, and that blind spot can hide a significant amount of unused factory capacity. A line running at a strong 85% OEE could still be sitting idle two full shifts a day, representing far more untapped output than any efficiency improvement on the running shifts ever could. TEEP analysis measures against total calendar time instead, and you can book a demo to see how much hidden capacity your plant actually has.
TEEP ANALYTICS · CAPACITY UTILIZATION · AI MANUFACTURING
OEE Measures Your Scheduled Hours. TEEP Measures Everything You're Not Using.
iFactory calculates TEEP alongside OEE to reveal how much of your total possible factory capacity, including unscheduled hours, is actually being used, and where the biggest untapped opportunity sits.
THE CAPACITY BLIND SPOT
Why a Strong OEE Score Doesn't Mean Full Capacity Use
OEE is calculated only against planned production time, which means any hours a line is not scheduled to run simply do not count against the score, regardless of whether that idle time reflects a real capacity constraint or just historical scheduling habits. TEEP, or Total Effective Equipment Performance, measures against the full calendar instead, exposing how much of a plant's true potential output is being left on the table entirely.
Calendar Time
100% of Available Hours
Planned Production Time
Often 60-70% of Calendar Time
OEE-Scored Output
A Fraction of Planned Time
TEEP Result
The True Capacity Picture
TEEP VS OEE VS UTILIZATION
Three Related Metrics That Answer Different Questions
OEE and Utilization Alone
OEE measures performance only during scheduled production time
Utilization shows scheduled time against calendar time separately
Unscheduled hours are treated as outside the measurement entirely
Capacity expansion decisions rely on incomplete visibility
TEEP as a Combined View
TEEP multiplies utilization and OEE against total calendar time
Unscheduled hours become visible as a quantified opportunity
True equipment capacity is expressed as one clear percentage
Capacity investment decisions are grounded in complete data
Find Out How Much Capacity Your Plant Is Really Using
iFactory calculates TEEP against your full calendar time to reveal capacity you may not know you have.
WHERE HIDDEN CAPACITY TYPICALLY SITS
The Places TEEP Analysis Usually Uncovers Opportunity
Unscheduled Shift Hours
Lines that only run one or two shifts a day often carry significant unused capacity during the remaining scheduled-off hours.
Weekend and Holiday Downtime
Calendar time that is never scheduled at all, such as weekends, represents capacity that TEEP surfaces but OEE cannot see.
Underutilized Redundant Lines
A backup or redundant line running well below its scheduled potential can be identified clearly through capacity analysis.
Seasonal Scheduling Gaps
Capacity that sits unused during off-peak seasons can be quantified and considered for new product lines or contract work.
CAPACITY MATURITY LEVELS
How Plants Typically Progress in Capacity Visibility
| Maturity Level |
What Is Measured |
Decisions Enabled |
| Level 1 |
OEE only, during scheduled hours |
Shift-level efficiency fixes |
| Level 2 |
OEE plus manual utilization estimate |
Rough scheduling adjustments |
| Level 3 |
TEEP calculated periodically |
Quarterly capacity reviews |
| Level 4 |
TEEP tracked continuously by line |
Ongoing capacity and investment planning |
GETTING STARTED
Building a Complete Capacity Picture
Step 1
Confirm Calendar Baseline
Total available hours per line are established as the fixed baseline that all other metrics are measured against.
Step 2
Layer in Scheduling Data
Planned versus unplanned hours are mapped to reveal how much calendar time is currently left unscheduled.
Step 3
Combine With OEE
Existing OEE data is combined with scheduling data to produce a continuous, line-level TEEP score.
Step 4
Evaluate Capacity Decisions
Clear TEEP visibility supports decisions on adding shifts, adding lines, or reallocating existing underused capacity.
MEASURED RESULTS
Outcomes Reported After Adopting TEEP Analysis
10-25%
Hidden capacity typically identified once unscheduled hours are counted
Delayed
Capital investment decisions avoided by using existing hidden capacity first
Clearer
Shift-addition business cases backed by real utilization data
Continuous
Visibility into capacity trends across seasons and product cycles
FREQUENTLY ASKED QUESTIONS
Questions Teams Ask About TEEP and Capacity Analysis
Is TEEP meant to replace OEE as our primary performance metric?
No, TEEP and OEE answer different questions and are typically used together rather than one replacing the other, since OEE remains the right metric for judging performance during scheduled production while TEEP is the right metric for judging total capacity use. Most plants keep OEE as the day-to-day operational metric and bring TEEP into quarterly or annual capacity planning conversations.
Book a demo to see how both metrics are presented together.
How do you account for planned maintenance windows in the TEEP calculation?
Planned maintenance is tracked as its own category of calendar time separate from unscheduled production hours, since maintenance downtime is a deliberate and often necessary use of time rather than lost capacity in the same sense as an unscheduled shift. This distinction keeps the TEEP number honest about which unused hours represent a genuine opportunity versus required upkeep.
Contact support to review how maintenance windows are categorized.
Does finding hidden capacity through TEEP always mean we should add another shift?
Not necessarily, since adding a shift involves staffing, demand, and cost considerations well beyond the equipment capacity number alone, and TEEP is meant to inform that business decision rather than dictate it automatically. What the data does provide is a clear, quantified view of how much additional output is physically possible, which makes any shift-addition business case far easier to evaluate.
Book a demo to discuss how TEEP data supports these business decisions.
Can TEEP be calculated separately for each line rather than the whole plant?
Yes, TEEP is typically calculated at the individual line or equipment level first, since a plant-wide average would hide exactly the kind of line-specific opportunity that makes the metric useful in the first place. Line-level TEEP can then be rolled up into a plant or site view for higher-level capacity planning conversations.
Contact support to discuss line-level versus plant-level reporting.
How far back does historical data need to go before TEEP numbers are meaningful?
A full seasonal cycle, typically twelve months, gives the most reliable picture, since capacity use often varies meaningfully between peak and off-peak periods and a shorter window can overstate or understate true opportunity. That said, useful early signals often appear within the first few months of continuous tracking, well before a full year of data is available.
Book a demo to discuss a realistic timeline for your production calendar.
Stop Planning Capacity on Incomplete Numbers
iFactory gives you a full TEEP picture so capacity decisions are based on your actual, total factory potential.