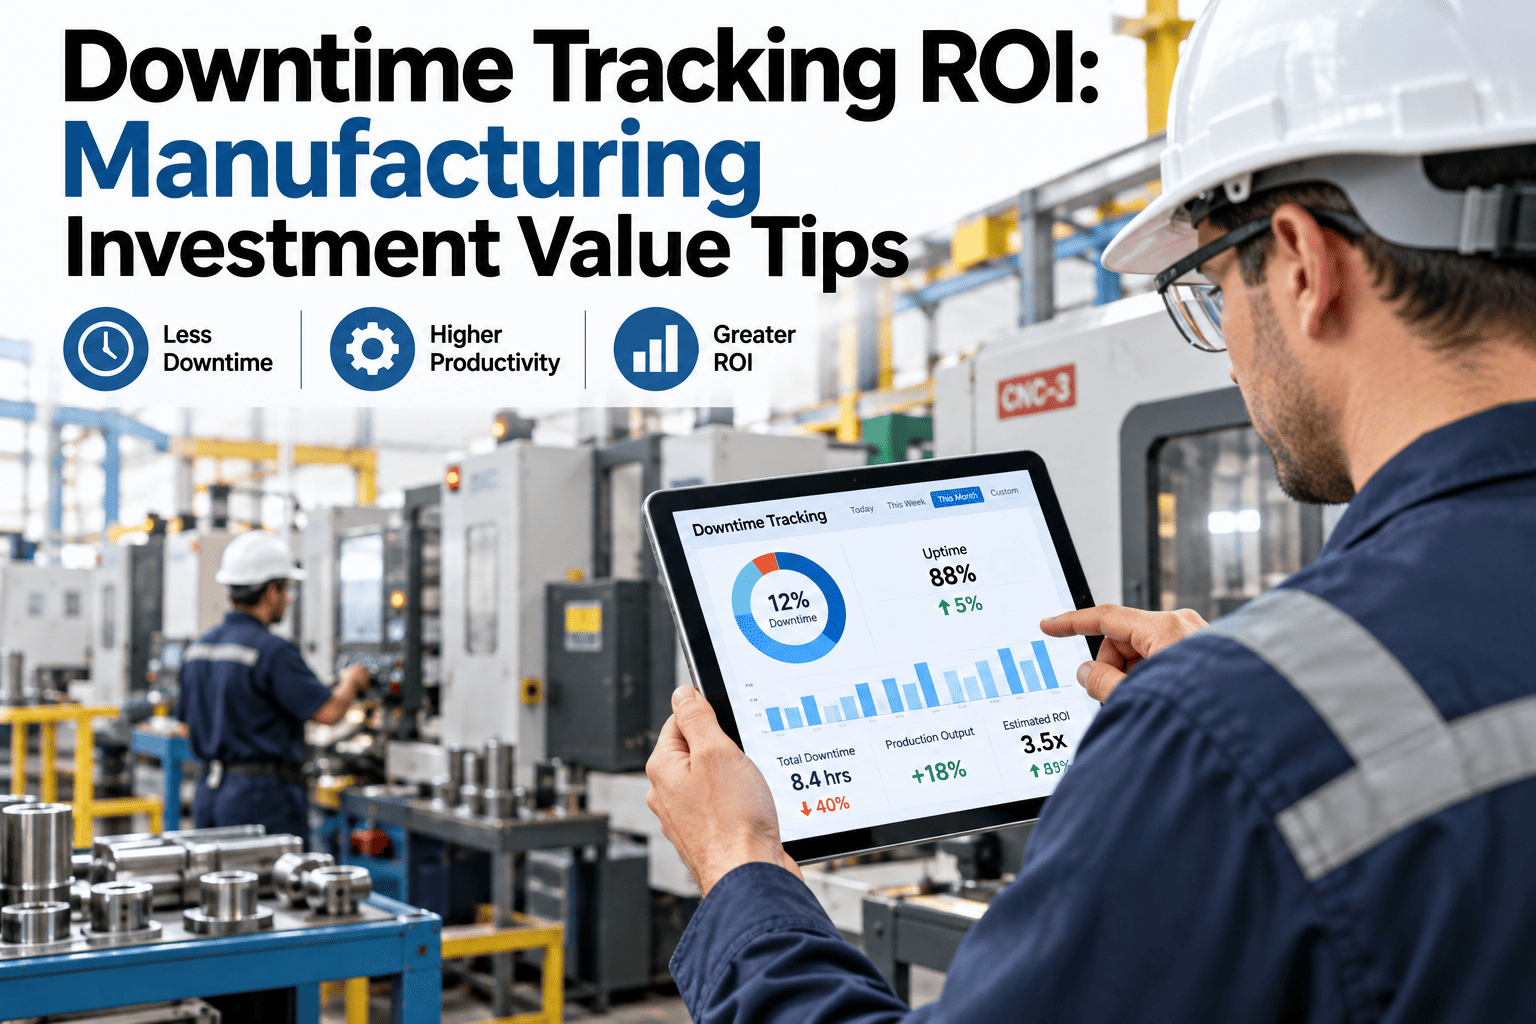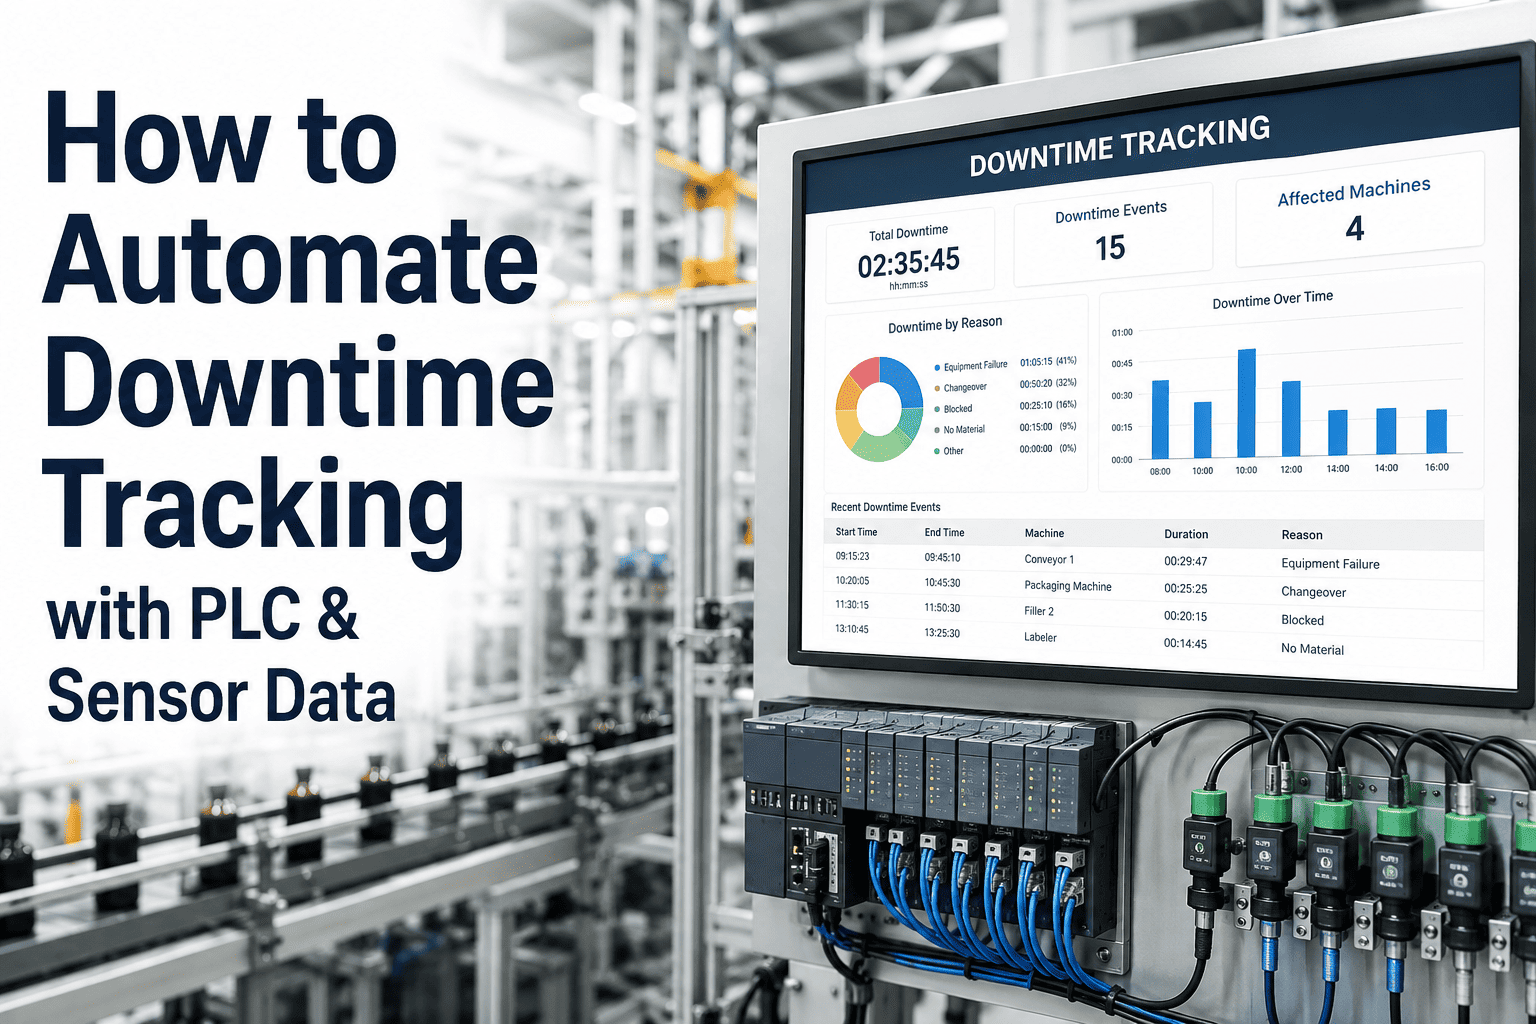
Ask any shift supervisor how much downtime happened last week and the answer usually comes from a paper log, filled in from memory near the end of a twelve-hour shift. The big stoppages make it onto the sheet. The eighteen-second jam that happened forty times never does, because nobody has time to write down something that short while also running the line. Automated downtime tracking pulls stop and start events directly from PLC signals and sensors, catching every loss automatically instead of relying on an operator's memory at the end of a long shift, and a 30-minute session can show what your true downtime picture looks like once nothing gets missed.
Automated Downtime Tracking: Catching Every Stop Your Paper Log Misses
Manual downtime logs capture the stoppages big enough to remember. Automated tracking captures all of them — from the eighteen-second jam to the four-hour breakdown — pulled directly from the signals your equipment is already generating, with no extra step for an operator to remember during a busy shift.
Why Manual Downtime Logging Always Undercounts
Manual logging is not a matter of operator diligence — it is a structural limitation. A person running a line has a finite amount of attention, and writing down a short stop competes directly with actually clearing it and getting the line running again. Three patterns explain most of the gap between what a paper log shows and what actually happened.
Short Stops Are Invisible to Memory
A fifteen-second jam happening every few minutes rarely gets individually logged. By the end of a shift, dozens of these events have simply vanished from the record, even though together they may account for more lost time than any single breakdown that everyone remembers and discusses the next morning.
Reason Codes Get Applied After the Fact
When downtime is logged at the end of a shift rather than the moment it happens, the specific cause is often reconstructed from memory rather than recorded accurately, which quietly corrupts the reason code data everyone relies on for Pareto analysis and root cause investigations weeks later.
Busy Shifts Log Less, Not More
Ironically, the shifts with the most downtime are often the ones with the least accurate logs, because operators are too busy fighting fires to also document them in real time, leaving exactly the shifts that need the most scrutiny with the thinnest data.
Why the Undercounting Matters More Than It Looks
An 80 percent undercount of micro-stops does not just mean the total downtime number is a little low. It means the entire prioritization exercise that follows — which loss to fix first, which line needs investment, which shift needs coaching — gets built on a foundation that is systematically skewed toward whatever was big enough to notice, rather than whatever is actually costing the most capacity.
How Automated Downtime Tracking Actually Works
Automated tracking does not require ripping out existing equipment or adding an operator-facing interface for every stop. It works by listening to signals the equipment is already generating and translating them into structured downtime events without anyone needing to type a thing.
PLC & Sensor Signal Capture
Stop and start states are read directly from existing PLC tags, motor run signals, or dedicated sensors — no manual trigger required for the system to know a machine has stopped, and no new interface for operators to interact with.
Automatic Event Detection
Every stop, regardless of duration, gets logged as a discrete event with a precise start and end timestamp, capturing the eighteen-second jams alongside the four-hour breakdowns with equal accuracy and without any risk of being forgotten.
Reason Code Assignment
Where possible, signal patterns automatically suggest a likely reason code; where operator input is genuinely needed, a simple prompt captures it at the moment the stop happens rather than hours later when the details have already blurred together.
Real-Time Dashboard & Pareto Feed
Every captured event feeds directly into loss dashboards and Pareto analysis, so the top downtime contributors are visible continuously instead of appearing once a week in a static report that is already out of date by the time anyone reads it.
Manual Logging vs Automated Downtime Tracking
The gap between the two approaches is not a matter of effort — even the most diligent operator cannot manually log what they never had time to notice. The table below shows what changes once the tracking happens automatically.
| Capability | Manual Paper Log | Automated PLC/Sensor Tracking |
|---|---|---|
| Events captured | Large stoppages only | Every stop, any duration |
| Timestamp accuracy | Estimated after the fact | Precise, to the second |
| Reason code accuracy | Reconstructed from memory | Captured at time of event |
| Visibility into micro-stops | Effectively none | Full pattern visibility |
| Operator workload | Logging competes with clearing the stop | Minimal to none |
See the Downtime Your Paper Log Has Been Missing
iFactory captures every stop directly from your existing PLC and sensor signals, so nothing gets lost to a busy shift or an end-of-shift memory gap.
What Automated Tracking Catches That Manual Logs Never Do
The value of automated tracking is not just more accurate versions of the losses everyone already knew about — it is entirely new categories of loss that were structurally invisible to manual logging in the first place.
Micro-Stop Clusters
A pattern of short stops concentrated around a specific time of shift or product changeover, invisible until every individual event is logged and aggregated.
Creeping Cycle Time Drift
Gradual slowdowns that never register as a full stop but quietly erode throughput over weeks, only visible when cycle time is tracked continuously against a baseline.
Shift-to-Shift Variance
Real differences in downtime patterns between shifts, which manual logs tend to flatten out because each shift only records what it personally noticed.
Repeat Offenders at the Component Level
The same sensor or actuator triggering short stops repeatedly, a pattern that only becomes visible once individual events are tagged to a specific asset rather than a general line description.
Getting From Signal to Insight
Most plants can start capturing automated downtime data faster than they expect, since the underlying signals typically already exist in the control system.
Inventory Existing Signals
Identify which PLC tags and sensors already indicate machine run state, since most equipment already generates this data without any modification.
Map Signals to Downtime Events
Configure logic that translates a stop signal into a structured downtime event with accurate start and end timestamps.
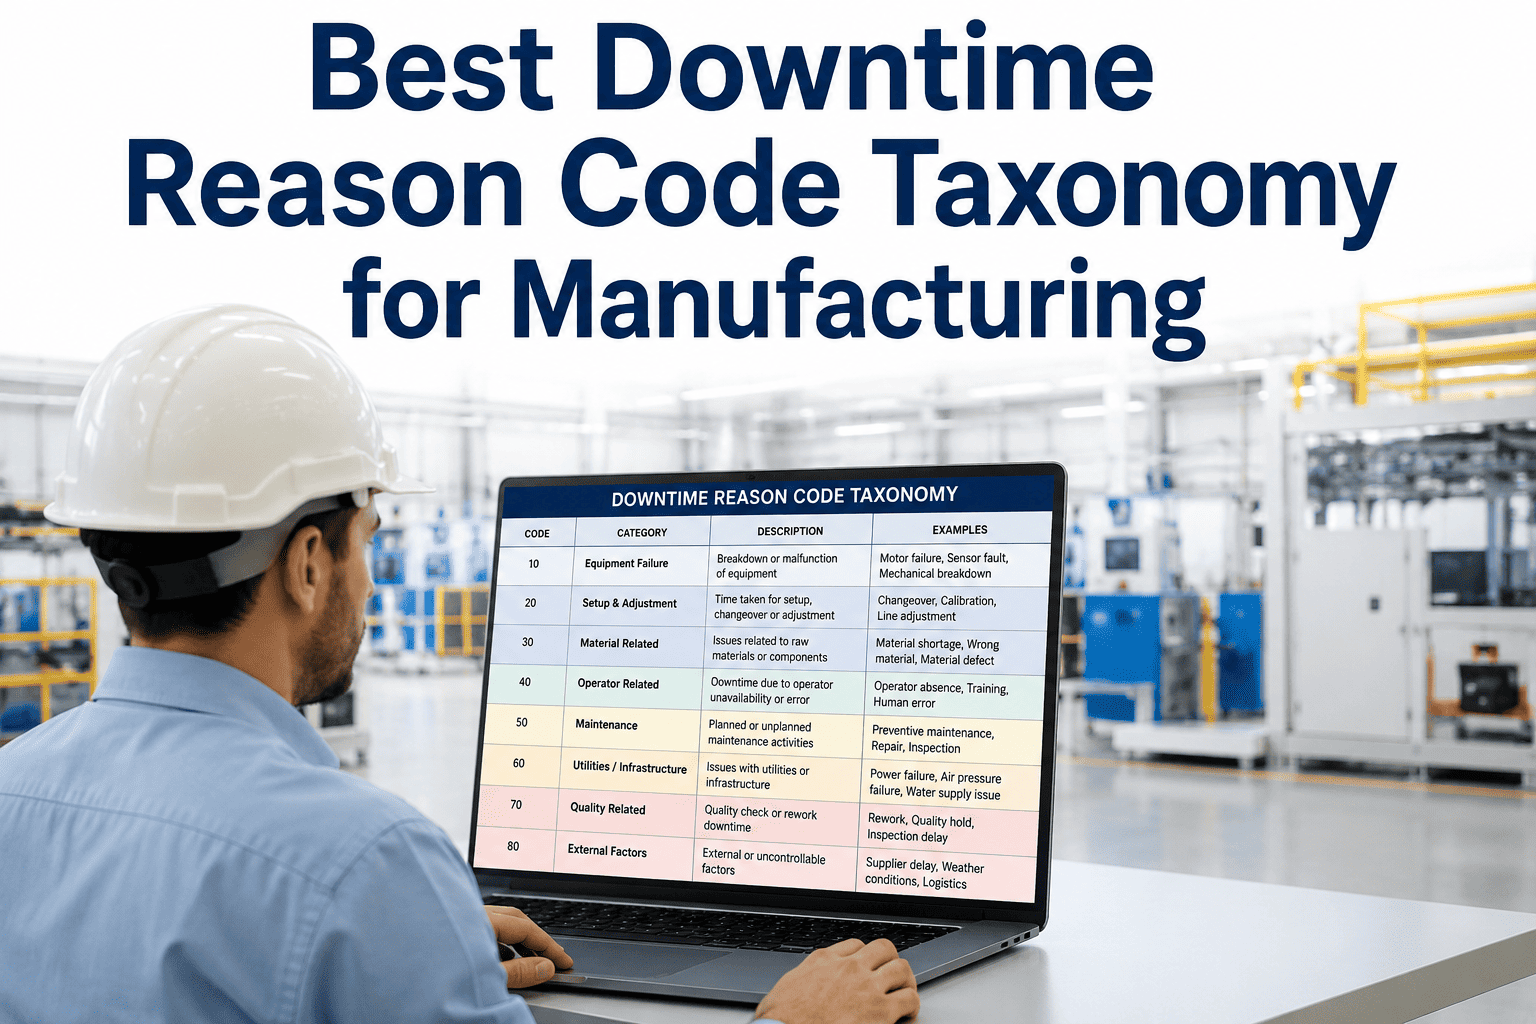
Build the Reason Code Taxonomy
Establish a standardized set of reason codes that automated detection can suggest and operators can quickly confirm when input is genuinely needed.
Launch Dashboards & Pareto Views
Roll out real-time visibility so operators, supervisors, and plant leadership all see the same accurate downtime picture as it happens.
What Changes Once Downtime Is Fully Visible
Downtime Totals Often Jump 20-40%
Not because more downtime is happening, but because the true total was always higher than what manual logs ever captured.
Pareto Rankings Change Completely
The loss category everyone assumed was the top contributor is frequently displaced once micro-stops finally get counted accurately.
Reaction Time Drops From Shifts to Minutes
Real-time dashboards let supervisors respond to an emerging pattern the same shift it starts, instead of discovering it in next week's report.
Frequently Asked Questions
Do we need new sensors, or can this work with our existing PLCs?
Most equipment already generates run-state signals through its existing PLC that can be used directly, without any new hardware. Older or fully manual equipment may need a simple retrofit sensor, but this is the exception rather than the rule. Our team can assess what your current control systems already capture before recommending anything additional.
How does the system know the reason for a stop, not just that one happened?
Signal patterns can automatically suggest a likely cause for many common stop types based on which specific fault or interlock triggered. Where the cause genuinely requires human judgment, a lightweight prompt captures it from the operator at the moment the stop happens, which is far more accurate than reconstructing it hours later at end of shift.
Will operators see this as extra surveillance rather than a helpful tool?
That concern is common and worth taking seriously. In practice, automated tracking tends to reduce friction for operators because it removes the burden of manual logging rather than adding to it — the system captures what happened automatically, and operators spend less time writing things down and more time actually running the line.
How much data does this generate, and can our systems handle it?
Event-based logging, where a record is created only when a state actually changes, keeps data volume manageable even at high stop frequency. This is a fundamentally different approach than continuous high-frequency sensor logging, and most existing network and storage infrastructure handles it without additional investment.
How quickly can we get automated tracking running on a pilot line?
Most single-line pilots, using signals already available in the existing PLC, can be configured and generating usable downtime data within two to four weeks. Expanding to additional lines typically moves faster once the reason code taxonomy and dashboard structure are established from the first line. To scope a timeline for your specific equipment, book a 30-minute assessment.
Stop Estimating Downtime. Start Measuring It.
iFactory pulls stop and start events directly from your existing PLC and sensor signals, capturing every loss automatically and feeding it straight into real-time dashboards and Pareto analysis — no paper log, no end-of-shift guesswork.