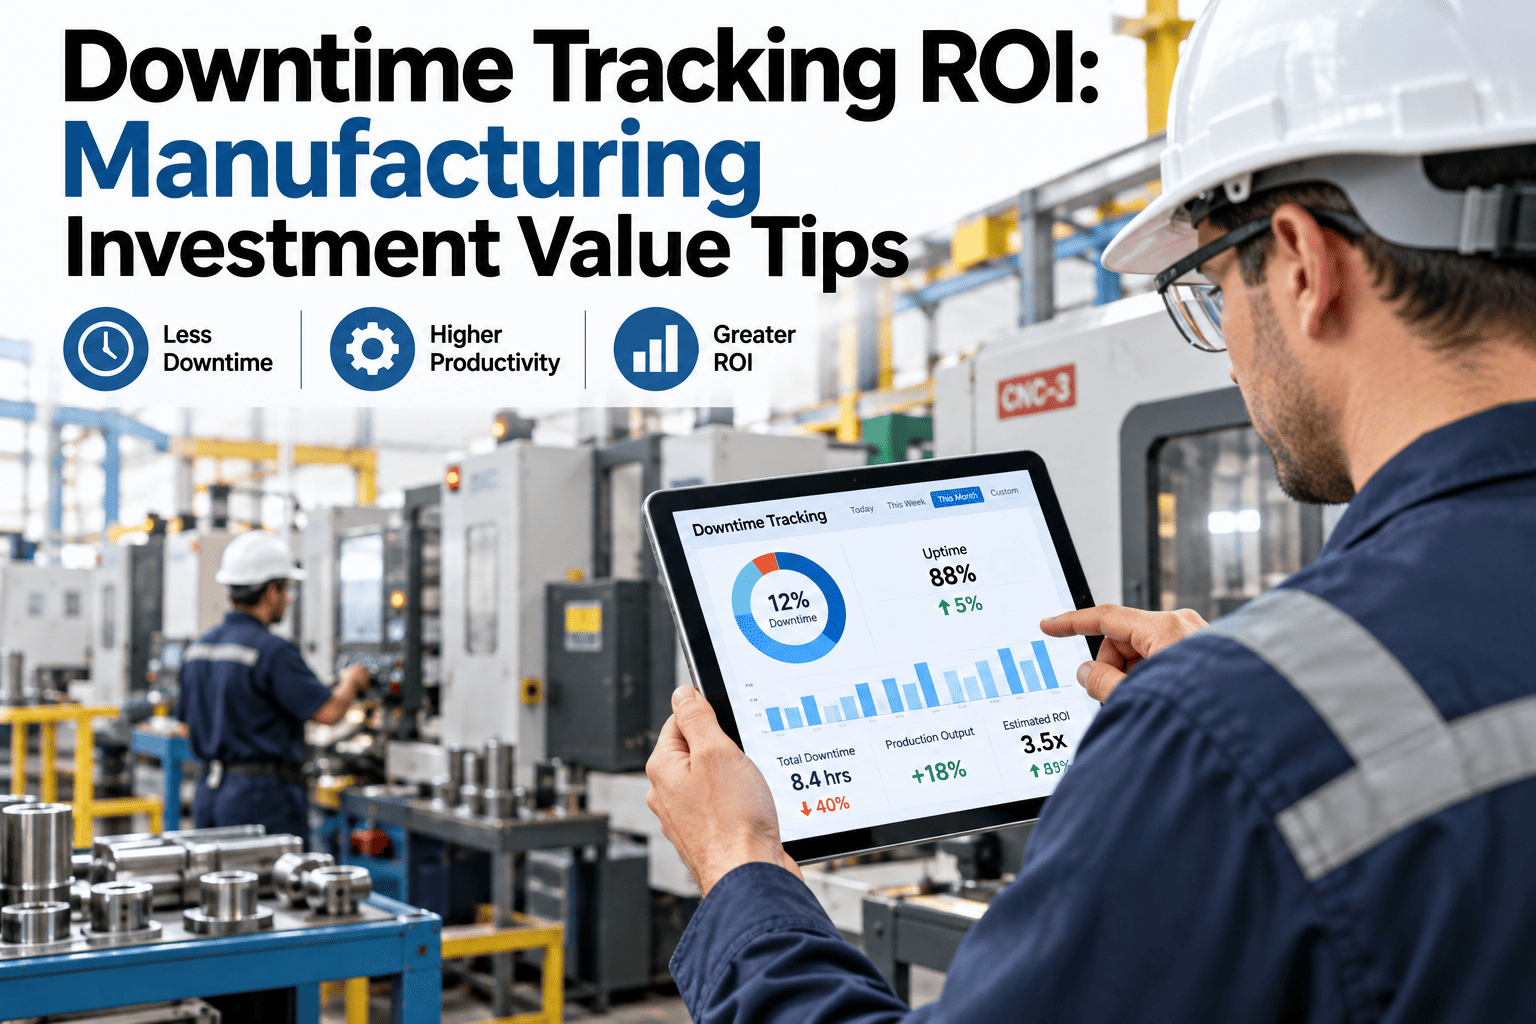
Every plant tracks downtime in some form — a whiteboard, a spreadsheet, a legacy MES module nobody trusts completely. The question that decides whether to invest in a proper automated downtime tracking system isn't whether downtime matters, everyone agrees it does, but whether the investment actually pays back faster and more reliably than the informal system already in place. Reliability and operations leaders building that case can Book a Demo to walk through an ROI model built around their own current tracking gaps.
Why Manual Downtime Tracking Costs More Than It Looks
Manual and semi-manual downtime tracking — a supervisor filling in a spreadsheet at shift end, a whiteboard tally later transcribed into a report — carries hidden costs that rarely show up as a line item anywhere. Reason codes get entered inconsistently between shifts. Short stops get rounded or skipped entirely because nobody has time to log every brief interruption by hand. And by the time a downtime report reaches a decision-maker, the information is often days old, well past the point where it could have changed anything about how that shift was run.
Three Value Categories That Make Up Downtime Tracking ROI
The financial case for automated downtime tracking rests on three distinct value categories, and a proposal that only counts one of them tends to understate the real return. Availability improvement is the most direct and easiest to measure. Loss reduction captures the secondary value of catching recurring small losses that manual tracking systematically misses. Decision speed improvement is the hardest to quantify precisely but often the most operationally significant, since it changes how quickly a plant can respond to a developing problem rather than only measuring it after the fact.
Manual vs. Automated Tracking: A Direct Comparison
Laying manual and automated downtime tracking side by side clarifies where the real ROI opportunity concentrates, since the gap is rarely just about convenience — it's about the accuracy and timeliness of the data that everything else in a reliability program depends on.
| Factor | Manual Tracking | Automated Tracking |
|---|---|---|
| Short stop capture | Frequently missed or rounded | Captured consistently regardless of duration |
| Reason code consistency | Varies by shift and individual habit | Standardized across every shift and line |
| Reporting lag | Often a day or more behind real time | Near real-time visibility during the shift itself |
| Data usable for trend analysis | Limited by inconsistency and gaps | Reliable enough to support pattern detection over time |
Building the Calculation: What Numbers to Gather First
A credible ROI calculation starts with a small set of numbers most plants can pull together within a day or two, even without a formal downtime-cost model already in place. The goal at this stage is a defensible estimate, not a perfectly precise figure — a conservative number that finance can trust is more persuasive than an inflated one that invites scrutiny.
Common Mistakes That Undermine an Otherwise Solid ROI Case
Even a well-intentioned ROI proposal can lose credibility with finance if it leans on a few common shortcuts. Overstating detection improvement by assuming automated tracking will catch every conceivable loss immediately, rather than ramping up over the first several months, sets an expectation the actual rollout can't match. Blending every value category into a single headline number, rather than showing availability improvement, loss reduction, and decision speed separately, makes the case harder to audit and easier to dismiss. And comparing against an unrealistically poor manual baseline, rather than the plant's actual current tracking discipline, invites a reviewer to discount the whole proposal once the comparison is questioned.
Overstating Early Detection Gains
Assuming full detection improvement from month one instead of a realistic ramp-up curve as the system and team mature together.
Blending Value Categories Together
Presenting one combined savings figure instead of separate, auditable numbers for availability, loss reduction, and decision speed.
Using an Unrealistic Baseline
Comparing against a worst-case manual process instead of the plant's actual current tracking discipline and known gaps.
Frequently Asked Questions: Downtime Tracking ROI Calculation
How much downtime does manual tracking typically miss compared to an automated system?
The gap varies by plant and how disciplined the existing manual process already is, but short stops under a minute or two are the category most consistently underreported in manual systems, since they rarely feel significant enough for an operator to log by hand in real time even when the guidance says to. Comparing a short trial period of automated capture against the same period's manual log on one line is the most reliable way to quantify this gap for a specific plant. Teams can Book a Demo to review this comparison approach.
How quickly does decision speed improvement translate into a measurable financial benefit?
Decision speed value tends to show up gradually rather than as an immediate one-time gain — it's the cumulative effect of a supervisor catching and correcting a developing issue within the same shift dozens of times over a year, rather than discovering the pattern in a weekly report after several shifts have already been affected, so this category is best modeled as an ongoing rate of avoided small losses rather than a single upfront number.
What is a realistic payback period for an automated downtime tracking investment?
Payback periods vary with plant size and current tracking maturity, but plants moving from a largely manual process to automated tracking on critical lines commonly see payback within the first year, driven primarily by the availability improvement and loss reduction categories, with decision speed value continuing to accumulate benefit beyond that initial payback window.
Should the ROI model include the cost of the labor time currently spent on manual tracking?
Yes — the supervisor or operator time currently spent manually logging and transcribing downtime data is a real cost that automated tracking largely eliminates, and including it gives a more complete picture of total ROI, though this category is typically smaller than the availability and loss reduction benefits and shouldn't be relied on as the primary justification on its own.
How should a multi-line plant prioritize which lines get automated tracking first?
Prioritizing lines with the highest downtime cost per hour and the largest gap between logged and estimated actual downtime typically produces the fastest and most convincing initial ROI, giving a plant a strong result to reference when building the case for expanding automated tracking to the rest of the facility. Contact iFactory Support for help prioritizing an initial rollout across multiple lines.