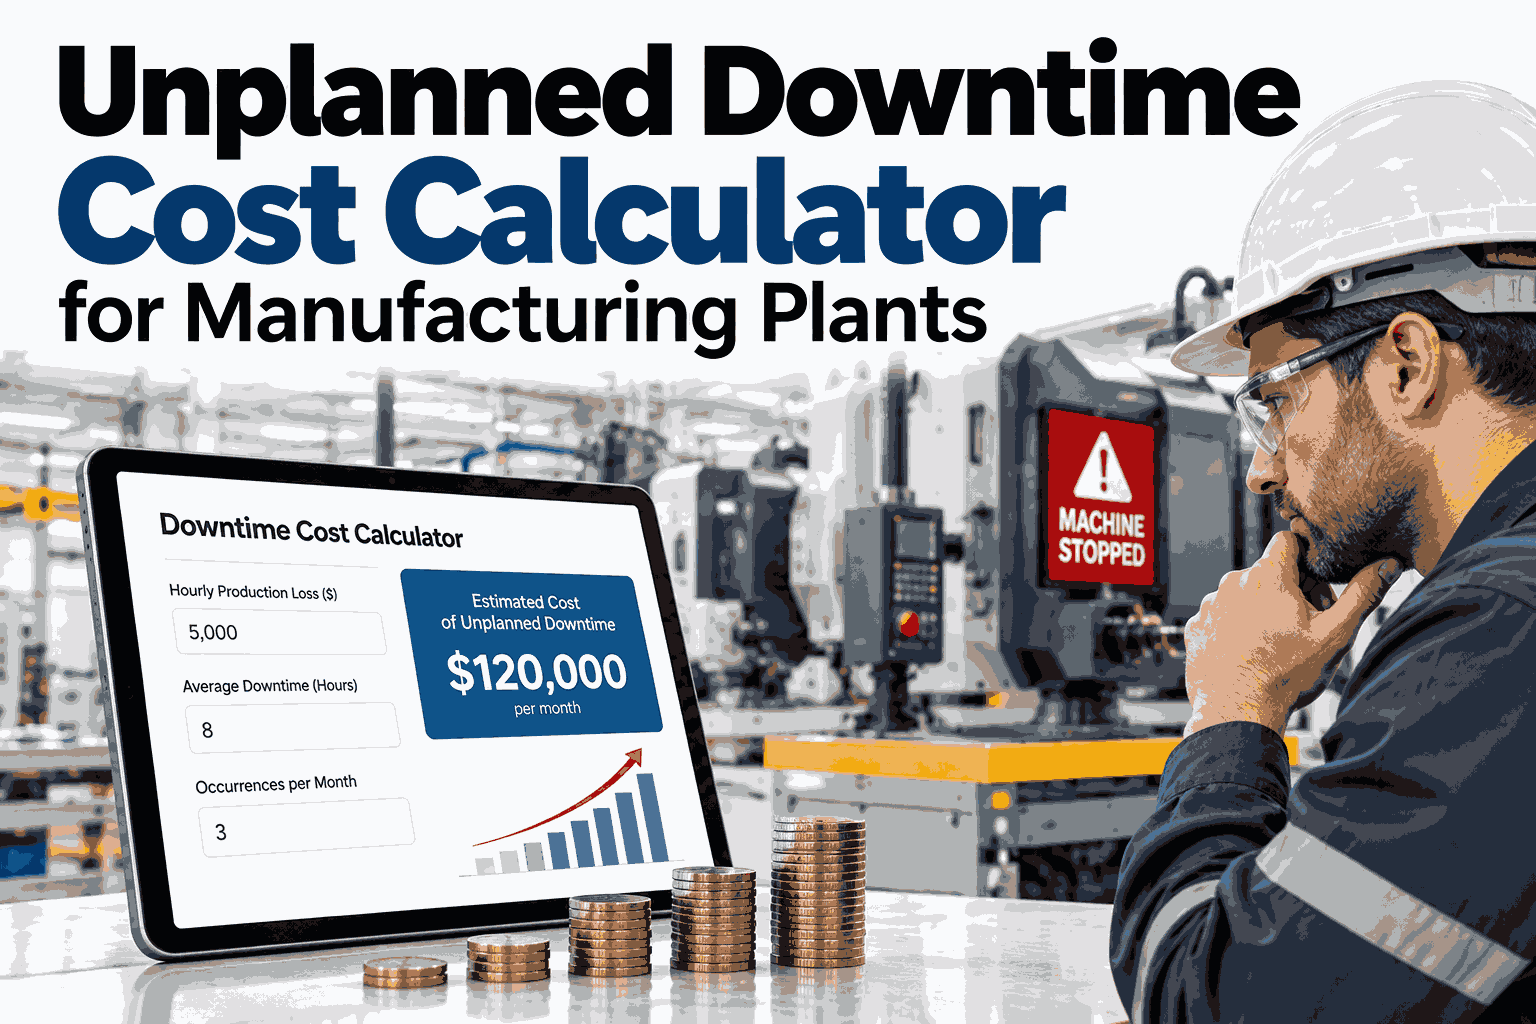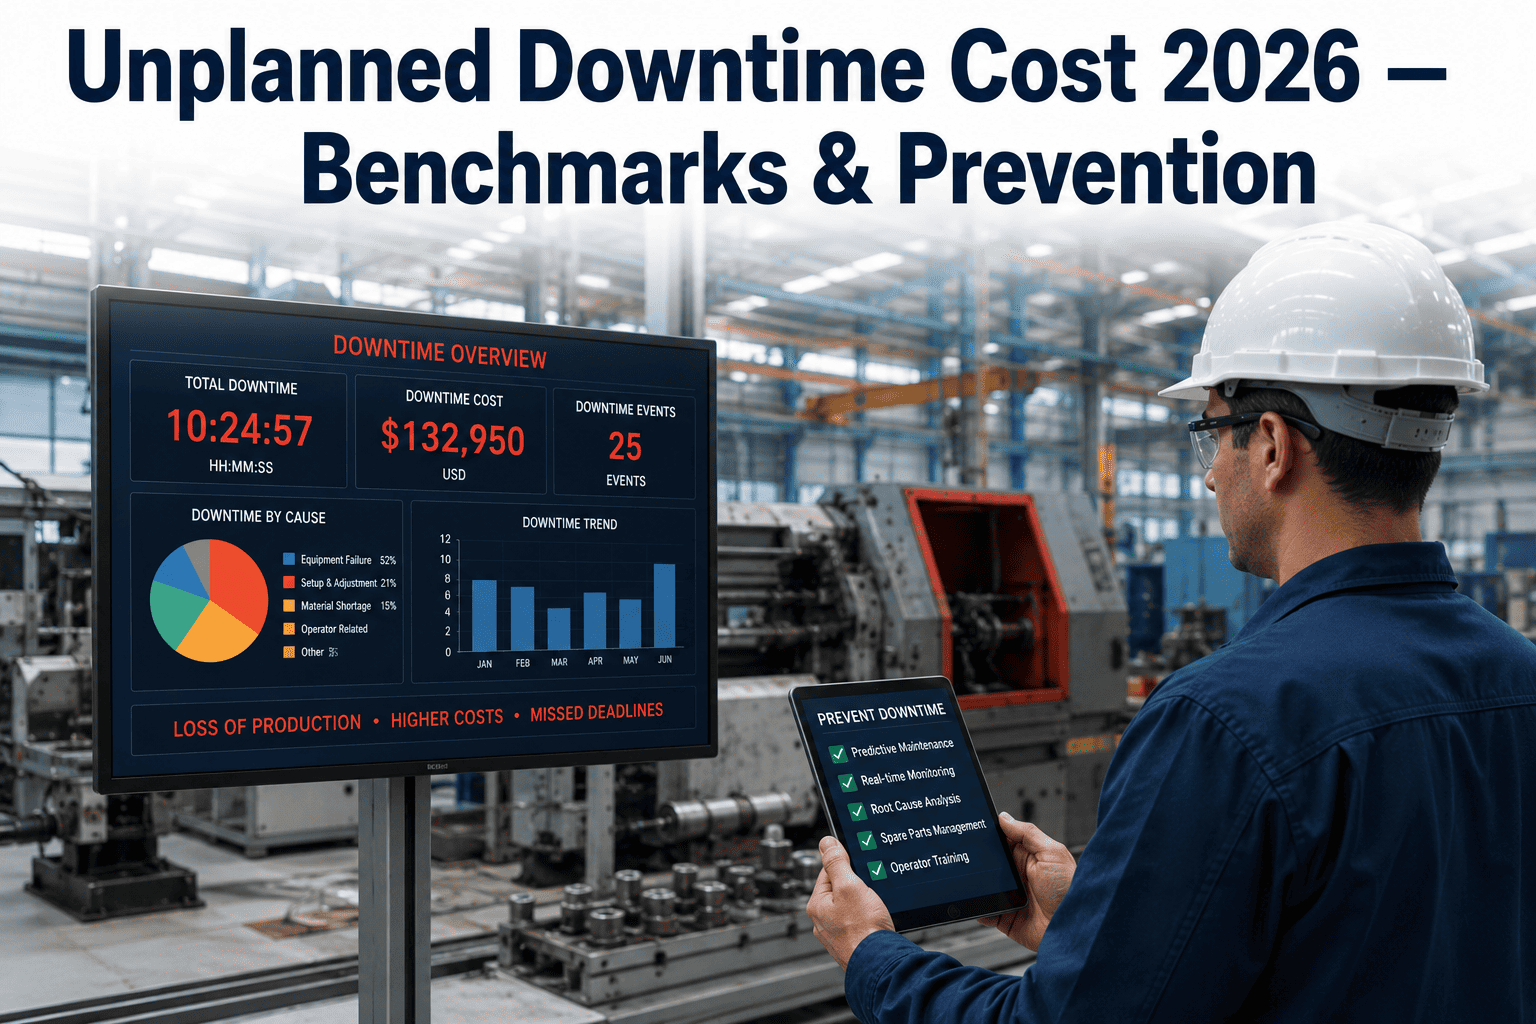
Unplanned downtime is one of the few manufacturing costs that most plants can name in general terms but rarely quantify precisely, and that gap in precision is itself expensive, because you cannot systematically reduce a cost you have not actually measured. Updated 2026 benchmarks put the average cost of unplanned downtime across manufacturing at roughly $125,000 per hour, a figure that spans everything from lost production and scrapped work-in-process to overtime labor and expedited freight to recover schedule. The plants closing this gap fastest are the ones pairing accurate downtime cost data with AI-driven prevention strategies, cutting unplanned downtime by 35 to 50% within the first year. To benchmark your own downtime cost, Book a Demo with iFactory's reliability analytics team.
Know What Downtime Actually Costs You — Then Cut It.
iFactory AI quantifies downtime cost by cause and predicts failure risk before it stops the line, giving reliability teams a prioritized action list instead of a reactive maintenance queue.
Why Most Plants Underestimate Their True Downtime Cost
When plant leaders are asked what an hour of downtime costs, the number that comes back is almost always the direct production loss calculation — units not made multiplied by margin per unit. That number, while accurate as far as it goes, systematically excludes the secondary costs that make downtime genuinely expensive: overtime premiums to recover schedule, expedited freight to meet customer commitments anyway, scrapped work-in-process that cannot be reworked, and the ripple effect on downstream operations waiting on the stalled station's output.
The updated 2026 benchmark of roughly $125,000 per hour reflects this fuller accounting, and it varies significantly by industry based on capital intensity and margin structure. Automotive assembly and semiconductor fabrication sit well above this average given their continuous, high-value output, while lower-volume discrete manufacturing sits below it — but in every sector, the fully loaded cost is consistently two to three times higher than the direct production loss figure most plants use internally.
Where the $125,000 Per Hour Actually Goes
Breaking the average downtime cost into its components shows why prevention delivers more value than most plants initially estimate.
The Four Categories Behind Most Unplanned Downtime Events
Bearing wear, motor failure, and unplanned component breakdown remain the single largest downtime category across most manufacturing sectors.
Extended or poorly executed changeovers between product runs consume far more time than the changeover procedure itself should require.
Line stops waiting on raw material or component supply represent a planning and visibility gap as much as a supply chain issue.
Incorrect setup or procedural deviation contributes a smaller but persistent share of downtime, often tied to training gaps on newer equipment.
The Two Metrics That Actually Predict Downtime Cost Trajectory
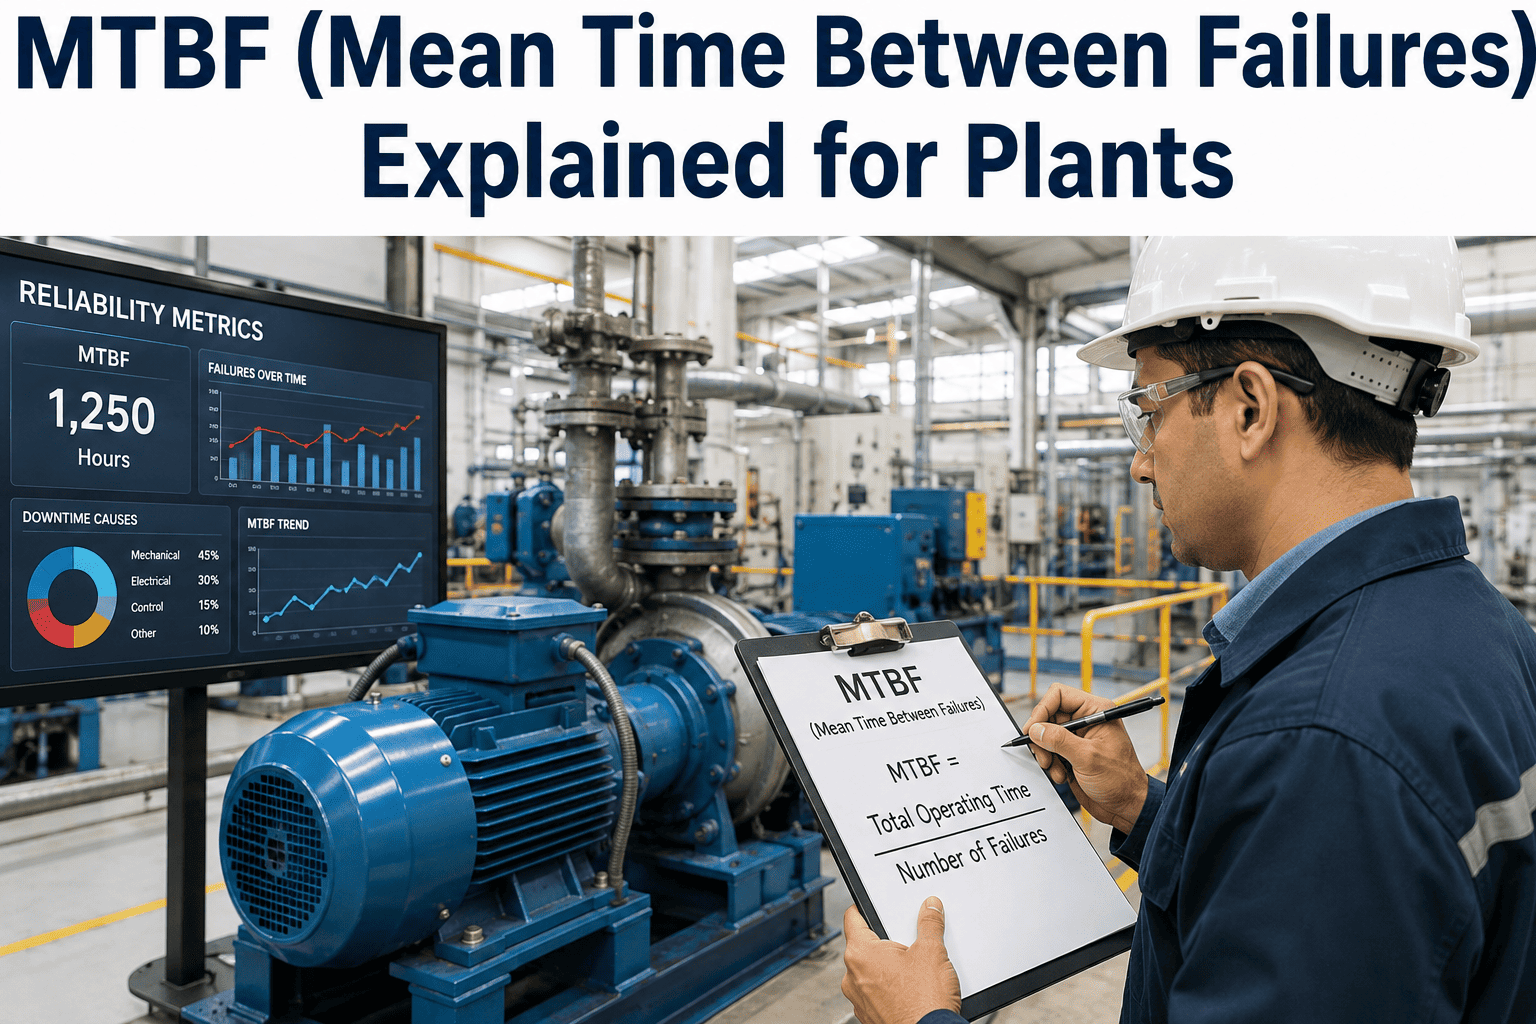
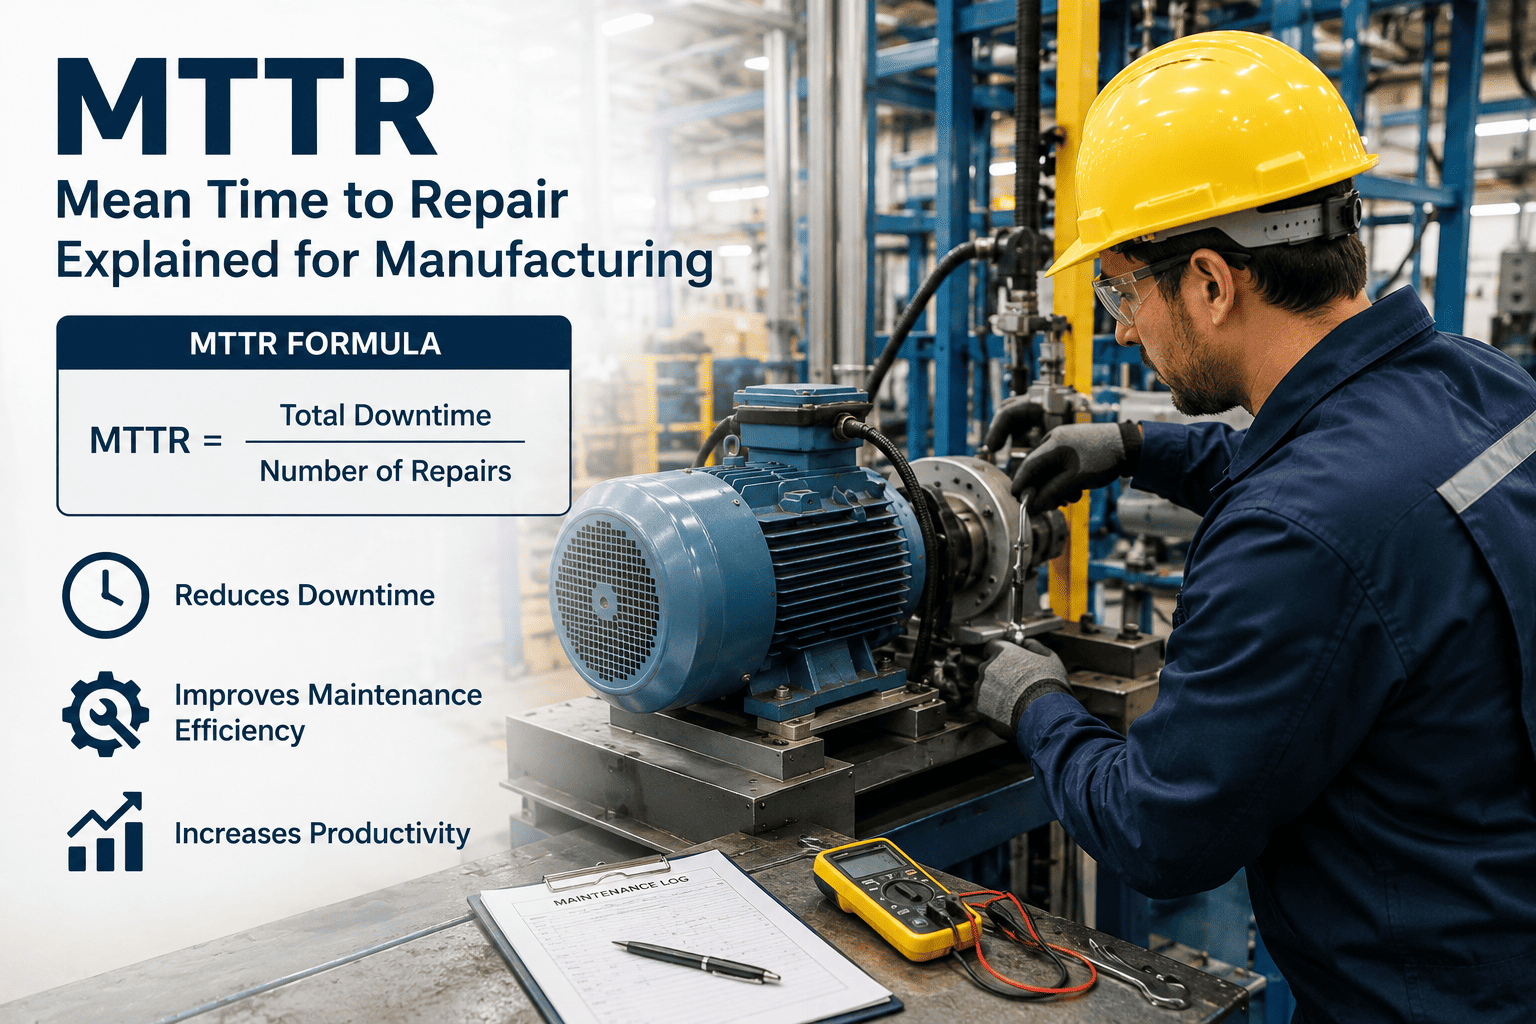
Mean time between failures and mean time to repair together determine whether a plant's downtime cost is trending up or down over time, yet many reliability programs track one without the other.
| Metric | What It Measures | AI's Role in Improving It |
|---|---|---|
| MTBF | Reliability between failures | Predictive failure detection extends interval |
| MTTR | Speed of failure recovery | Root-cause diagnosis accelerates repair |
| Availability Loss | Combined production impact | Prioritizes highest-cost failure modes first |
How AI-Driven Prevention Cuts Downtime by 35 to 50%
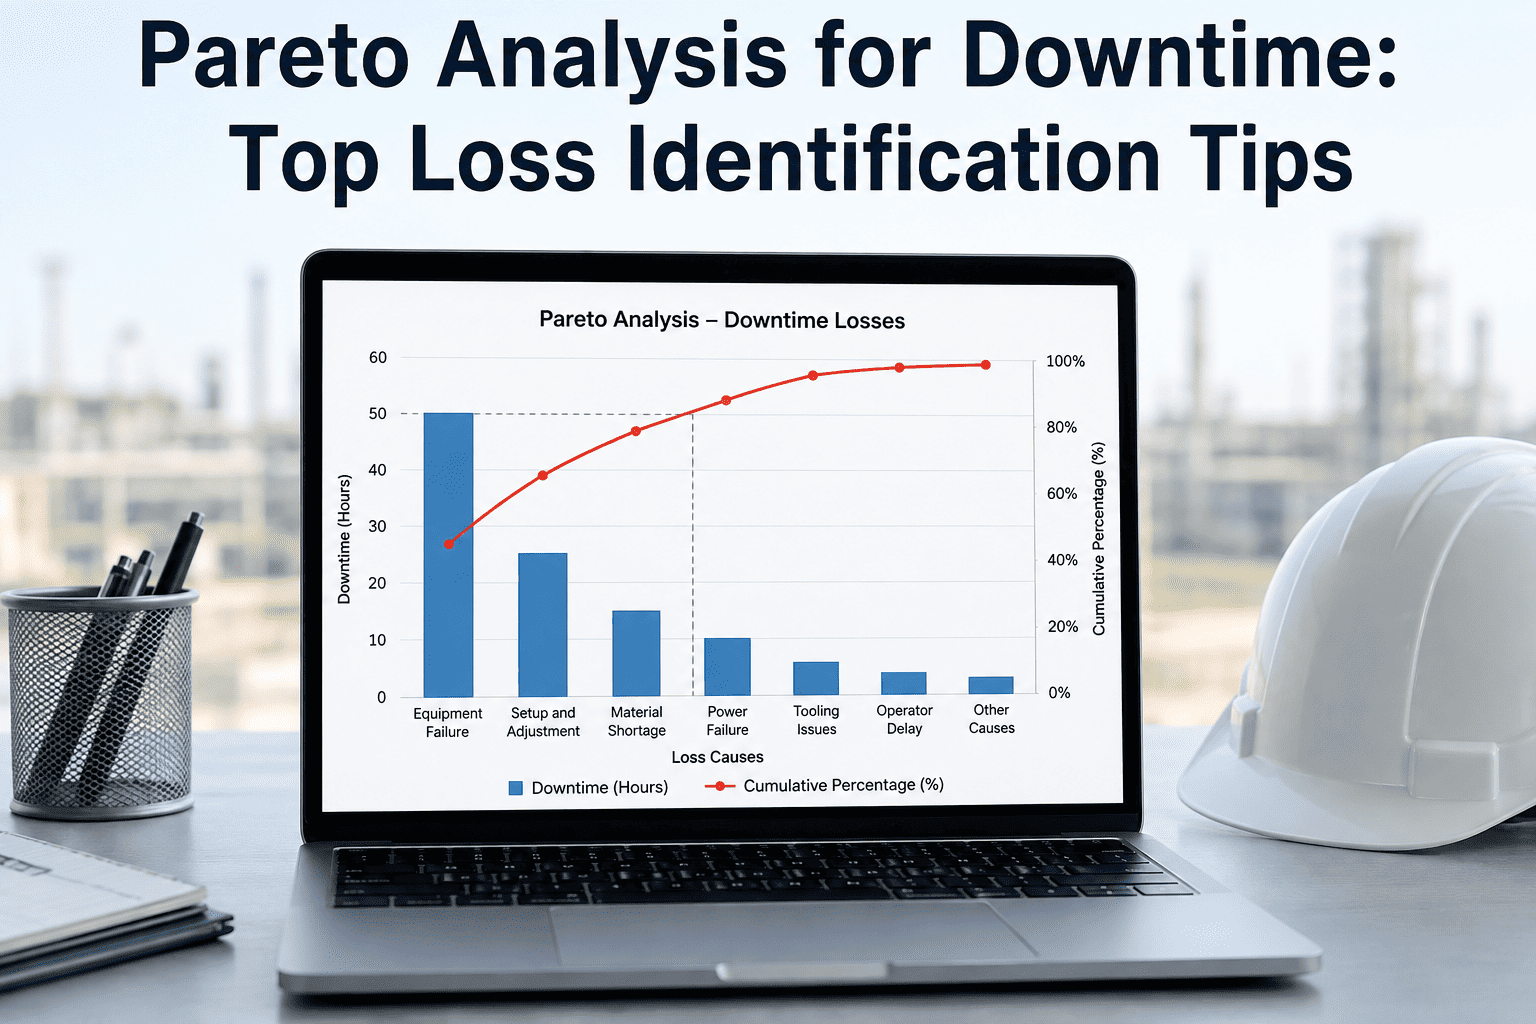
Downtime cost quantification — every stoppage is tagged with its full cost impact, not just duration, building an accurate Pareto of what actually matters most.
Predictive failure modeling — vibration, temperature, and current signature data are monitored continuously to flag failure risk before a breakdown occurs.
Prioritized maintenance action — maintenance teams work from a risk-ranked list rather than a fixed calendar schedule, addressing the highest-cost risks first.
Continuous benchmark tracking — downtime cost trends are tracked against industry benchmarks to validate that prevention investment is translating into measurable savings.
Why the Planned-to-Unplanned Ratio Matters More Than Total Downtime
Two plants can report identical total downtime hours and be in very different positions. A plant where most downtime is planned maintenance executed on a controlled schedule has a fundamentally more manageable cost structure than one where the same total hours are dominated by unplanned, unscheduled failures that disrupt production planning and customer commitments unpredictably.
The most effective reliability programs track this ratio explicitly as a leading indicator, since a shifting ratio toward more planned downtime — even before total downtime hours drop significantly — signals that predictive prevention is working and that the remaining unplanned events are becoming rarer and more isolated rather than routine.
Unplanned Downtime Cost — Frequently Asked Questions
How is the $125,000 per hour benchmark calculated?
The figure reflects a fully loaded cost model across surveyed manufacturing sectors, combining lost production value, labor and overtime costs, scrap and rework, and expedited logistics incurred to recover schedule after a stoppage, rather than direct production loss alone.
Does this benchmark apply equally across all manufacturing sectors?
No, the average masks significant variation. Capital-intensive, high-margin sectors like automotive and semiconductor fabrication typically see costs well above this average, while lower-volume discrete manufacturing often sees costs below it. Your specific cost depends heavily on your margin structure and line capacity.
How quickly can predictive maintenance reduce unplanned downtime?
Most plants see measurable improvement within the first two to three months as the model identifies the highest-risk failure modes, with the full 35 to 50% reduction range typically achieved within nine to twelve months as predictive coverage expands across critical assets.
Do we need new sensors installed to start tracking downtime cost accurately?
Basic downtime cost tracking can often start with existing production and labor data. Predictive failure detection benefits from added vibration or thermal sensors on critical assets, which our support team can help prioritize based on your highest-cost failure history.
What's the difference between tracking OEE availability loss and tracking downtime cost directly?
OEE availability loss measures time impact as a percentage, which is useful for operational comparison but doesn't communicate financial urgency. Tracking downtime cost directly in dollars gives plant leadership a clearer basis for prioritizing capital and maintenance investment decisions. A Book a Demo session can show both views side by side for your operation.
Find Out What Your Downtime Actually Costs.
Book a session with iFactory to benchmark your fully loaded downtime cost against 2026 industry data and identify your highest-priority prevention targets.