Your factory is running. But is it running well enough Most manufacturing leaders assume they're performing close to industry standard until they measure. Data from 3,500+ machines across 50 countries reveals that the average manufacturing plant operates at just 55–60% OEE leaving nearly half of its productive capacity on the table. That gap between where you are,and where you could be represents millions in unrealized revenue every year. Book a free OEE assessment to find out exactly where your factory stands.
Manufacturing OEE & Downtime Benchmarks
Industry-Specific Performance Data to Measure, Compare & Improve
Where Does Your Factory Fall?
OEE measures how effectively your equipment turns scheduled time into quality output. Here's the performance spectrum based on global data.
World-class OEE (85%+) requires 90% Availability, 95% Performance, and 99.9% Quality simultaneously. Even 90% on each factor yields only 73% OEE. Only 6% of global manufacturers consistently achieve world-class status.
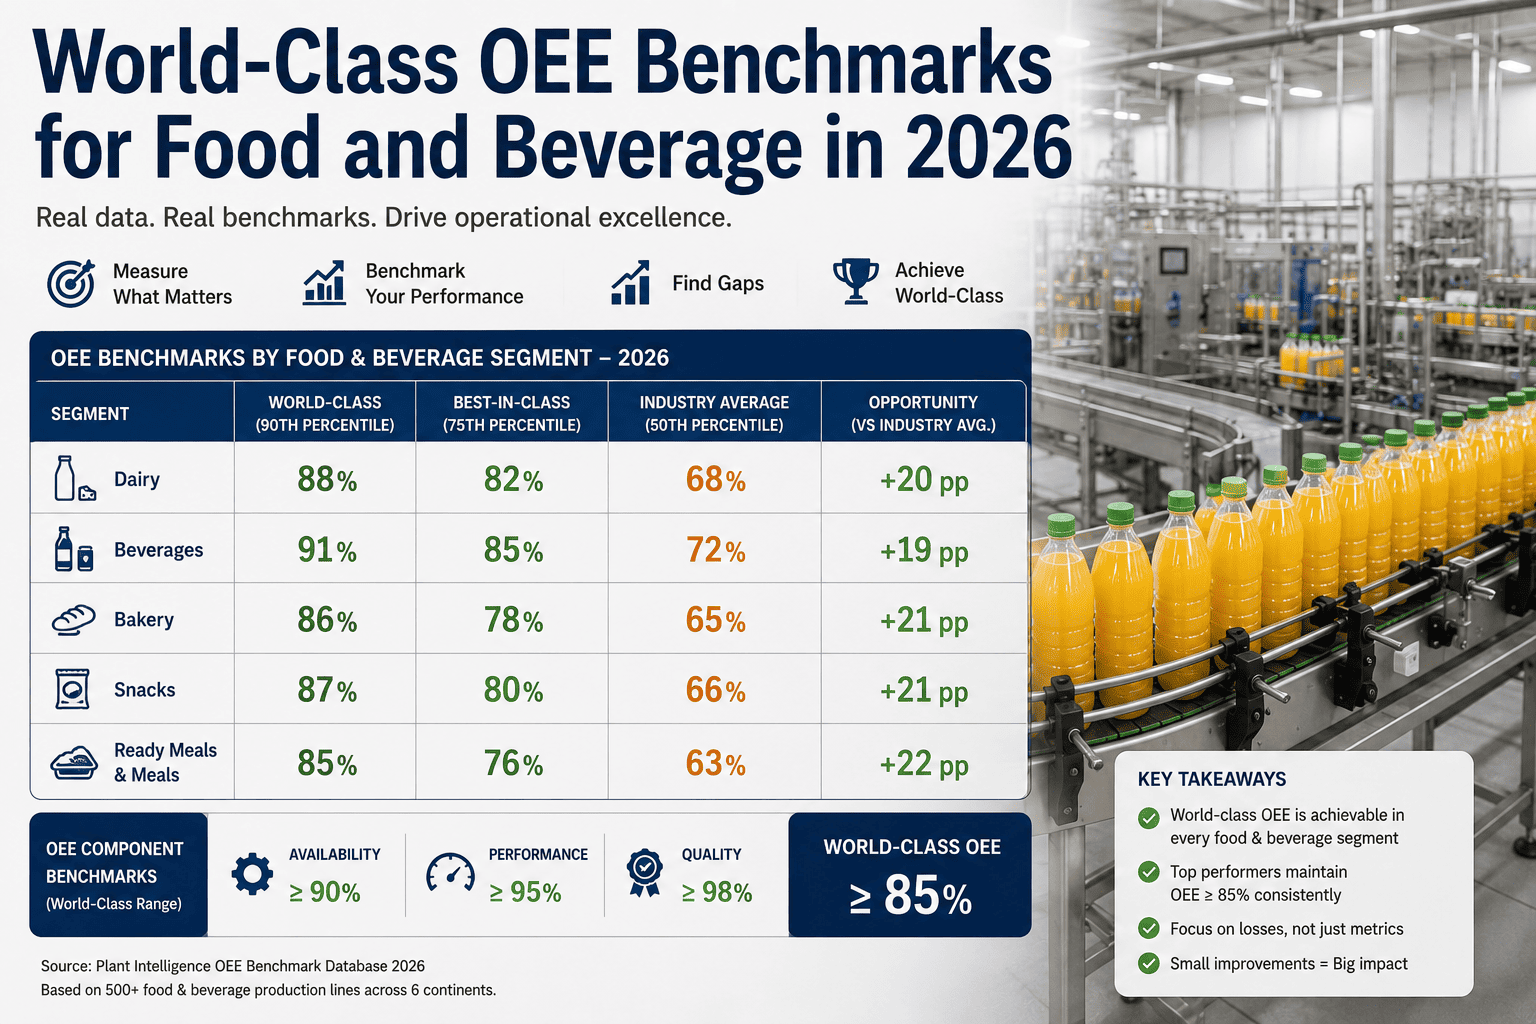
OEE Benchmarks by Manufacturing Sector
Performance varies significantly by industry. Compare your sector against global averages.
Not sure where your plant ranks? Schedule a free benchmarking session with our team.
The Three Multipliers Behind Your Score
OEE = Availability x Performance x Quality. Each component reveals a different type of loss — and a different opportunity.
Availability
World-Class Target: 90%Measures the percentage of scheduled time your equipment is actually running. Every unplanned stop, breakdown, changeover, and material shortage reduces this score.
Performance
World-Class Target: 95%Compares actual production speed to the maximum designed speed. Slow cycles, micro-stops, and operator hesitation drag this number down without triggering alarms.
Quality
World-Class Target: 99.9%The ratio of good parts to total parts produced. Startup rejects, in-process defects, and rework all eat into your quality score and your margins.
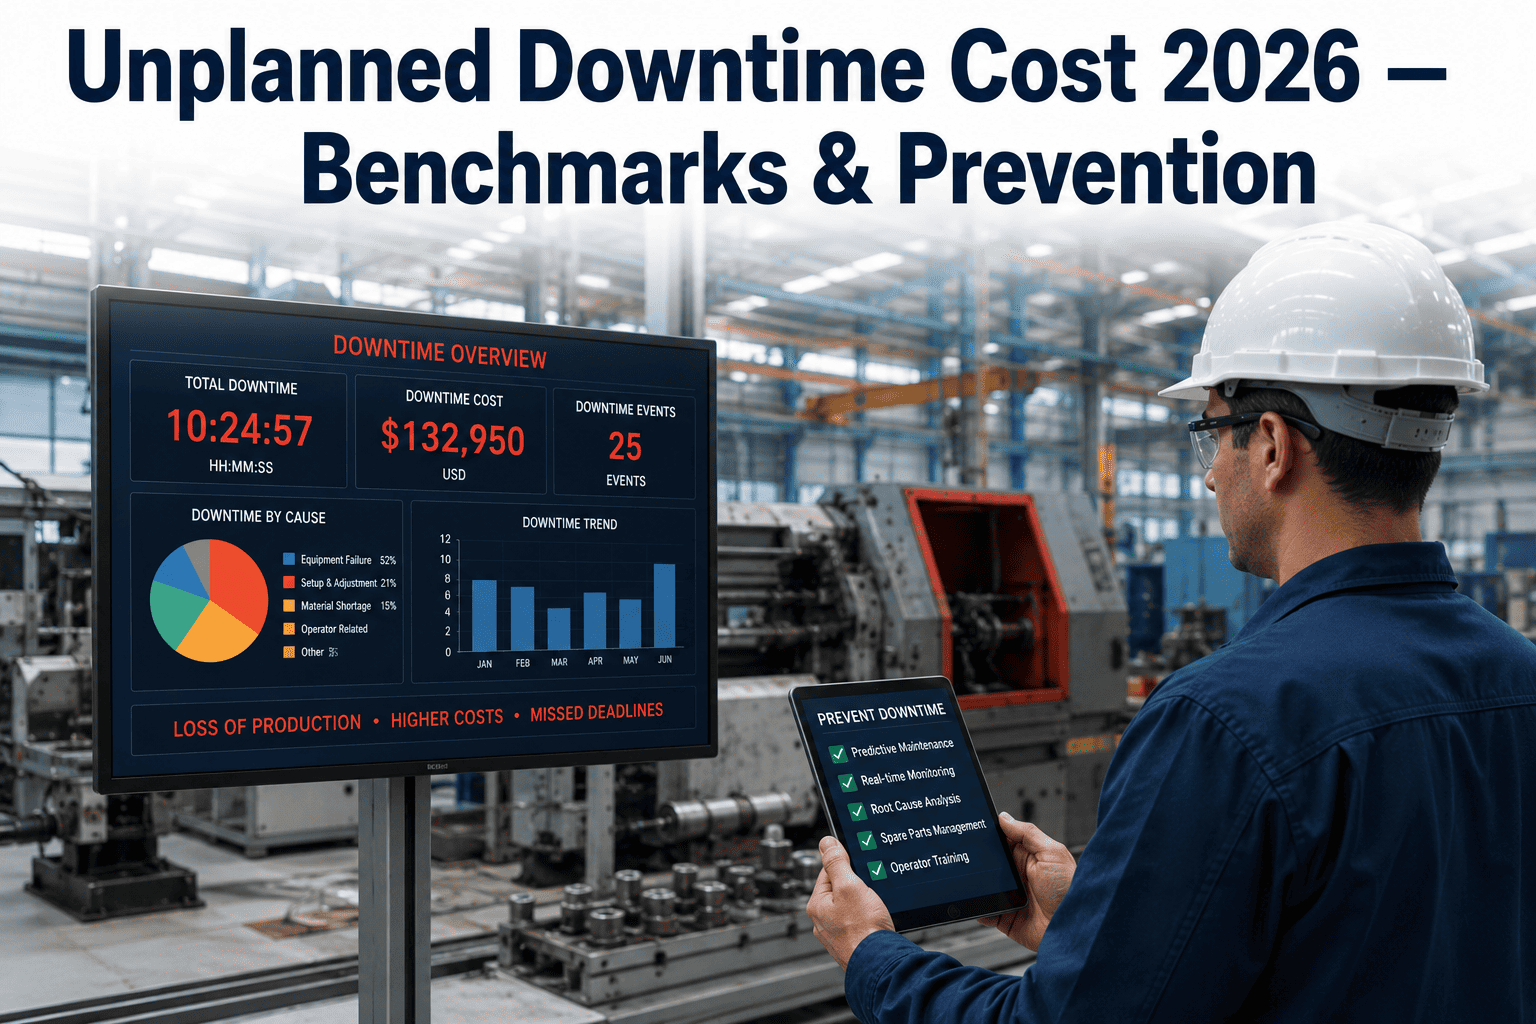
What Every Hour of Downtime Actually Costs
Unplanned downtime costs have risen 32% in the last seven years. Here's the damage by sector.
Just-in-time production means a single stalled line idles thousands of workers and robots downstream.
Harsh environments and safety regulations extend recovery time and compound financial impact.
Batch losses, revalidation requirements, and compliance penalties multiply the cost of every stoppage.
The industry average including idle labor, wasted materials, missed shipments, and penalty clauses.
Lower per-hour cost but extremely high frequency — hundreds of micro-stops per shift add up fast.
Perishable materials and sanitation requirements mean downtime also causes product waste and spoilage.
The Six Big Losses Dragging Your OEE Down
Every OEE point you're missing traces back to one of these six loss categories.
Equipment Breakdowns
Unplanned stops from failures. The #1 OEE killer — accounts for 34.2% of all efficiency losses.
Setup & Changeovers
Time lost switching between products. Contributes 28.7% of losses in make-to-order environments.
Small Stops
Brief interruptions under 5 minutes — often unrecorded but cumulatively devastating to throughput.
Reduced Speed
Equipment running below designed capacity due to wear, operator caution, or process constraints.
Startup Defects
Rejects produced during warmup, calibration, or after changeovers before stable production begins.
In-Process Defects
Parts that fail inspection during normal production — rework, scrap, and warranty costs combined.
Struggling to pinpoint which losses hit your bottom line hardest? Talk to our team — we'll help you identify and prioritize your biggest improvement opportunities.
Know Your Score. Close the Gap.
iFactory gives you real-time OEE tracking, automated downtime logging, and root-cause analytics — so you stop guessing and start improving.
How Top Manufacturers Close the OEE Gap
Measure automatically — replace clipboard data collection with IoT sensors and real-time OEE dashboards to eliminate data lag and human error
Attack the biggest loss first — identify whether Availability, Performance, or Quality is your primary constraint, then focus resources there
Shift from reactive to predictive — predictive maintenance reduces downtime by 30–50% and cuts maintenance costs 18–25% (McKinsey)
Reduce changeover time — apply SMED methodology to cut setup times by 40–60%, directly boosting Availability scores
Track micro-stops — small stops under 5 minutes are invisible to manual tracking but can steal 10–15% of your Performance score
Benchmark against your own baseline — compare shift-to-shift and line-to-line, not just against industry averages. Internal gaps reveal immediate wins
What a 10-Point OEE Improvement Delivers
Even modest OEE gains create outsized financial returns. Here's what manufacturers report after implementing digital OEE systems.
Predictive maintenance and real-time alerts catch failures 48–72 hours before they happen, keeping lines running.
Condition-based maintenance replaces both wasteful calendar schedules and costly emergency repairs.
Better scheduling, bottleneck identification, and reduced stoppages produce more from existing equipment.
Digital transformation in manufacturing delivers 3x return within three years of implementation on average.
After implementing real-time OEE tracking, we discovered our actual OEE was 52% — not the 78% we'd been reporting manually. Within 18 months of acting on accurate data, we reached 84% and saved over $2M in prevented downtime.
Frequently Asked Questions
Quick answers for manufacturing leaders exploring OEE benchmarks and improvement strategies.
What is a good OEE score for my industry?
It depends on your sector. Electronics manufacturers typically achieve 80–88%, while pharmaceuticals average 35–60% due to structural constraints like cleaning and validation. The global manufacturing average is 55–60%. Focus on improving from your own baseline rather than chasing a universal number.
Why is world-class OEE so hard to achieve?
Because OEE is a product of three percentages. Even 90% Availability x 90% Performance x 90% Quality = only 73% OEE. Reaching 85%+ requires near-perfect execution across all three dimensions simultaneously. Only about 6% of manufacturers globally sustain it.
How do I start measuring OEE accurately?
Start by connecting sensors to your most critical equipment for automated data capture. Manual tracking consistently overstates OEE by 15–25% because small stops and speed losses go unrecorded. A digital OEE system like iFactory captures every second automatically. Schedule a demo to see it in action.
What's the fastest way to improve OEE?
Identify your single biggest loss category — usually unplanned downtime — and attack it first. Manufacturers who implement predictive maintenance on their most failure-prone equipment typically see a 10–15% OEE improvement within the first few months.
How much does downtime actually cost?
It varies enormously by industry — from $2.3M/hour in automotive to $30K/hour in food production. Across all manufacturing, unplanned downtime costs the world's largest companies $1.4 trillion annually. Even small plants with $50K in annual downtime losses benefit significantly from prevention.
Can small manufacturers benefit from OEE tracking?
Absolutely. Small and mid-size manufacturers are the fastest-growing segment of CMMS and OEE software adoption. Cloud-based platforms have lowered entry costs dramatically. A small plant with 10 machines benefits proportionally just as much as a Fortune 500 factory. Talk to our team about flexible plans.
Ready to Close Your OEE Gap?
iFactory gives you real-time OEE visibility, automated downtime tracking, and actionable analytics to move from average to world-class.