AI SPC Control Charts for Automotive — Real-Time Cpk | iFactory Ai
By Larry Eilson on June 2, 2026
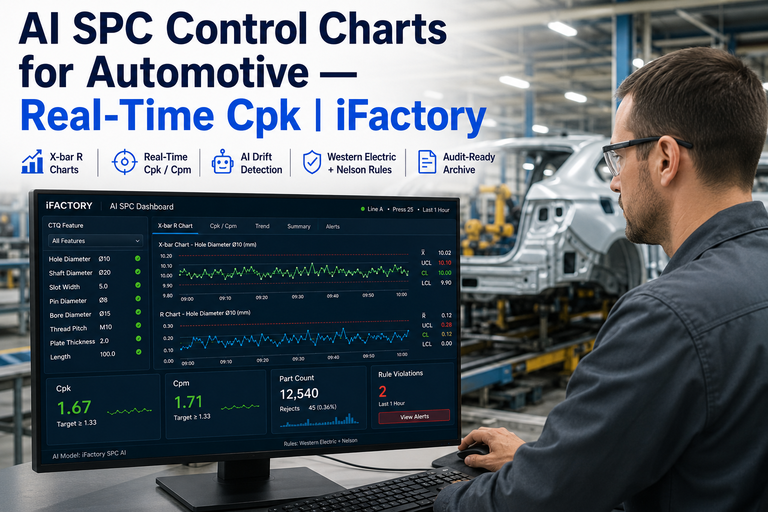
For an automotive Tier 1 supplier, the Cpk number is not paperwork — it is the difference between keeping the program and losing it. A line running at Cpk 0.9 is mathematically producing 2.7% defective parts no matter how hard the inspectors work, and IATF 16949 customers increasingly demand 1.67 on critical characteristics. Yet at most suppliers, Cpk is calculated once for the PPAP submission and then filed away, while the actual process drifts unmonitored until a failed part comes off the end of the line. That is detection mode, not prevention. The real power of a control chart is spotting the trend and intervening before a single nonconforming part is made. iFactory's AI SPC does exactly that: it auto-detects every critical-to-quality feature, builds the X-bar R, Cpk, and Cpm charts automatically, evaluates all eight Western Electric and four Nelson rules on every sample, and keeps an audit-ready archive. A real-time SPC platform turns capability from a filed report into a live vital sign.
iFactory AI SPC
AI SPC Control Charts for Automotive — Real-Time Cpk
Auto-built X-bar R, Cpk, and Cpm charts for every CTQ feature, with live drift detection on all Western Electric and Nelson rules and an audit-ready archive — on-prem AI, live in 6 to 12 weeks.
Pass/fail inspection tells you whether a unit meets spec. SPC tells you whether the process producing those units is capable — the only metric that scales. The gap between the two is where Tier 1 suppliers bleed margin and risk programs: a periodic capability study and end-of-line sorting catch problems after the bad parts exist, while a live, rule-monitored chart catches the drift that precedes them. The difference between a plant scrapping 8% and one scrapping 0.1% is knowing exactly where every critical parameter sits, in real time.
Periodic SPC + Sorting
React After the Bad Part Exists
Cpk calculated once for PPAP, then filed and forgotten
Manual charts updated late, rules checked inconsistently by hand
Drift spotted only after a nonconforming part reaches the line end
Audit scramble to reconstruct what the process was doing and when
AI SPC, Real-Time
Intervene Before It's Made
Cpk and Cpm computed continuously, sample by sample
All 8 Western Electric + 4 Nelson rules evaluated on every point
Alert fires the moment a rule trips, before the next sample
Every chart and violation archived, audit-ready for IATF 16949
The Capability Ladder — Where Your Process Sits
Cpk is the vital sign, and small movements on the ladder are enormous in defect terms. These are the exact parts-per-million rates from the statistical tables, not projections. Moving a process from Cpk 1.0 to 1.67 cuts the defect rate roughly 4,500-fold — which is precisely why automotive customers hold critical characteristics to 1.67.
Cpk to Defect Rate — the Automotive Targets
Bar height is defect rate, not capability — taller is worse. The whole point of live SPC is to keep every CTQ on the short end of this ladder, continuously.
The Live Chart, Watched Every Sample
At the heart of the platform is the control chart you already know — but rendered live, with the ±1σ, ±2σ, and ±3σ zones the rules watch, and every new point evaluated against all twelve rules the instant it lands. When a rule trips, the point goes red and an alert fires before the next sample is even taken.
X-bar Chart with Western Electric Zones — Live Rule Evaluation
In control — points random within ±3σ, process stable
Rule violation — flagged red, alert fired before the next sample
Every Rule, Every Chart, Auto-Built
The platform does the statistical heavy lifting that usually eats a quality engineer's week. It detects the CTQ features from the control plan, picks the right chart type, calculates limits from sufficient subgroups, and runs the full rule set continuously — so the engineer reviews signals instead of building charts.
CTQ Auto-Detection
Identifies the critical-to-quality characteristics from the control plan and stands up a chart for each — no manual chart-by-chart setup.
Right Chart, Auto-Picked
X-bar R and X-bar S for subgrouped data, Individual-MR for single readings, with limits from sufficient rational subgroups.
Cpk + Cpm Live
Capability and the Taguchi Cpm index computed continuously, alerting the moment a CTQ falls below its target.
12 Rules Every Point
All eight Western Electric and four Nelson rules evaluated on every sample, with configurable severity and alert routing.
Direct Data Feeds
Pulls measurements straight from CNC, CMM, vision systems, and PLCs — no manual transcription, no caliper-error noise.
Audit-Ready Archive
Every chart, violation, and reaction logged and retained for IATF 16949 and 21 CFR Part 11 — reconstruct any period on demand.
Want to see your own CTQ features auto-charted with live Cpk and rule detection? Book a 30-minute walkthrough and we'll run it on your measurement data.
Why AI, Not Just Shewhart
Traditional Shewhart charts and the classic rules are necessary for compliance — but AI adds speed and foresight on top. The platform runs both in parallel: the textbook charts for the audit, and AI methods that catch sub-sigma drift and cross-parameter patterns far earlier than rules alone.
Sub-Sigma Drift
AI detects drift below the threshold the classic rules fire on, catching problems 10 to 50 times faster than Shewhart charts alone.
Cross-Parameter Correlation
Sees relationships between CTQs that single-chart monitoring misses — a shift in one feature predicting trouble in another.
Virtual Metrology
Predicts a likely measurement before the gauge reads it, flagging a forming problem even earlier in the cycle.
Compliance in Parallel
Classic WE and Nelson rules run alongside AI for the audit trail — you get speed without giving up the textbook evidence.
How It Deploys
The platform runs on-premise, inside the plant, pulling from the equipment you already have and keeping CTQ and program data local. Deployment follows the standard iFactory path — connected, validated against known data, and live in weeks.
From Measurement to Monitored Capability
1
Connect
Pull Data
Feed CNC, CMM, vision, and PLC measurements in, no transcription
2
Detect
Find CTQs
Auto-identify critical features and stand up the right chart for each
3
Monitor
Live Rules
Cpk, Cpm, and all 12 rules evaluated on every sample, alerting on drift
4
Prove
Archive
Audit-ready record of every chart, signal, and reaction for IATF 16949
What Real-Time SPC Delivers
The return on live AI SPC for a Tier 1 supplier is measured in scrap avoided, programs protected, and audits passed without a scramble. These figures come from SPC capability tables and automotive quality deployments.
4,500x
Defect reduction
moving a process from Cpk 1.0 to 1.67
10-50x
Faster drift catch
AI methods vs Shewhart charts alone
12
Rules, every sample
all Western Electric and Nelson tests, automatically
Audit
Ready by design
IATF 16949 and 21 CFR Part 11 archive, always current
Every program protected starts with monitoring capability live instead of filing it after PPAP. Want it scoped to your CTQs and customer requirements? Talk to our quality engineers.
Frequently Asked Questions
Does it run all the Western Electric and Nelson rules?
Yes — all eight Western Electric rules plus the four additional Nelson rules are evaluated on every chart, on every sample, with configurable severity and alert routing. The moment a rule trips, the offending point is flagged and an alert fires before the next sample is taken, so a forming trend is caught while you can still act on it rather than after a nonconforming part is made.
What's the difference between Cpk and Cpm, and why both?
Cpk measures capability adjusted for how centered the process is relative to the spec limits. Cpm, the Taguchi index, additionally penalizes deviation from the target value, not just the spec window — so it rewards being on-target, which matters for CTQ features where nominal performance counts. Reporting both gives a fuller picture of capability, and the platform computes each continuously rather than once at PPAP.
Is it audit-ready for IATF 16949?
Yes. Every control chart, capability calculation, rule violation, and operator reaction is logged and retained, so you can reconstruct exactly what any CTQ process was doing at any point in time — which is what an IATF 16949 audit asks for. The same archive supports FDA 21 CFR Part 11 environments. It replaces the audit scramble with an always-current record.
How does it know which features to chart?
It auto-detects the critical-to-quality characteristics from your control plan and stands up the appropriate chart for each — X-bar R or X-bar S for subgrouped data, Individual-MR for single readings — with control limits calculated from sufficient rational subgroups. That removes the manual, chart-by-chart setup that usually limits how many features a team can actually monitor, so coverage isn't constrained by engineering hours.
Where does the measurement data come from?
Directly from the equipment — CNC controllers, CMMs, vision systems, and PLCs feed measurements straight into the platform, with no manual transcription. That matters beyond convenience: hand-keying caliper readings introduces measurement error that can swamp the real part variation, so direct feeds keep the SPC data clean. A validated measurement system, via Gage R&R, remains the foundation underneath it.
Stop Filing Cpk. Start Watching It.
See AI SPC on Your CTQ Features — in 30 Minutes
Bring a critical characteristic and its measurement data. We'll auto-detect the CTQ, build the X-bar R, Cpk, and Cpm charts, run all twelve rules live, show a drift caught before a breach, and walk the audit-ready archive — on-prem, live in 6 to 12 weeks.