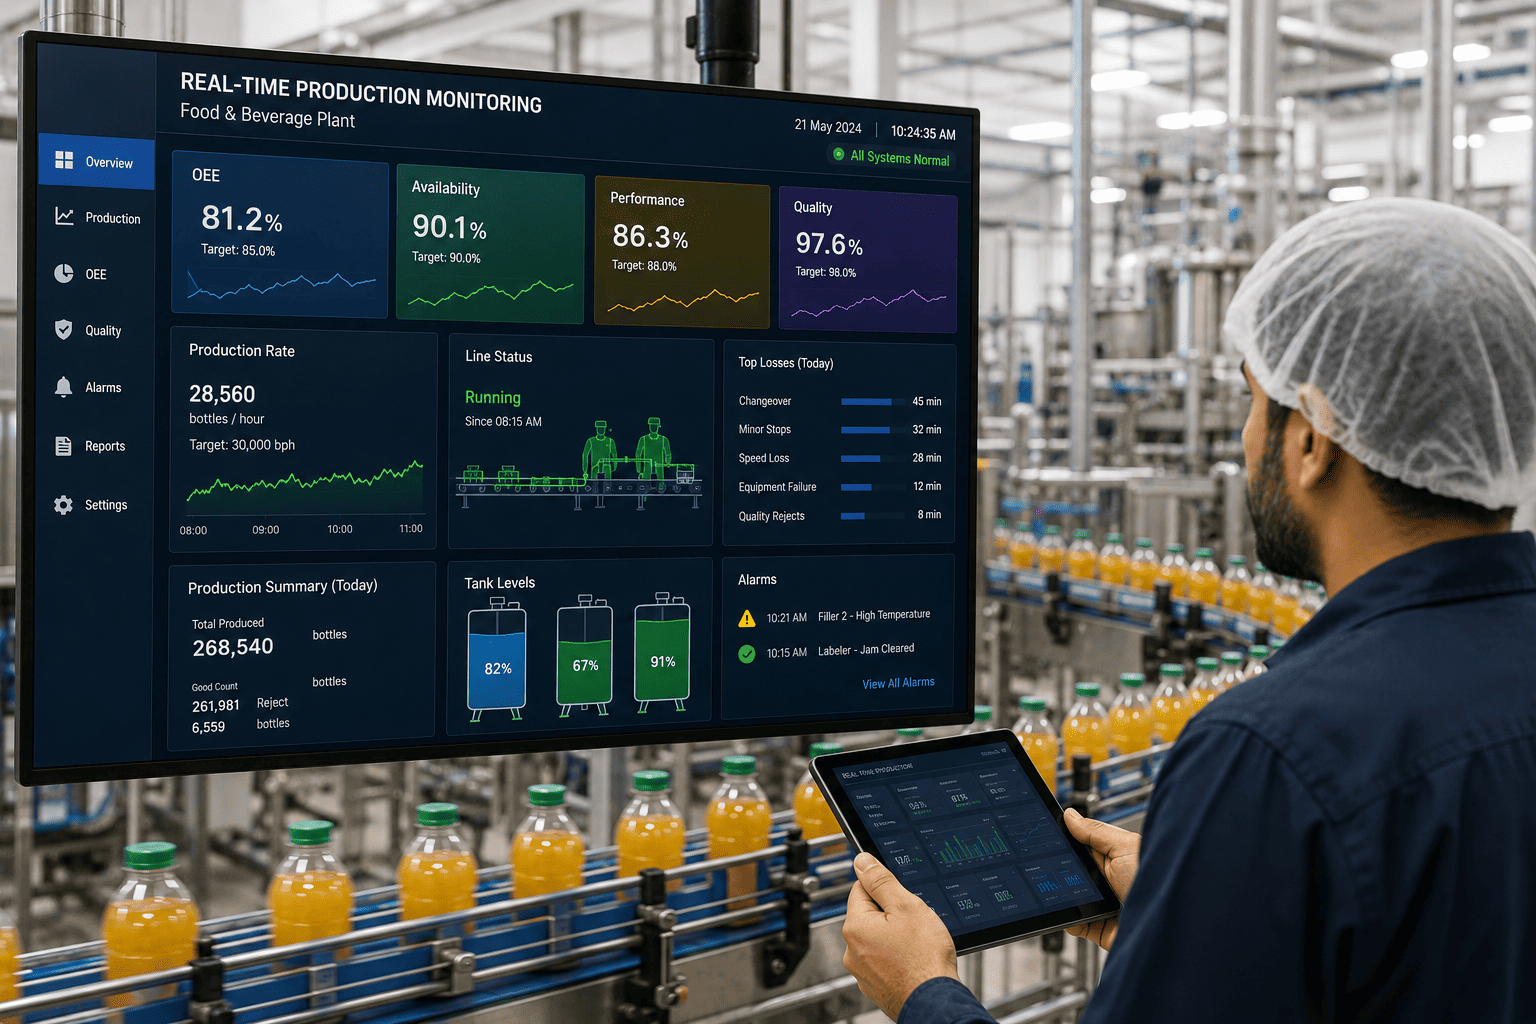
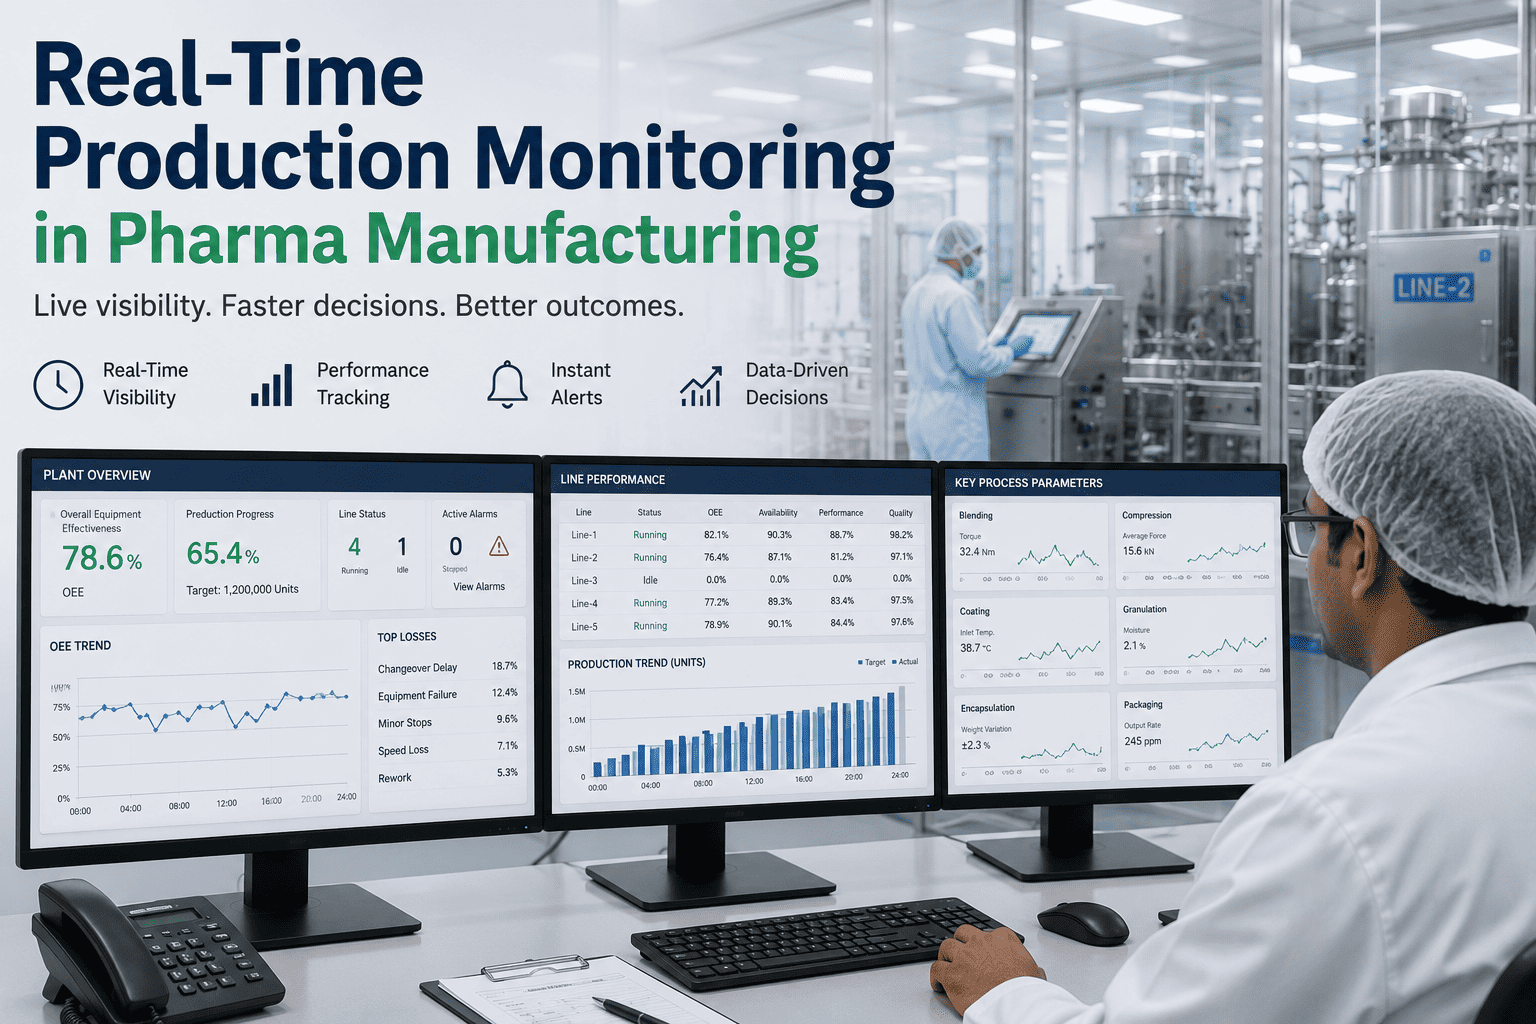
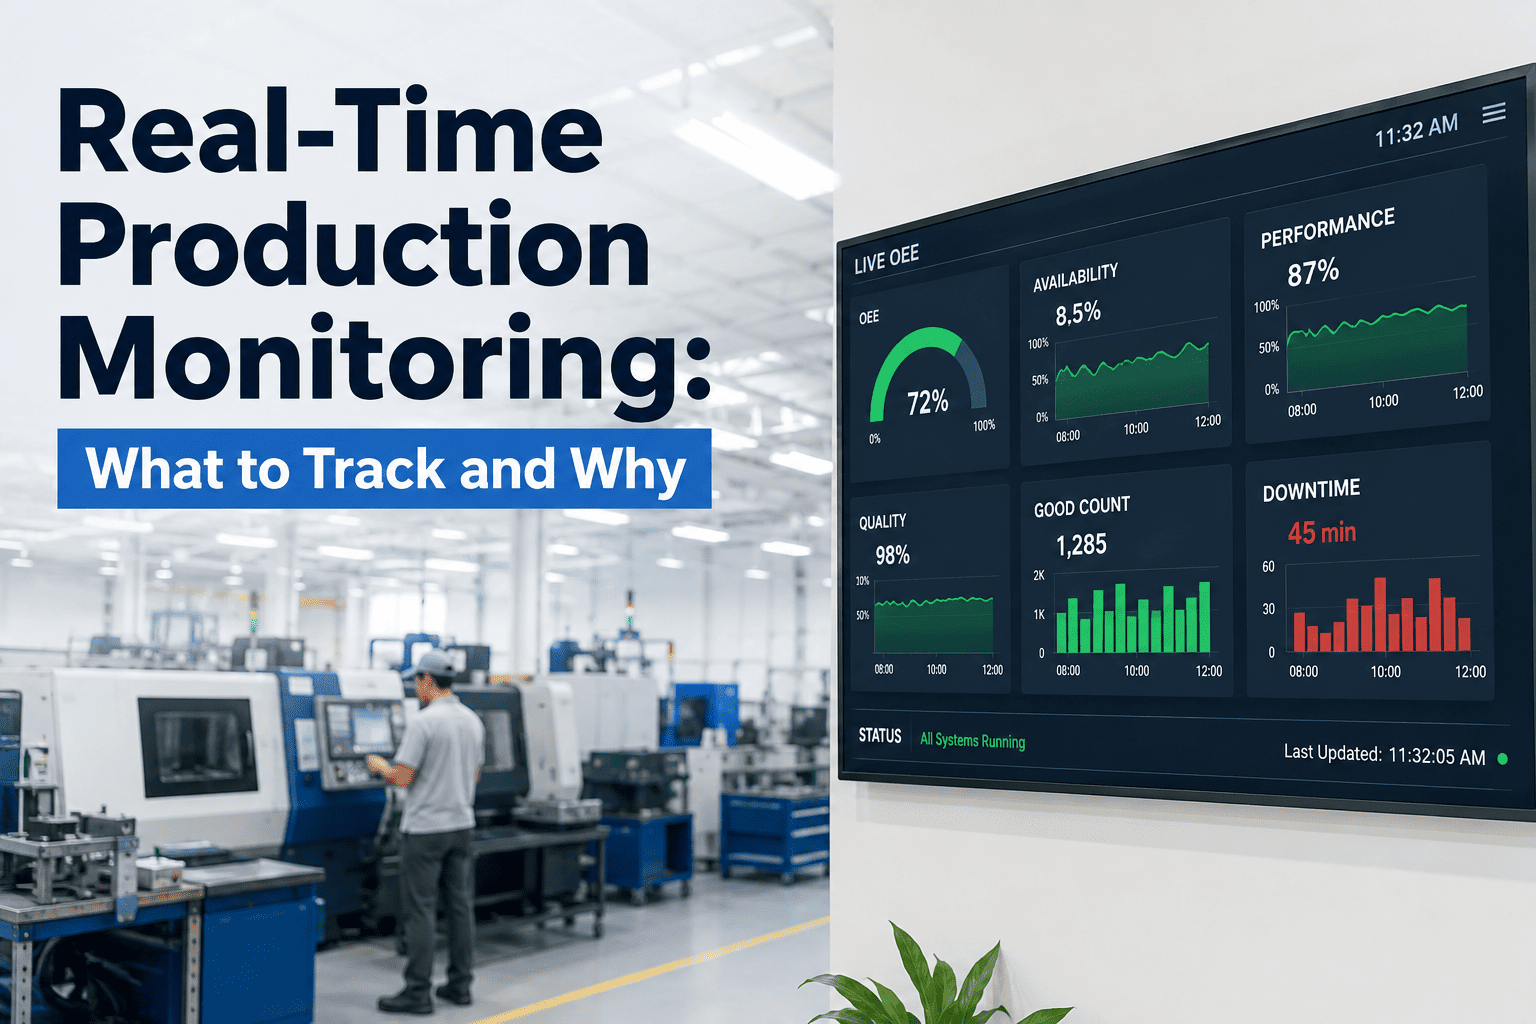
An operator running a food line already knows when something's wrong — the line feels slow, the filler hesitates, the reject bin fills faster than usual. What they don't have is the number while there's still time to act on it. By the time a shift-end spreadsheet says the line ran at 71%, the shift is over and the lost hour is gone. Real-time monitoring closes that gap: the machines report their own state continuously, the software classifies every stop, microstop, changeover, and sanitation cycle without anyone typing it in, and the operator sees the loss forming live instead of reading about it tomorrow. Most plants on manual tracking believe their uptime is 85–90%; once monitoring goes live the true number is usually 65–80%, and that gap is microstops and unlogged changeovers nobody was acting on. iFactory's real-time monitoring layers above your existing PLC, SCADA, and MES — reading from them, never replacing them — on a turnkey on-premise NVIDIA appliance.
iFactory Real-Time Monitoring · Food & Beverage
See the Lost Hour While You Can Still Stop It.
Live line state, microstops counted automatically, losses tagged, and Andon alerts on the operator display — the machines report themselves, no manual logging. On a turnkey on-premise NVIDIA appliance that sits above your PLC, SCADA, and MES.
65-80%
real uptime vs assumed 85-90%
15-29%
efficiency lift from visible displays
No
manual machine-state logging
On-prem
appliance above your stack
The Hidden Gap Between Assumed and Real
The single most common surprise when monitoring goes live is the uptime number. A plant running on manual tracking almost always believes it's in the high eighties; the equipment, reporting its own state continuously, tells a different story in the high sixties to low eighties. That ten-to-twenty point gap isn't operators slacking — it's the sub-five-minute microstops, the unlogged changeovers, and the slow cycles that no one running a line has time to record. For a plant running ten critical machines, closing that gap is the equivalent of finding an eleventh machine.
What manual tracking shows
85-90%
The number on the shift spreadsheet — built from what operators had time to log, which leaves out the losses that never made it onto paper.
What the machines report
65-80%
The true figure once equipment reports its own state — microstops, slow cycles, and unlogged changeovers all counted. The gap is recoverable capacity.
Want to know your real number? Get a turnkey AI quote and we'll run live monitoring on your highest-volume line in the pilot.
The Machines Report Themselves
The rule that makes monitoring work: any system that needs an operator to type in machine state will be wrong — not because operators are unreliable, but because they're running a line. Real-time monitoring reads machine state continuously from the equipment and classifies every moment automatically, so the operator's screen reflects what's actually happening without anyone touching it.
Runningon cycle, on rate
Microstopsub-5-min stop, auto-counted
Unplanned stopbreakdown or fault
ChangeoverSKU or format change
Sanitation / CIPclean-in-place cycle
Slow cyclerunning under rate
Every state is classified against the active production order automatically — running, idle, microstop, changeover, sanitation, slow cycle — so the loss is tagged the moment it happens, not reconstructed at shift end.
One Data Stream, Three Views
The same underlying data serves three different decision-makers, and a system that only delivers one forces the other two to work blind. The operator works at the machine, the supervisor at the line, the plant manager at the factory — each needs the same truth at a different altitude. Monitoring surfaces all three from one stream.
Machine level
Operator
One piece of equipment — the filler, the labeler, the deboner. Live state, current rate, microstop count, and the next action right at the line.
Line level
Supervisor
The sequence of machines, conveyors, and scales that make a finished product. Where the line's bottleneck is right now and which stop is hurting throughput.
Factory level
Plant manager
Every line, every shift, every SKU at once — OEE, microstop intensity, changeover discipline, and quality rolled up for comparison.
From Live State to Operator Action
Monitoring only pays off if the operator acts on it, so the loop is built around the floor, not a back-office report. A stop is detected and classified, an Andon alert lands on the operator display, the loss is tagged to a coded cause, and the data rolls up — all in seconds. Simply making production data visible on the floor has been shown to lift efficiency 15 to 29% on its own, before any deeper analysis.
1
Detectequipment reports a state change in real time
2
Classifystop, microstop, changeover, or CIP tagged automatically
3
AlertAndon fires to the operator display and scoreboard
4
Act & roll upoperator responds; loss feeds the live Pareto
Want the loss on the screen, not the spreadsheet? Start a 6-week pilot and we'll put live Andon on one line's operator displays.
It Layers On — It Doesn't Replace
The biggest misconception about real-time monitoring is that it replaces something. It doesn't. It sits as a layer above your existing PLC, SCADA, and MES — reading from them, aggregating across them, and surfacing what those systems can't on their own. No rip-and-replace, no IT migration, no production interruption. Your control and execution systems keep doing their jobs; monitoring makes the shop-floor picture visible on top of them.
Monitoring layer
iFactory lives herelive OEE, microstop tracking, loss tagging, Andon, shift handover, multi-line Pareto — reading from everything below
MES
Executionwork orders, batch records, recipes, traceability — FactoryTalk, Wonderware, Aveva, SAP MII
SCADA
Supervisionoperator screens, process visualization, alarms, local historian — WinCC, FactoryTalk View, Ignition
PLC
Controlfiller, labeler, capper, cartoner, palletizer — Siemens, Allen-Bradley, Mitsubishi, Schneider, ABB
Connection is over the protocols you already run — OPC-UA, EtherNet/IP, Profinet, Modbus TCP — so the appliance reads existing signals rather than demanding new ones.
Ask the Copilot
The monitoring layer answers plain language too — for the operator working out what's killing the line right now, without leaving the station.
Plant Copilot — Real-Time Monitoring
Operator
Line 3 feels slow but I don't see a big stop. What's going on?
Copilot
It's microstops, not one big stop — that's why it doesn't show on the downtime board. The labeler has logged 27 stops under 90 seconds in the last hour, each too short to feel like much, but together they're costing you about 14% of Line 3's rate right now. They started clustering after the last roll change. Most likely a label-feed or web-tension issue at the labeler. Want me to raise an Andon to your supervisor and tag it?
Operator
Yes. Is Line 3 worse than the other lines on this today?
Copilot
Andon raised and the microstop cluster tagged to the labeler. On the same loss codes, Line 3 has roughly 3x the microstop count of Lines 1 and 2 today, and it's almost entirely the labeler — the filler and capper are running clean. So this is one machine on one line, not a plant-wide issue. Fixing the labeler feed would pull Line 3 back in line with the others.
Turnkey: Hardware, Software, Live in 6-12 Weeks
iFactory ships a pre-configured NVIDIA AI appliance — racked, monitoring platform, microstop detection, and Andon pre-installed. Rack it, plug in power and Ethernet, and it's live inside your firewall. Field techs connect your PLCs over OPC-UA, EtherNet/IP, Profinet, and Modbus TCP, bridge SCADA and MES, and map your line layout, SKU library, and changeover matrix. The engagement covers loss-code library, microstop sensors at key points, operator training, shop-floor displays, and 24×7 remote monitoring.
Phase 1 · Weeks 1-4
Ship & Connect
Appliance on-prem; PLCs connected over your protocols, SCADA and MES bridged. Line layout and SKU library mapped.
Phase 2 · Weeks 5-8
Configure & Pilot
OEE definitions, ideal cycle times, and loss-code library set; microstop sensors deployed; pilot on 2-3 top lines, operators trained.
Phase 3 · Weeks 9-12
Roll Out & Go Live
Full plant; Andon to operator displays, shop-floor scoreboards installed, review cycles begin, 24×7 monitoring at 99.9% uptime.
1000+
clients running iFactory
6-12 wks
to live operation
On-prem
inside your firewall
What the Operator Gets
The live number instead of the post-mortem, microstops finally visible, an Andon that calls for help the moment a stop starts, and a system that reads the machines instead of asking the operator to log them.
Live
Not post-mortem
act while the shift is still running
Visible
Microstops
the silent loss finally counted
Andon
On the display
help called the second a stop starts
Zero
Manual logging
the machines report themselves
Frequently Asked Questions
Does real-time monitoring replace our PLC, SCADA, or MES?
No. It layers above them — reading machine state from your PLCs, aggregating across SCADA and MES, and surfacing live OEE, microstops, loss tags, and Andon that those systems don't provide on their own. There's no rip-and-replace, no IT migration, and no production interruption. Your existing systems stay the system of record.
Why is our real uptime lower than what we report?
Because manual tracking misses what operators don't have time to log. Most plants assume 85–90% but the true figure is usually 65–80% once equipment reports its own state, counting sub-five-minute microstops, slow cycles, and unlogged changeovers. The gap is recoverable capacity — for ten machines, often the equivalent of an eleventh.
Do operators have to log machine states?
No, and that's the point. Any system relying on operators to type machine state will be wrong, because they're busy running the line. The equipment reports state continuously and the software classifies it — running, microstop, changeover, sanitation — automatically. Operators add judgment, like a reason note on an unusual stop, not raw data entry.
Why do microstops matter so much?
Individually a microstop is a stop too short to log, so it never gets recorded manually. Across a shift they accumulate into significant lost capacity — often more than headline downtime. Because the system catches them automatically from machine state, maintenance can finally target the recurring causes instead of guessing.
What does it connect to, and where does data live?
It connects to your PLCs over OPC-UA, EtherNet/IP, Profinet, and Modbus TCP, and bridges SCADA and MES — the protocols you already run. Everything stays on-premise inside your firewall on the NVIDIA appliance, with 24×7 remote monitoring and 99.9% uptime. The deployment can be fully air-gapped where required.
Live State. Microstops Counted. Andon on the Floor. On-Prem.
See Your Plant's Real Live Number
Bring one line and your current shift numbers. We'll connect to your PLCs over your existing protocols, show live state and the microstops your manual tracking misses, put Andon on the operator display, and roll it up to a multi-line Pareto — then scope the 6-to-12-week turnkey deployment, on-prem, above your existing stack.
3 views
machine · line · factory
Layers on
no rip-and-replace
1000+
clients · 99.9% uptime