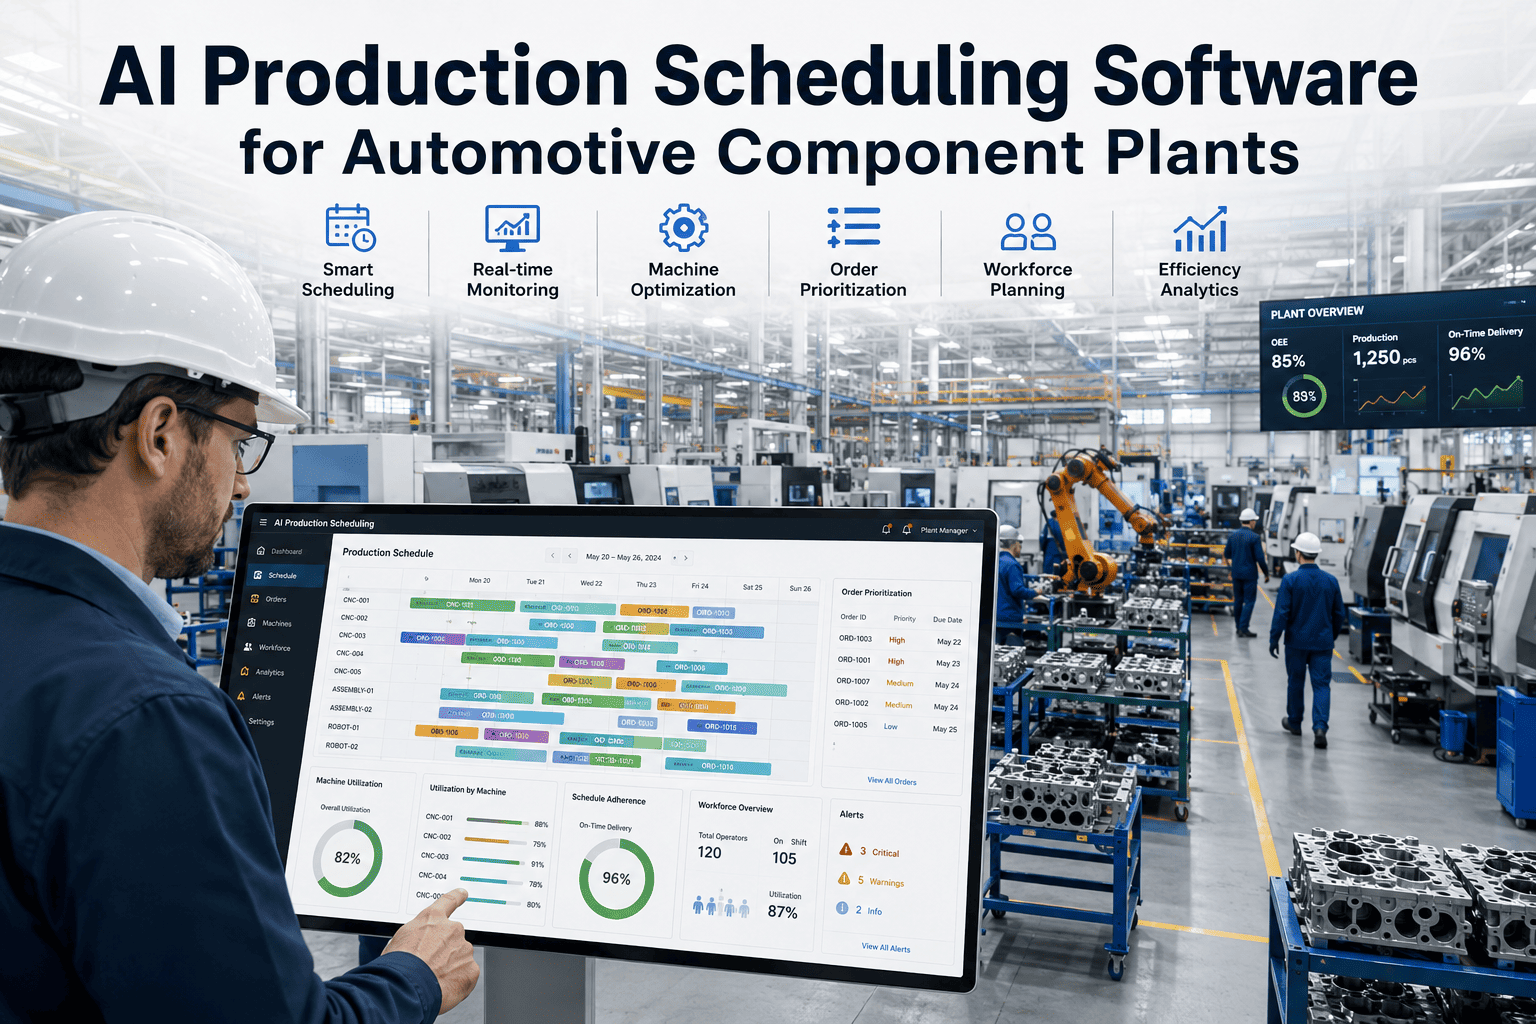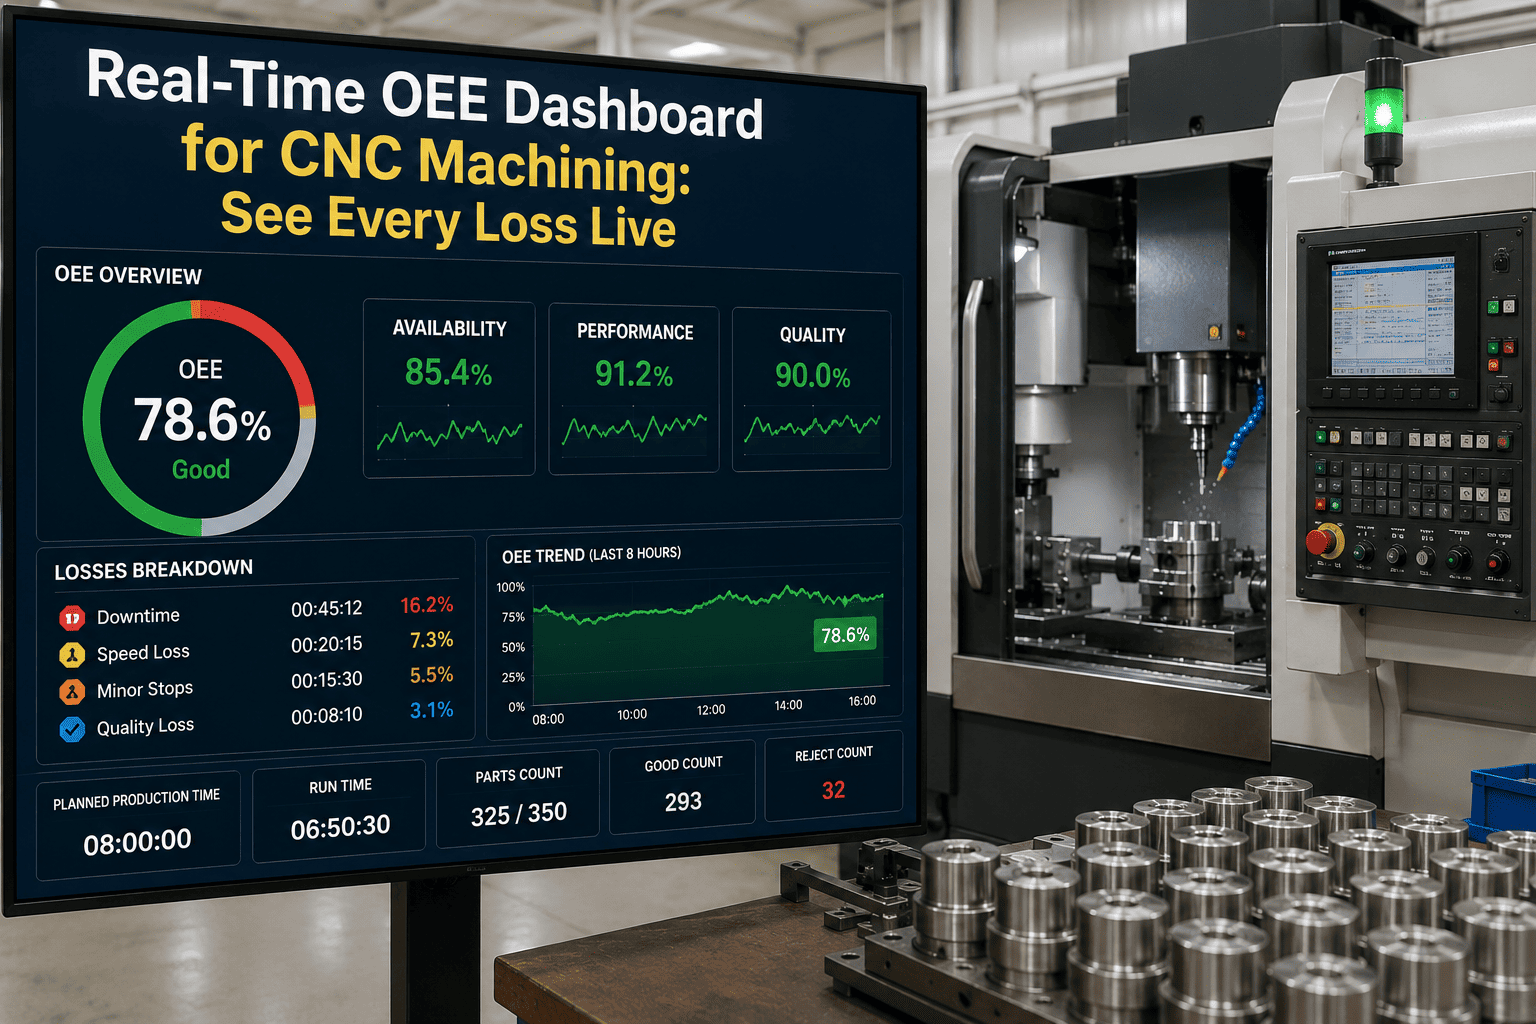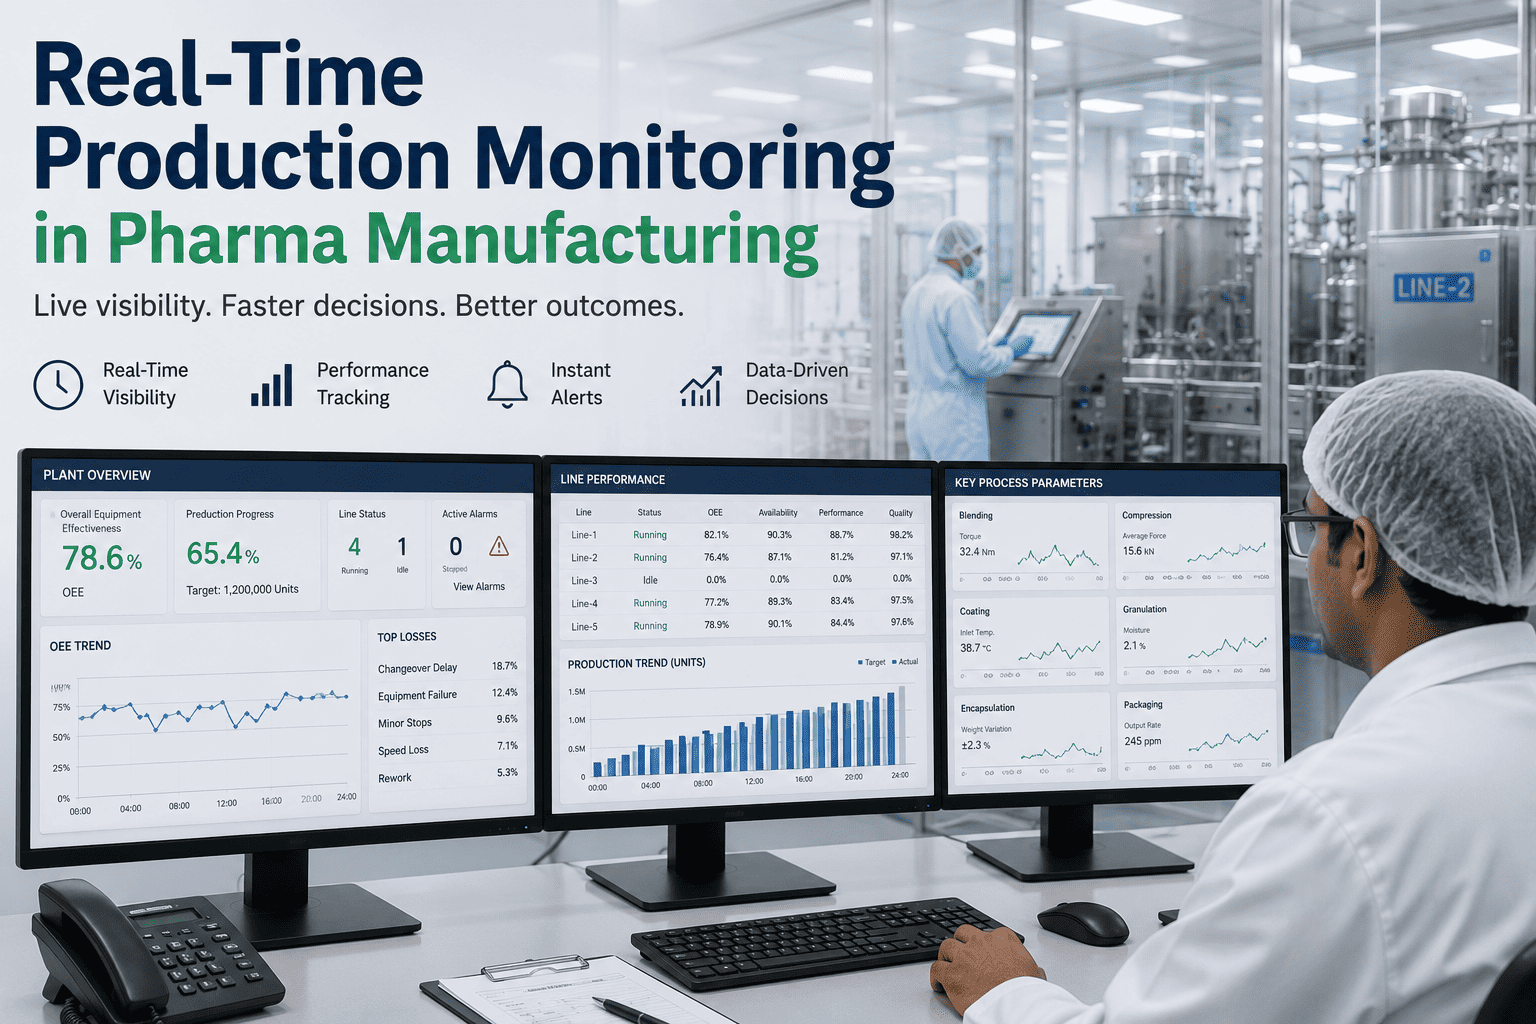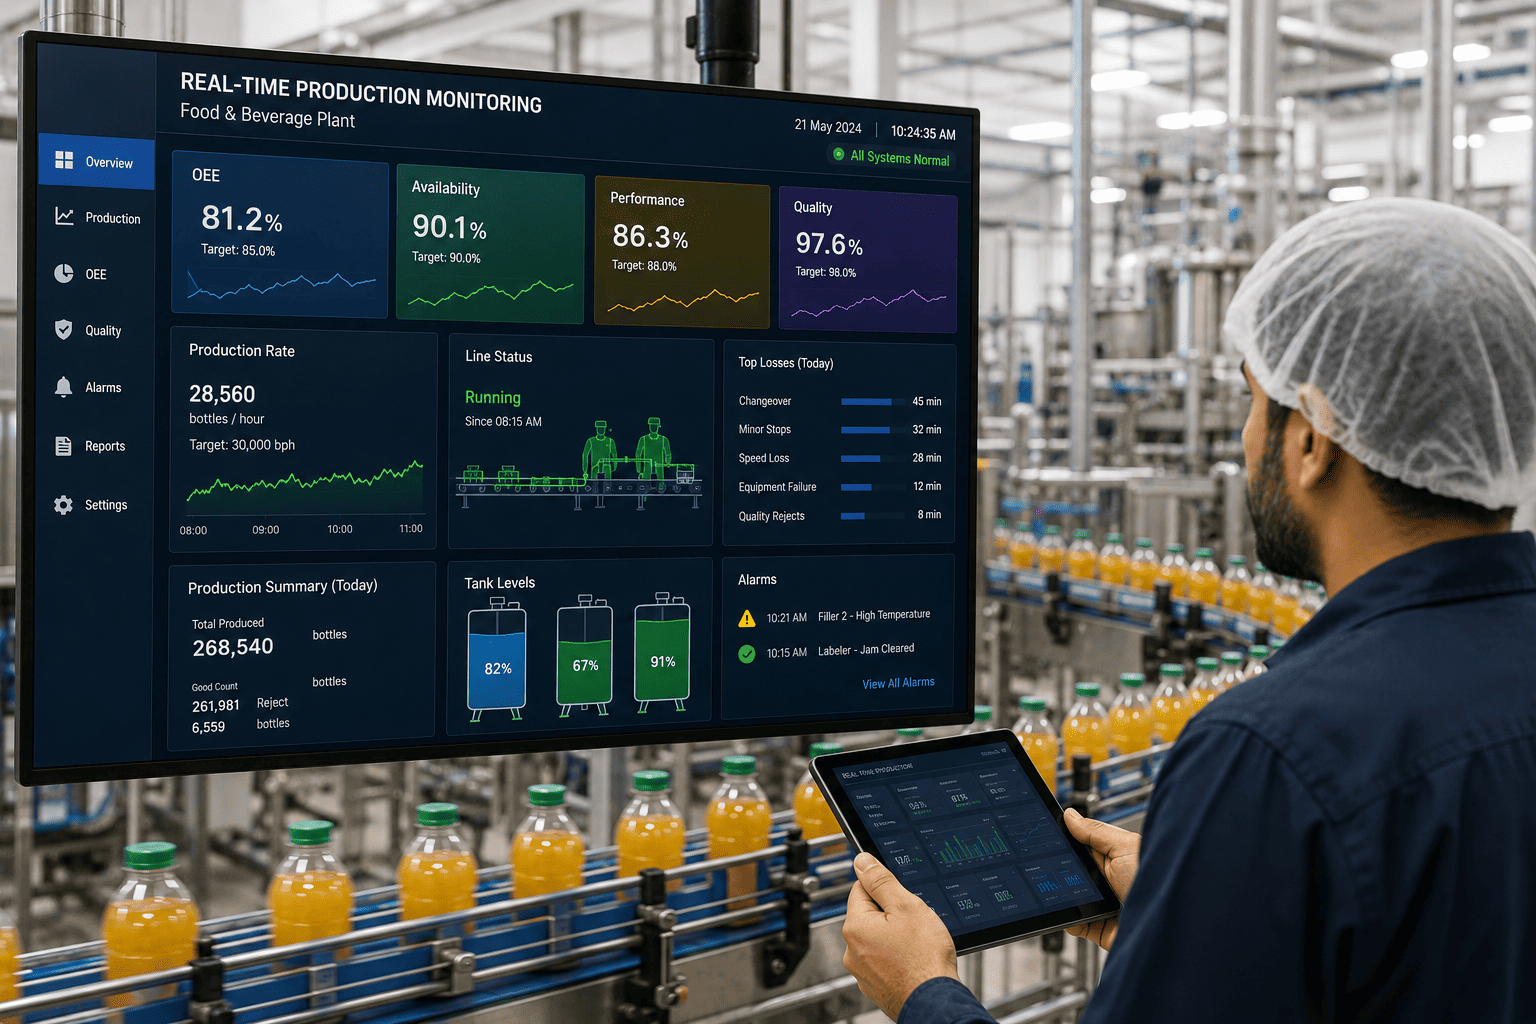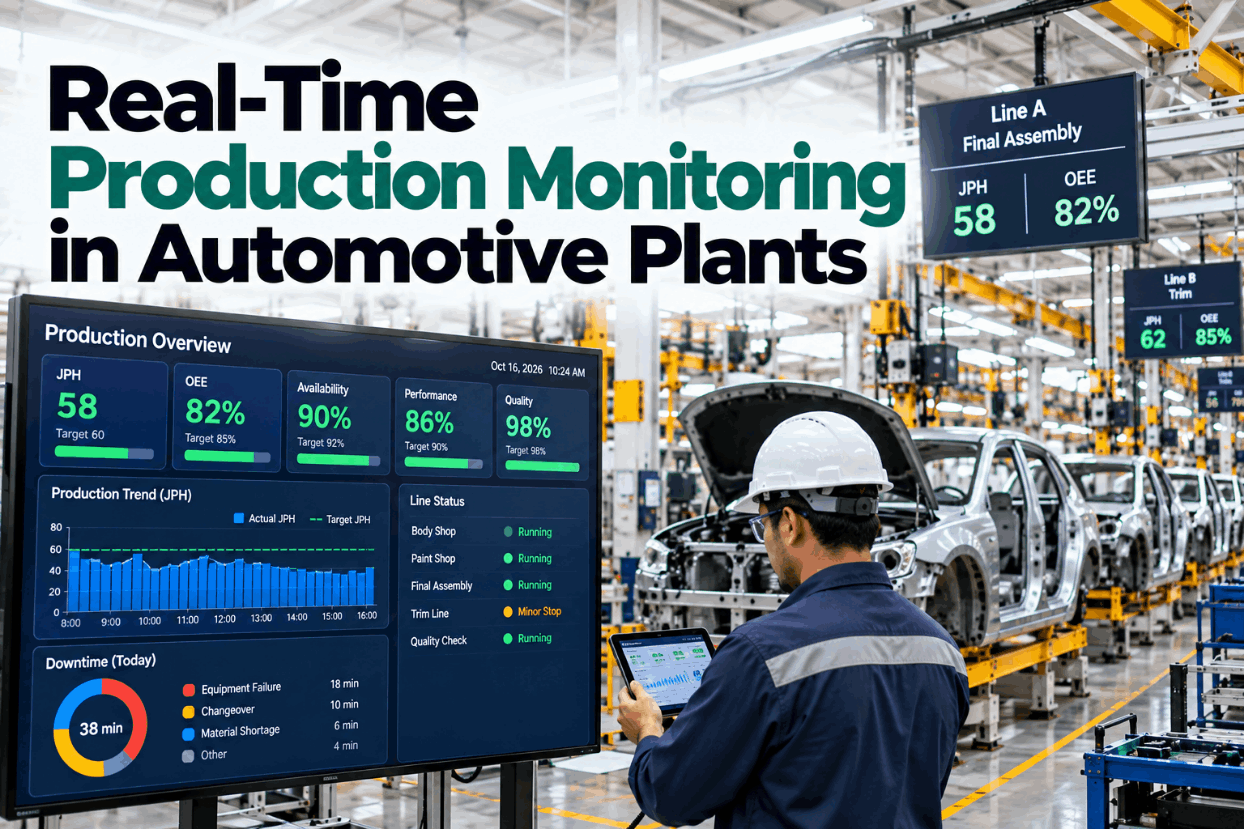
Real-time production monitoring in automotive plants shows what the line is doing now, not what a report says it did yesterday. That difference matters because a lost job cannot be recovered after the shift ends. With live data from PLCs, SCADA and MES, a team leader sees a station slipping within minutes and can act while there is still time. This guide explains what to monitor, how to layer monitoring on the systems you already have and what results to expect. To see live monitoring on a sample line, book a short walkthrough.
Real-Time Production Monitoring in Automotive Plants: See JPH Losses While You Can Still Act
Live counts, stops and causes from your existing PLC, SCADA and MES, shown to the people who can fix the problem this hour.
A problem seen at 10:00 can be fixed by 10:15; one found in tomorrow’s report cannot.
They are rarely logged by hand, so manual reports miss them.
Monitoring reads from the PLC, SCADA and MES you already run.
Data helps only when the team leader or operator sees it in time.
What Is Real-Time Production Monitoring?
Real-time production monitoring collects machine and line data automatically and shows it within seconds to the people running production.
Automatic capture of counts, states, stops and faults from line equipment, turned into live figures such as jobs per hour, downtime by cause and gap to plan.
- Automatic. Data comes from the equipment, not from a clipboard.
- Live. Screens refresh in seconds, not at the end of the shift.
- Specific. Each stop has a station, a time and a cause.
- Shared. Operators, team leaders and managers see the same facts.
It is not a new control system. It sits beside the systems that run the line and reads from them.
A one-line trial is the quickest way to see what it reveals. We can plan one on a call.
Why Live Data Matters in a Car Plant
Automotive lines lose money by the second when they stop, so the speed of the response matters.
Illustrative. Faster detection is the main benefit of live monitoring.
Siemens’ survey found large plants now lose about 27 hours a month to unplanned downtime, down from 39 in 2019. Plants are improving, and visibility is a large part of why.
The figures above are for large plants. Your own cost per minute is easy to work out. See how in a demo.
The Losses Manual Reports Miss
Paper logs and end-of-shift entries capture the big breakdowns and miss most of the small losses.
Illustrative. Short stops are often the largest single loss once they are measured.
- Short stops go unlogged. Writing down a 40-second stop takes longer than the stop.
- Times are rounded. A 7-minute stop becomes 5 or 10.
- Causes are guessed. The reason is filled in hours later, from memory.
- The wrong station is blamed. A starved station looks like the problem when the cause is upstream.
Share of unavailable time that stops of under five minutes can account for, according to one monitoring vendor’s analysis of several hundred plants.
Automatic capture counts every stop, however short. Our specialists can show the difference on your line.
How Much Manual Data Work Plants Still Do
Many plants still collect production data by hand, and it takes more time than most managers think.
Time spent typing numbers is time not spent on the floor. Automatic collection gives that time back to supervision and problem solving.
We measure current manual effort at the start of every rollout.
Layering Monitoring on PLC, SCADA and MES
Each system you already have holds part of the picture. Monitoring brings the parts together.
| System | ISA-95 level | What monitoring reads from it |
|---|---|---|
| PLCs and robot controllers | Level 1 and 2 | Cycle start and end, part counts, faults, station states |
| SCADA and HMI | Level 2 | Alarms, line states, operator actions |
| MES | Level 3 | Orders, model and variant, quality results, schedule |
| CMMS | Level 3 | Open work orders, planned maintenance |
| ERP | Level 4 | Demand, plan, calendar |
PLCs scan their programs every few milliseconds, far faster than a person needs. MES and ERP think in jobs, shifts and days. Monitoring takes the fast signals and turns them into figures people can use.
Nothing is replaced. The PLC still runs the line, SCADA still shows the process and MES still manages orders.
Ask our team which of your systems already expose the signals needed.
How the Data Flows
Data moves from the machine to the screen in five short steps.
Signals read from PLCs, robots and SCADA.
An edge device or server gathers them on site.
Signals named by plant, area, line and station.
Counts, states and stops turned into JPH and losses.
Dashboards and alerts for each role.
Using open standards means you are not locked to one vendor. Our engineers can review your network and protocols.
Which KPIs to Show Live
A few live figures do most of the work.
This hour and this shift, with the gap as a number.
Top reasons right now, ranked.
Which stations are waiting, and on what.
Stations running over takt.
Defects and holds as they happen.
Whether the gap is closing or growing.
Keep the first screen to these. Detail can sit behind it for those who need it.
See how the six fit on one screen in a session.
How Fast Is Real Time?
Real time means fast enough to act, and that differs by role.
| Role | Needs data within | To do what |
|---|---|---|
| Operator | Seconds | React to a fault or quality alert at the station |
| Team leader | Under a minute | Go to the station that needs help |
| Supervisor | A few minutes | Move people, call maintenance, adjust the plan |
| Plant manager | Hourly | See whether the shift will hit its number |
These are practical guidelines, not a standard. What matters is that data arrives before the chance to act has gone.
We agree the response time for each role during set-up.
What Results Plants Report
Published results vary, but the pattern is consistent: once losses are visible, they shrink.
That is one supplier’s result from a vendor case study, not a typical figure. It does show what is possible when a plant moves from paper to live data.
- Losses known the next day
- Short stops missing
- Causes from memory
- Meetings spent finding facts
- Same problems every week
- Losses seen within minutes
- Every stop counted
- Causes from machine data
- Meetings spent deciding actions
- Repeat problems ranked and fixed
Your own baseline is the fair test. Discuss a trial with our advisors.
How to Start
Start small, prove it and expand.
A bottleneck or a line with known losses.
Read counts, states and faults from its PLCs.
Measure two weeks before changing anything.
Put a live screen in front of the team leader.
Tackle the top three loss causes.
Use the same template on the next line.
A first line usually shows its largest hidden loss within days. Plan yours in a working session.
Real-Time Monitoring Checklist
A quick readiness check.
Most plants have the signals; few have them in one place. A data review shows what is ready.
How iFactory Delivers Real-Time Monitoring
iFactory reads from your PLC, SCADA and MES, calculates losses automatically and shows each role what needs attention now.
PLCs, robots, SCADA, MES and CMMS.
Every stop counted, down to seconds.
The real constraint identified.
Operator, team leader, supervisor and manager.
Ask why the line is behind and get an answer.
Processing on an iFactory server at your plant.
Share signals from one line and we will show its live picture in a pilot.
See One Line Live
Connect one line’s PLCs. We show JPH, every stop and the top loss causes live, and compare them with your current reports.
Line rate is 56 jobs per hour against a target of 60. Station 31 has had 9 stops of under a minute, and none were logged by hand.
Nine Short Stops Nobody Logged
This is how a team leader might use the live view.
iFactory ships as a pre-configured NVIDIA AI server, racked and ready with the production monitoring models loaded. Rack it, plug in power and Ethernet, and the AI is live. Scope covers data connections across press, body, paint, assembly and machining areas, PLC/SCADA, MES, CMMS and ERP integration, cabling and network setup, team training and 24×7 remote monitoring.
Server installed, PLC, MES and CMMS links live, history loaded.
Models tuned on your own lines, then piloted in one area with your team reviewing every output.
Rollout to the agreed lines, team training done, 24×7 remote monitoring in place.
Software, server and integration come as one package. For pricing, contact our sales team.
Frequently Asked Questions
Automatic collection of counts, states, stops and faults from line equipment, shown within seconds as figures such as jobs per hour, downtime by cause and gap to plan.
No. Monitoring reads from the PLC, SCADA and MES you already have and brings their data together.
Siemens’ 2024 report puts it at $2.3 million per hour for large automotive plants, more than $600 a second. Smaller plants should calculate their own figure.
They are rarely logged by hand but add up. One vendor analysis found stops under five minutes can make up 30–50% of unavailable time.
Commonly OPC UA for reading machine data and MQTT with Sparkplug for moving it, both open standards.
A first line is typically live within 6–12 weeks, often sooner for basic counts and stops. Plan it with our specialists.
See Losses While You Can Still Recover Them
iFactory shows live JPH, every stop and its cause from the systems you already run, so your team acts this hour, not after the shift.
Illustrative. Short stops are usually the largest loss and the one manual logs miss.