A plant director at a 40-line oral solid dosage facility once asked us, "If real-time OEE dashboards have been around for fifteen years, why does every pharma plant I visit still run on shift-end manual entries?" The answer is that real-time OEE has a credibility problem. The first time it goes live, the number is lower than the board has been hearing for years — and most projects die in that first week. The plants that survive are the ones that frame the deployment correctly from the start: the right asset-class lens, the right role-based dashboards, and the right validation approach. This page is the second-generation guide to that framing, built for plant leaders who already understand the basics and need the depth — drawn from field deployments across blister, cartoning, tablet, capsule, and lyophilisation lines.
Real-Time OEE for Pharma — Asset Classes, Roles, and the Data Path That Survives an Audit
Generic OEE software fails in pharma because it ignores the structural realities of validated production. This is the asset-class-by-asset-class playbook: which losses dominate each line type, which dashboard panels each role actually uses, and how the data path is engineered to clear GAMP 5 and 21 CFR Part 11 on the first attempt.
Three Realities Every Pharma OEE Deployment Encounters
Real-time OEE in pharma is not a software project. It is a confrontation between three operational realities — the one that is currently measured, the one that gets quietly missed, and the one that becomes recoverable once the gap is made visible. Most failed deployments confuse the second reality with the third.
The number the system reports today
68 – 78%
This is the OEE that appears in monthly business reviews, capital allocation models, and bonus calculations. It is calculated from operator logs and good-product counters using rules that have not been re-examined in years. It is internally consistent, externally credible, and structurally optimistic. Nobody is lying — the methodology is simply tilted by design.
The number direct sensors reveal
52 – 62%
This is what shows up when you instrument the line and let the data path bypass the manual entry. Every micro-stop above two seconds, every cycle-time deviation, every in-process reject — captured automatically. The gap to Reality 1 is 8 to 16 points and it appears within the first week of any honest measurement program. The first instinct is denial. The right response is curiosity.
The number you can credibly target
68 – 78%
By month nine of a mature deployment, the line is genuinely operating where the old report claimed it was — but now the number is trustworthy. Top-quartile pharma plants reach 70–78% real OEE through Pareto-driven loss reduction. The starting gap is not a problem; it is the budget for improvement.
Five Pharma Line Types — Different Losses, Different Dashboards
Generic OEE platforms treat every pharmaceutical line the same. They are not the same. A high-speed blister line and a lyophiliser share almost no loss DNA — the dashboard, the loss codes, the alert thresholds, and the operator interactions all need to differ. These are the five asset classes that cover most modern pharma plants.
Tablet Compression Press
Rotary turret presses — single layer, bilayer, multi-tipCapsule Filling Line
Dosator, tamping, and dosing-disc filling machinesBlister Packaging Line
PVC / Al-Al thermoforming and cold-form linesCartoning Line
Horizontal cartoners with insert placement and serialisationLyophiliser (Freeze Drier)
Batch sterile freeze-drying — vial and tray productsFour Personas, Four Dashboards — One Data Source
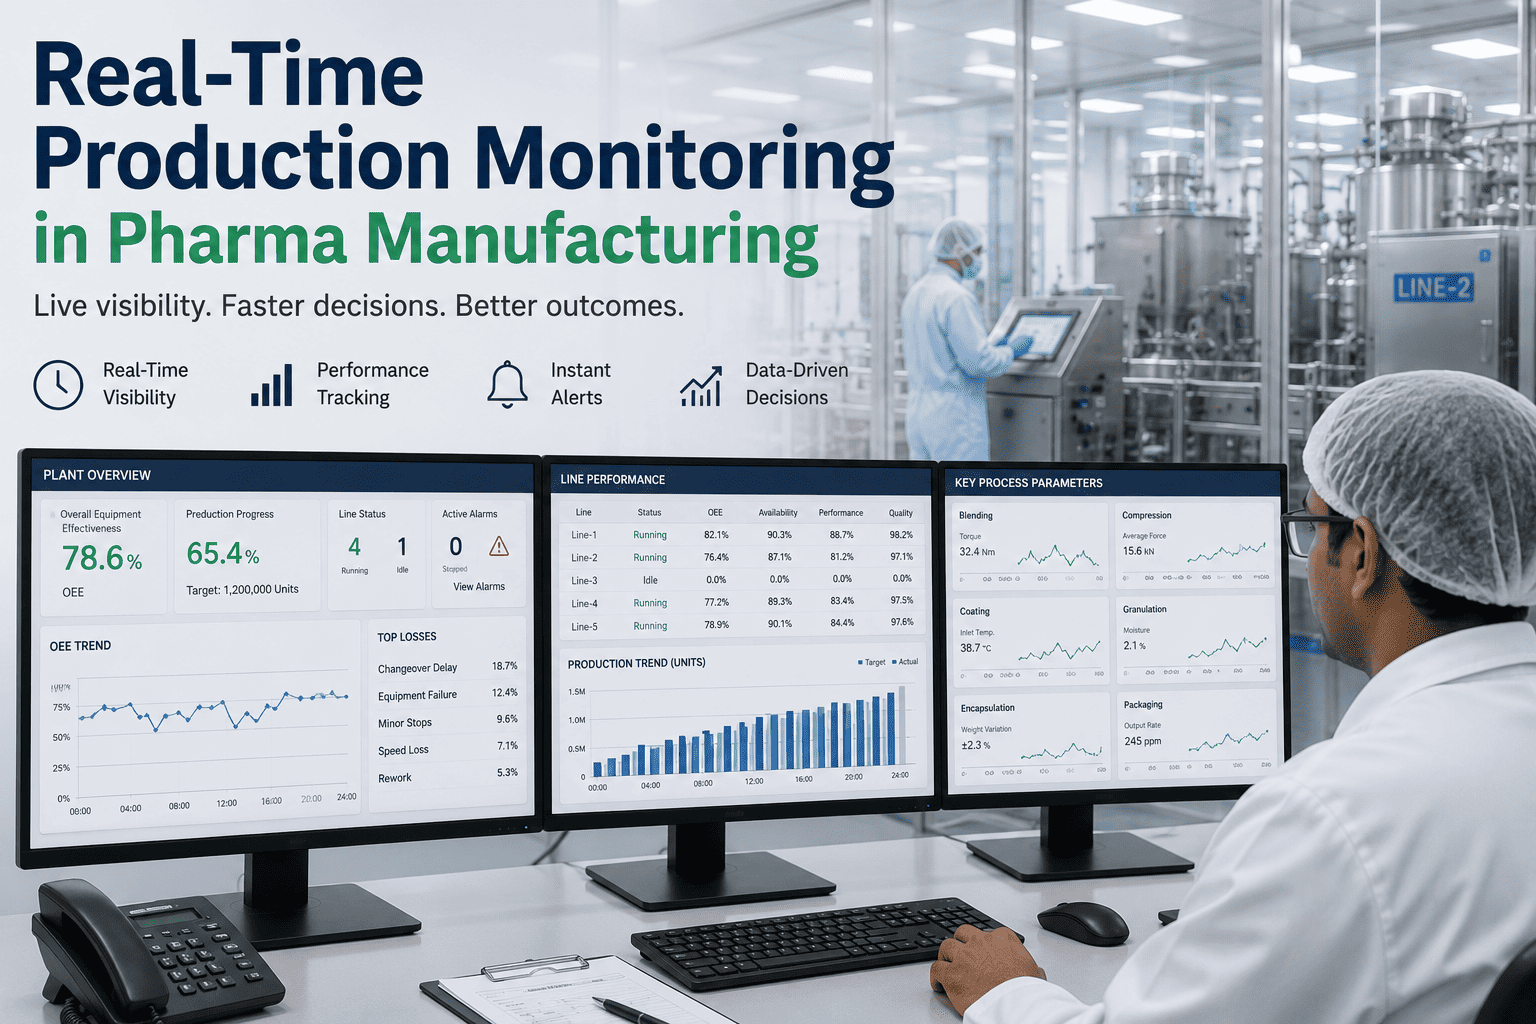
A real-time OEE dashboard fails when it tries to be the same screen for everyone. An operator does not need quarterly trending; a plant manager does not need three-second cycle-time charts. The four role-based views below all read from the same underlying data path, but each surfaces the metrics that role actually acts on.
- Current shift OEE with traffic-light status against target
- Active alert — what is wrong right now, in one line of text
- Reason-capture prompts when a stop is detected
- Cycle-time bar showing nameplate vs current speed
- Next changeover countdown with checklist
- Historical trends — these belong to the supervisor
- Multi-line aggregates — wrong span of attention
- Validation status fields — handled by engineering
- OEE component breakdown — distracts from the immediate action
- All assigned lines on one screen with composite OEE
- Live loss Pareto for current shift with drill-down to events
- Changeover progress against benchmark time
- Operator action queue — open reason captures, pending acknowledgements
- Shift comparison against prior shift on the same product
- Pareto top-3 — where is this shift losing minutes
- Cycle-time return-to-nameplate after jams
- Cross-line resource reallocation (operators, materials)
- Escalation triggers when SPC limits are crossed
- Plant composite OEE with line-by-line ranking
- Week-over-week trend on each line with target overlay
- Top recurring losses by cumulative minutes lost
- Validation status — which lines are GMP-clean, which have open observations
- Capacity utilisation forecast for the next planning horizon
- Capex priorities — which line warrants a capability investment
- Cross-shift performance variation — coaching opportunities
- Engineering resource allocation against the loss Pareto
- Capacity commitments to commercial planning
- In-process control results tied to batch number, line, and time
- Reject trends from vision systems and weight checkers
- Deviation candidates — events that may require investigation
- Validation status of all OEE-relevant calculations
- 21 CFR Part 11 audit trail for the current and prior shifts
- Start of formal deviations when patterns warrant investigation
- Batch disposition decisions based on real-time data
- Validation re-attestation cycles
- Inspection readiness — pulling audit trail extracts on demand
Get an asset-class-specific OEE assessment
Tell us which lines matter most. We design the sensor, dashboard, and validation package against the actual loss profile of your tablet, capsule, blister, cartoning, or lyophilisation lines — not a generic OEE template.
- Line-specific sensor topology
- Role-based dashboard design
- GAMP 5 validation package
- 21 CFR Part 11 audit trail
- Pre-configured NVIDIA AI server, racked and ready
- Live in 6–12 weeks, fully validated
The Data Path — Sensor to Dashboard, Validated End-to-End
The hardest part of pharma OEE is not the dashboard — it is engineering a data path that survives an FDA Form 483 observation. Every stage below has GxP implications and a defined deliverable in the validation package. Generic IIoT stacks fail here; pharma-specific stacks pass on the first audit.
Source — PLC, OPC-UA, and Edge Sensors
Production state, cycle counts, IPC results, and reject events sourced from the validated control system through OPC-UA, or from non-invasive edge sensors where the PLC is closed. Synchronised timestamps from a single time source. No PC clock fallbacks.
Deliverable: source-of-truth diagram, tag-to-spec traceabilityAcquisition — Edge Gateway with Lossless Buffering
Edge gateway samples at the rate the dashboard requires (1 Hz to 25 kHz depending on the panel), buffers locally during network interruptions, and publishes to the historian. Pre-trigger capture keeps the data path intact even when the network drops mid-event.
Deliverable: data-flow specification, gateway IQ / OQCalculation — Validated OEE Engine
OEE composite, A, P, Q components, ideal cycle time, and reject classification all computed from documented formulas. Calculation logic is the high-risk GAMP 5 segment — typically Category 5 custom code with dedicated functional specification and full PQ.
Deliverable: FS, DS, traceability matrix, PQ protocolAudit Trail — 21 CFR Part 11 Compliant Logging
Every supervisor-level change — loss reclassification, threshold edit, ideal cycle time adjustment — recorded in an immutable audit trail with user, timestamp, before-value, and after-value. Audit trail held for the full record retention period.
Deliverable: audit trail specification, retention policyPresentation — Role-Based Dashboards
Operator, supervisor, plant manager, and QA views all read from the same source. Role assignment tied to plant Active Directory or LDAP. Display layer is typically GAMP 5 Category 4 configurable — lower validation effort than the calculation engine.
Deliverable: URS per role, configuration specificationCase Study — Tier-2 Oral Solid Dosage Plant, 14 Lines
A formulations manufacturer in Gujarat with 14 lines across two buildings — 6 tablet, 4 capsule, 2 blister, 2 cartoning. Reported plant OEE: 74%. Real-time pilot on 4 lines: 59%. Nine months later: 71% real, holding steady, with a clear roadmap for the remaining 10 lines.
| Line type | Reported (before) | Real (Day 1) | Real (Month 9) | Gain in 9 months | Top recovered loss |
|---|---|---|---|---|---|
| Tablet press — Line T2 | 82% | 68% | 76% | +8 pts | Weight-drift micro-stops |
| Capsule fill — Line C1 | 76% | 61% | 72% | +11 pts | Broken-capsule feeder reliability |
| Blister pack — Line B1 | 72% | 55% | 69% | +14 pts | Changeover acceleration (SMED) |
| Cartoning — Line CT2 | 70% | 51% | 67% | +16 pts | Insert feeder reject reduction |
| Pilot composite | 74% | 59% | 71% | +12 pts | — |
The board conversation that turned the project
Month two of the pilot, the plant director presented the 59% number to the board. The CFO's first question was "what was it last quarter?" — to which the honest answer was "we cannot tell you, because we were measuring it differently." The board approved the rollout anyway, with the caveat that the same methodology had to be applied retroactively to set a clean baseline. Six months later, the trend was clear and the credibility problem had disappeared.
Six-Phase Rollout — Asset Class First, Plant-Wide Second
The rollout pattern that works is the inverse of how most projects are scoped. Start with the asset class where the loss profile is best understood, validate the playbook there, then template it across the rest of the plant. Trying to deploy everywhere at once almost always stalls in validation.
Asset Class Selection Week 1–2
Pick the asset class where pain is highest and instrumentation is already partial. Blister and cartoning lines are most common starting points — high changeover frequency, visible micro-stops, well-understood loss codes.
Pilot Line Instrumentation Week 3–6
Two lines from the chosen asset class, fully instrumented. Sensors, gateway, dashboard, role configurations. Most installation work during planned changeover or weekend windows — no impact on validated production state.
Validation Package Execution Week 7–12
URS, FS, DS, IQ, OQ, PQ delivered in parallel with the technical install. GAMP 5 risk assessment frames the depth of validation for each component. Audit trail and electronic signature workflows tested against real shifts.
Parallel-Run and Calibration Week 13–18
Real-time dashboard runs alongside manual reporting. Loss codes calibrated against real shifts. Operators trained on reason capture. Supervisors coached on Pareto drill-down. Plant manager dashboard reviewed weekly.
Pilot Operational Go-Live Week 19–22
Real-time becomes the source of truth on the pilot lines. Manual reporting either retired or relegated to backup. Daily and weekly reviews run off the live dashboard. First measurable OEE gains appear in this phase.
Asset-Class Roll-Out Month 6–12
Validated template applied to remaining lines in the same asset class, then extended to the next class. Each subsequent line takes 4–6 weeks not 18, because validation framework, integration patterns, and operator material are reusable.
Pharma OEE — Depth Questions
Why does asset-class matter more than vendor choice when selecting an OEE platform?
The loss profile on a tablet press has almost nothing in common with the loss profile on a cartoning line. A platform that handles tablet weight drift beautifully may be useless on insert-feeder reliability. Generic OEE software treats both the same and produces dashboards that operators ignore. Asset-class fit determines whether the dashboard gets used after week three.
Can the same dashboard be used by an operator and a plant manager?
No. They have different refresh rates, different spans of attention, different decisions to make, and different consequences for distraction. Force them onto the same screen and you compromise both. The four-persona model — operator, supervisor, plant manager, QA — is the minimum viable separation. Each role-based view reads from the same data path but presents only what that role needs.
How is the calculation engine validated under GAMP 5?
The OEE calculation logic is typically categorised as GAMP 5 Category 5 (custom code) because the formulas are tuned to your specific asset definitions, ideal cycle times, and loss code structure. Category 5 carries the highest validation effort — full functional specification, design specification, traceability matrix, and a PQ executed on real production. The presentation layer above the engine is typically Category 4 (configured product), with lower validation depth.
What happens during a 21 CFR Part 11 audit?
The auditor will want to see the audit trail for any supervisor-level change to OEE calculations, the electronic signature workflow for those changes, the role-based access control matrix, and the validation package for the OEE engine. A well-engineered system has each of these as a single click from the QA dashboard. A retrofitted system spends weeks pulling them together.
Will real-time OEE expose the plant to regulatory risk that did not exist before?
Only if the OEE system is configured to be GMP-relevant. In most deployments, OEE itself is a productivity metric, not a quality metric — the data path becomes GMP-relevant where it touches batch records or IPC results. The validation effort is targeted at those crossover points, not the entire dashboard. A well-scoped system increases visibility without increasing the validated surface area.
Do we need to buy NVIDIA AI servers separately?
No. The fully-loaded AI server is supplied pre-configured and pre-loaded with the role-based dashboards, validated calculation engines, audit-trail infrastructure, and asset-class templates. Rack it, connect power and Ethernet, and the system goes live. Cabling, gateway integration, MES and historian connectivity, validation package, operator training, and 24×7 remote monitoring are all included in the package.
What is the typical timeline from contract to first validated live shift?
Live in 6–12 weeks on the pilot line including the GAMP 5 validation package. Three-phase delivery: weeks 1–4 — asset-class selection, sensor and gateway install. Weeks 5–8 — validation execution, parallel-run start. Weeks 9–12 — go-live across the role-based dashboards. Plant-wide rollout typically completes within 9–12 months following the validated template.
The Right Asset Class. The Right Personas. The Right Validation.
Hardware + software bundle. Pre-configured NVIDIA AI server, racked and ready, pre-loaded with asset-class templates for tablet, capsule, blister, cartoning, and lyophilisation lines. GAMP 5 validation package, role-based dashboards, 21 CFR Part 11 audit trail, operator training, and 24×7 remote monitoring all included. Live in 6–12 weeks. Trusted by 1000+ industrial clients with 99.9% uptime.