On a 3-axis vertical machining center running a 14-minute aluminum housing cycle, the difference between 65% OEE and 82% OEE rarely shows up on the end-of-shift spreadsheet. It hides in a 9-second spindle ramp, a 4% feed override the operator dialed in at 2:14 PM, and a tool-change that ran 6 seconds long because the carousel index lagged. By the time the shift supervisor reads the production report at 7:00 AM, those losses have already compounded across 1,200 parts. Book a live OEE demo and we will show you exactly where your spindles are leaking — machine by machine, shift by shift.
See every loss on every spindle — the second it happens
iFactory connects directly to Fanuc, Siemens, and Haas controls plus MTConnect streams, calculating availability, performance, and quality losses live across every machining center. No clipboard. No end-of-shift reconciliation. No guessing whether the 12% performance gap was feed override, tool wear, or a sticking chip conveyor.
Where OEE leaks on a CNC line
OEE multiplies three ratios — availability, performance, quality. On a machining line, each pillar has its own characteristic leak pattern, and the leaks are rarely where the supervisor expects. Below is the loss map for a typical CNC cell running mixed aluminum and steel parts across two shifts.
Why manual OEE tracking fails on machining
The standard shop-floor OEE sheet captures downtime in 15-minute buckets. CNC losses happen in 4-second increments. The mismatch is not a rounding error — it is the entire gap between reported OEE and real OEE.
A 14-percentage-point gap between the shift report and the MTConnect stream is normal. That gap is where every CNC improvement initiative lives or dies — and it is exactly what iFactory closes by reading the control directly instead of asking the operator to translate their day into 15-minute boxes.
Live data capture from CNC controls
iFactory does not require retrofitting sensors on every machine. It reads the native protocol stream from the control and layers OEE logic on top. Below is the connection map for a typical mixed-brand cell.
The edge gateway stays inside your plant network — no machine data leaves the building unless you explicitly route it. From the gateway, iFactory's on-prem NVIDIA AI server processes the stream, calculates OEE per spindle, and pushes updates to dashboards in under two seconds. ERP and MES integration happens through a REST API, so part numbers, work orders, and BOMs stay synchronized without double entry.
The real-time OEE dashboard
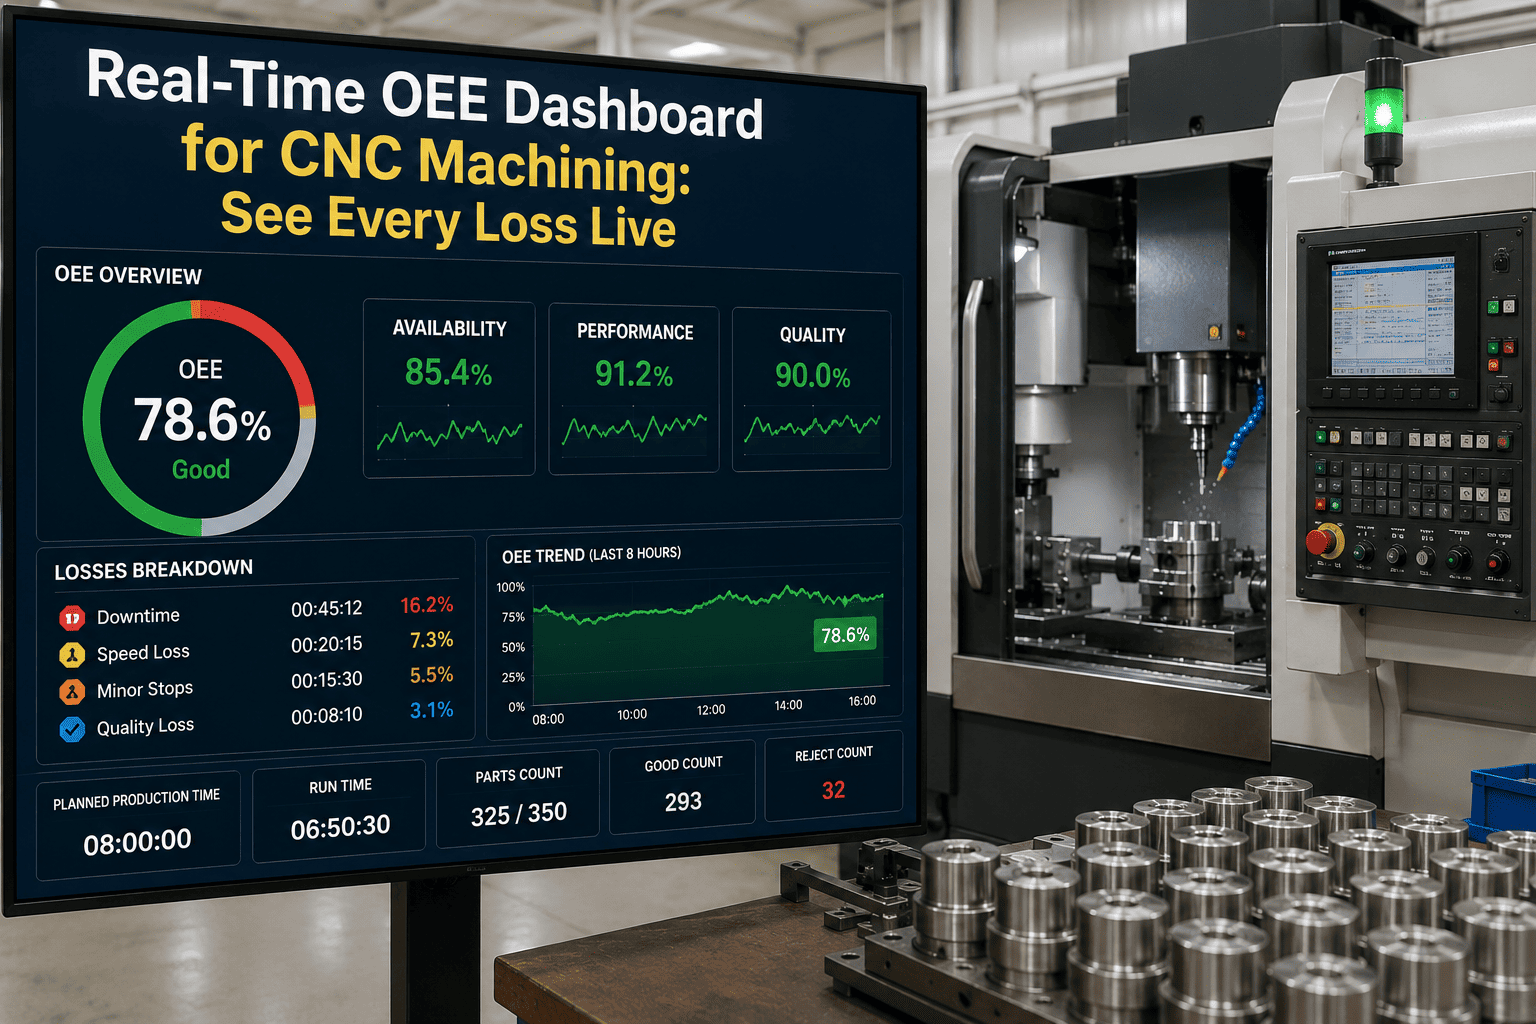
The dashboard is built around one principle: a supervisor should see which spindle is losing OEE right now, why, and against what benchmark — in a single glance. Below is the layout iFactory deploys for CNC cells.
Dashboards embed into any existing portal — Microsoft Teams, SharePoint, your MES, or a wall-mounted shop-floor display. The same data feeds the AI assistant, so an operator can ask "why did VMC-03 drop?" and get an answer in plain language instead of digging through alarm logs.
Root cause and tool-life correlation
The hardest OEE loss to catch on a CNC line is the slow one: tool wear degrading surface finish over 200 parts until scrap spikes at 3:00 AM. iFactory correlates tool-life counters, spindle load trends, and quality outcomes so you see the drift before it becomes scrap.
The AI learns each tool's wear curve per material and part program. When remaining life crosses the knee point, it fires a replacement recommendation — not at a fixed cycle count, but at the actual inflection where scrap risk accelerates.
Most shops swap tools at a fixed cycle count. Too early wastes tool life; too late generates scrap. Either way, the loss is invisible until the quality report arrives the next morning.
Operator-to-AI: why did VMC-02 slow down?
When a supervisor sees a performance dip on the dashboard, they should not have to walk the floor and interrogate the control. They ask the AI. Here is a real exchange from a customer cell running aluminum housings.
Operator J. Martinez dialed feed override from 100% to 88% at 14:06, on part 47 of program HOUSING-A2. This followed a surface-finish reject on part 46 — likely a tool-wear compensation. Tool T07 life is at 31% remaining, which is in the wear knee zone.
Recommendation: Replace T07 now. Expected performance recovery: +9 points. Projected scrap avoided: 4-6 parts over the next 50 cycles.
VMC-03 T07: 58% remaining, normal curve.
VMC-02 T07: 31% remaining — 22 points below the cell average at the same cycle count. This tool is wearing 1.7x faster. Likely cause: harder material lot on the current work order. Recommend flagging lot 4471-B for hardness verification.
The AI assistant runs on the on-prem NVIDIA AI server — no conversation leaves your plant network. It has read access to every machine stream, the ERP work order, and the tool-life database, so its answers are grounded in your shop's actual data, not a generic model. Talk to support about a pilot on your cell.
Setup and changeover optimization
On mixed-variant CNC cells, setup and changeover is the single largest availability loss — often 30-50 minutes per swap. iFactory breaks every changeover into timed sub-steps so you can see exactly where the minutes go, and benchmark the fastest operator against the slowest.
The 19-minute gap between the fastest and slowest operator is not a training problem — it is a method problem. iFactory surfaces the method difference so the cell lead can standardize the best practice, not just tell everyone to "hurry up."
Benchmarks and rollout roadmap
OEE numbers are meaningless without a benchmark. iFactory ships with cross-machine, cross-cell, and cross-part-number benchmarking out of the box, so you always know whether 72% is good or bad for that part on that machine.
| Machine | Part Number | OEE (this week) | Cell avg | Best-in-class | Gap |
|---|---|---|---|---|---|
| VMC-01 | HOUSING-A2 | 71% | 64% | 78% | -7% |
| VMC-02 | HOUSING-A2 | 58% | 64% | 78% | -20% |
| VMC-03 | BRACKET-B7 | 69% | 66% | 74% | -5% |
| LATHE-01 | SHAFT-C1 | 82% | 75% | 85% | -3% |
| LATHE-02 | SHAFT-C1 | 68% | 75% | 85% | -17% |
VMC-02 and LATHE-02 are the cell's outliers — both running the same part as a better-performing neighbor. That comparison is the starting point for every improvement sprint.
Over 1000 industrial clients have deployed iFactory on this roadmap. The on-prem AI server runs at 99.9% uptime — your OEE data stays available even if the corporate network goes down.
FAQ
Book a demo on your own CNC cell
In 30 minutes, we will connect to one of your machines via MTConnect, show you the live OEE dashboard, and pinpoint the top three losses on that spindle. No slide deck. No generic pitch. Your machines, your data, your losses — on screen.