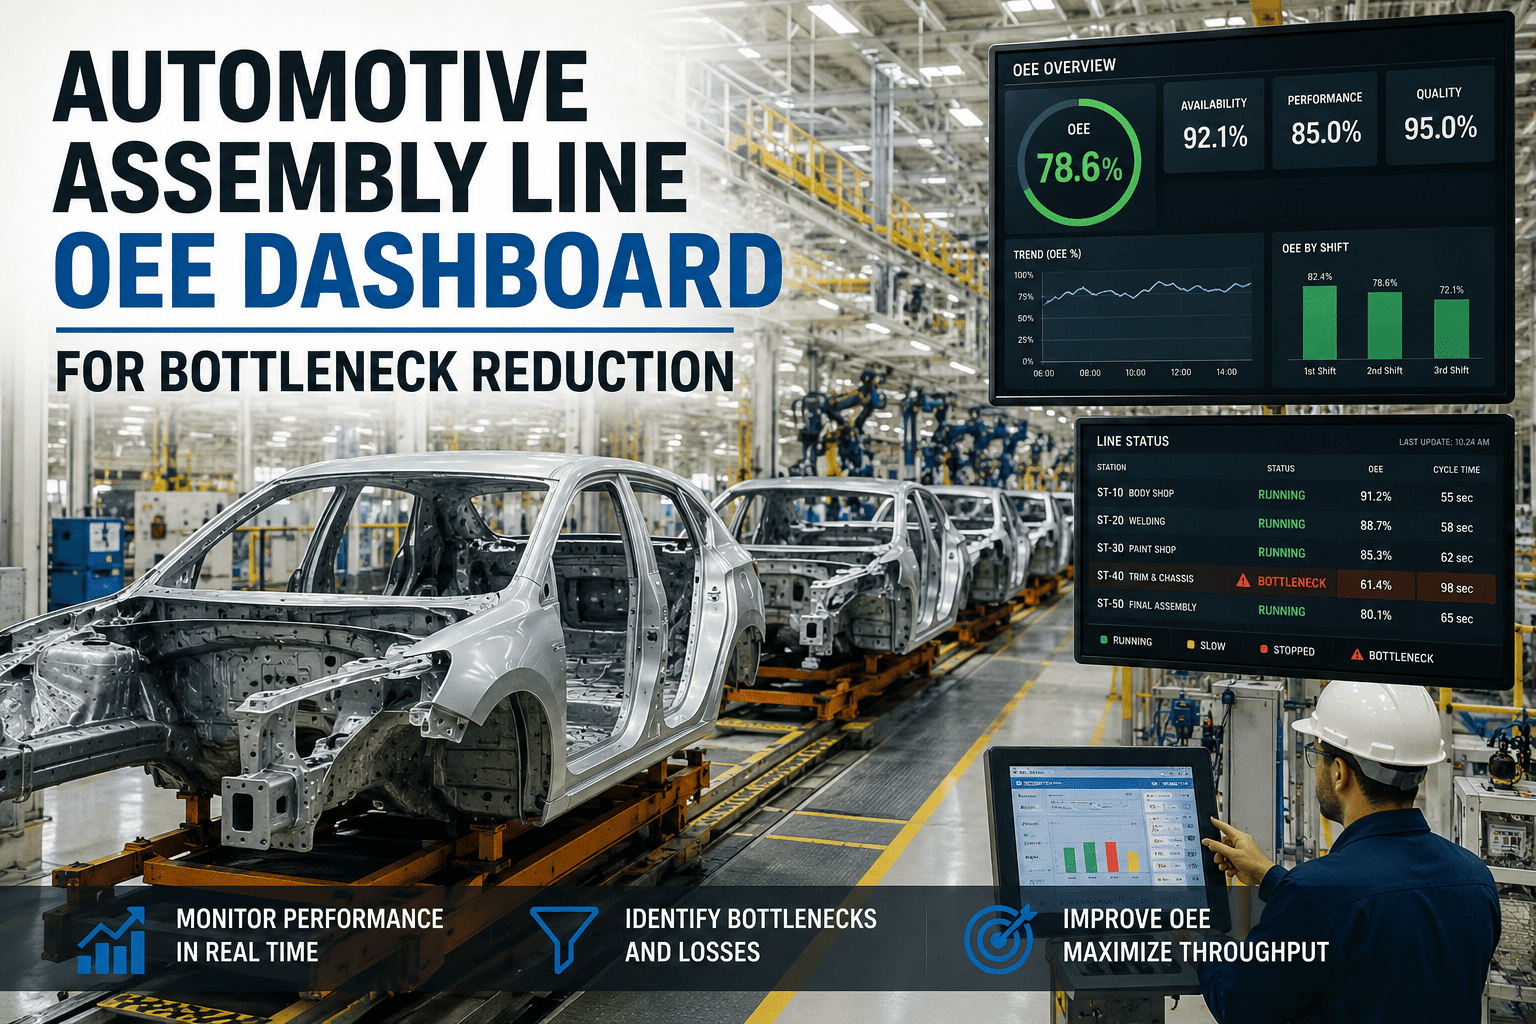
In the high-stakes world of automotive manufacturing, even a minute of unplanned downtime on an assembly line can cascade into thousands of dollars in lost revenue and delayed deliveries. As production complexity increases with the rise of electric vehicles and advanced driver-assistance systems, manufacturers are under immense pressure to maximize Overall Equipment Effectiveness (OEE). Traditional manual tracking methods are no longer sufficient. They provide fragmented data, delayed insights, and often miss critical bottlenecks that silently erode throughput. This is where a modern, AI-powered OEE dashboard becomes indispensable. By integrating real-time data from PLCs, sensors, and MES systems, an automotive OEE dashboard offers a unified view of availability, performance, and quality metrics. It transforms raw production data into actionable intelligence, enabling teams to pinpoint exactly where losses occur and why. For automotive manufacturers striving for lean operations and zero defects, investing in a robust OEE analytics platform is not just an option, it is a strategic imperative. Book a Demo of iFactory to see how our AI dashboards can revolutionize your assembly line monitoring.
Real-Time OEE Visibility for Automotive Assembly Lines
Identify bottlenecks instantly, reduce downtime, and boost throughput with AI-driven analytics.
Availability Tracking
Monitor planned vs unplanned downtime across every station. iFactory automatically distinguishes between changeovers, maintenance, and breakdowns, giving you a clear picture of asset utilization. With real-time alerts, you can respond to availability losses before they impact downstream processes.
Performance Monitoring
Track actual cycle times against ideal cycle times for each assembly operation. iFactory highlights slow-running stations and micro-stops that reduce performance. Our AI models predict performance degradation, enabling proactive adjustments to maintain optimal line speed.
Quality Analytics
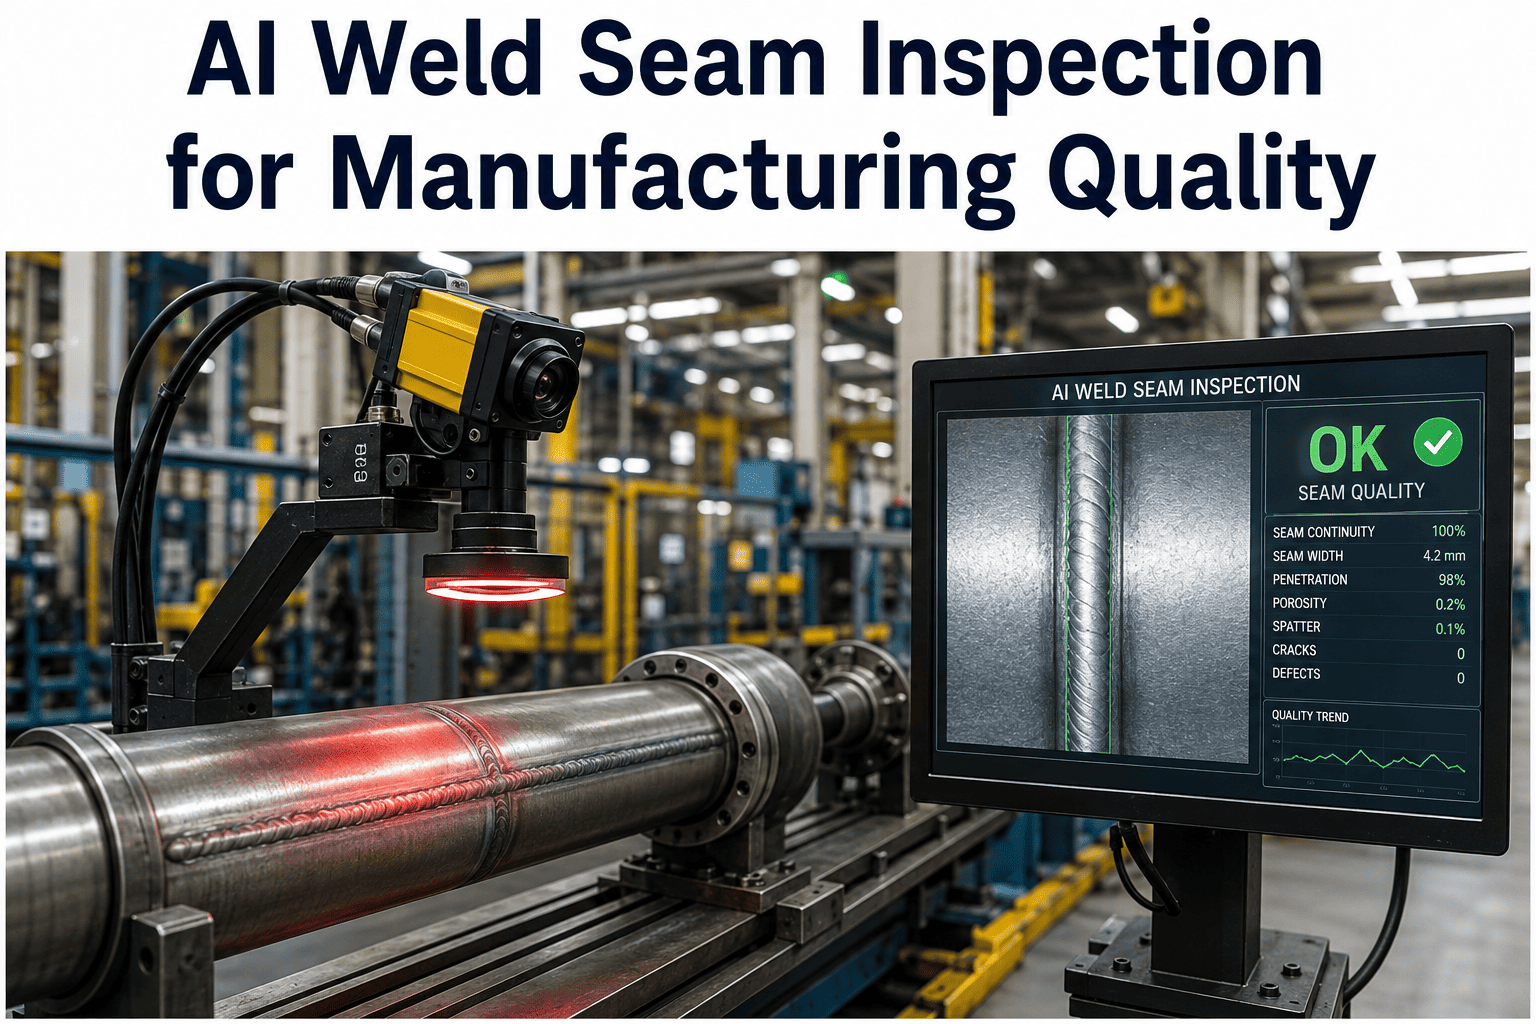
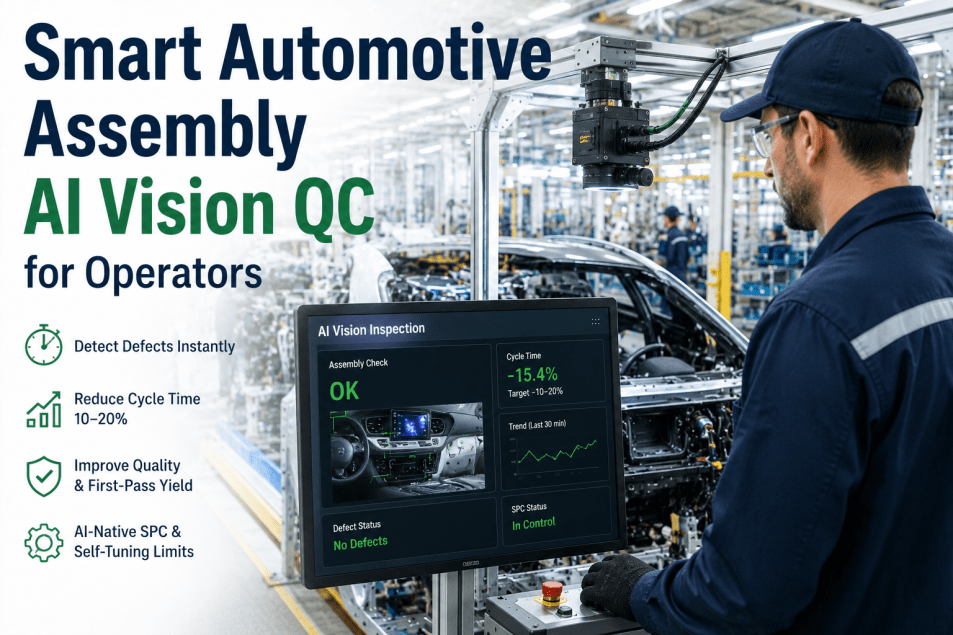
Detect defects in real-time during weld inspection, paint application, and final assembly. iFactory integrates with vision systems and test equipment to calculate First Pass Yield (FPY) and scrap rates. Quality losses are automatically categorized, helping you reduce rework and warranty claims.
Bottleneck Identification
Using advanced algorithms, iFactory pinpoints the exact station or process that is constraining your line. The dashboard visualizes queue lengths, wait times, and blockage durations. With this data, you can simulate changes and implement targeted improvements to maximize throughput.
Transform Your Production Data into Actionable Insights
Stop guessing where your losses are. Start eliminating them with precision. iFactory gives you the visibility and control to achieve world-class OEE.
How iFactory Optimizes Your Assembly Line
Connect and Ingest
Seamlessly connect to PLCs, sensors, robots, and MES systems. iFactory's connectors support OPC-UA, Modbus, MQTT, and REST APIs, ensuring all production data is captured in real time. No manual data entry required.
Analyze and Visualize
The AI engine processes data to calculate OEE, availability, performance, and quality metrics. Interactive dashboards display trends, heatmaps, and Pareto charts. Drill down into any metric to see root causes.
Alert and Act
Configure threshold-based alerts for downtime events, quality deviations, and performance drops. iFactory sends notifications via email, SMS, or Slack, enabling rapid response. Automated workflows can trigger maintenance tickets or adjust line settings.
Improve and Sustain
Use historical data and AI predictions to identify improvement opportunities. Run what-if scenarios to evaluate changes before implementation. Track the impact of kaizen events and sustain gains over time.
Key OEE Metrics for Automotive Assembly
| Metric | Description | Industry Benchmark | iFactory Impact |
|---|---|---|---|
| Availability | Percentage of scheduled time the line is running | 90% | +8% |
| Performance | Actual speed vs ideal speed | 85% | +10% |
| Quality | Good units produced vs total units started | 95% | +4% |
| OEE | Overall Equipment Effectiveness | 75% | +15% |
| MTBF | Mean Time Between Failures | 300 hours | +40 hours |
| MTTR | Mean Time To Repair | 45 min | -12 min |
Frequently Asked Questions
What is OEE and why is it critical for automotive assembly lines?
How does iFactory help reduce bottlenecks in automotive assembly?
Can iFactory integrate with existing automotive manufacturing systems?
What types of automotive production losses does iFactory detect?
How does iFactory support continuous improvement (Kaizen) in automotive plants?
Ready to Achieve World-Class OEE in Your Automotive Plant?
Join leading automotive manufacturers who trust iFactory to optimize their assembly lines. Get real-time visibility, eliminate bottlenecks, and boost profitability.


.png)
.png)