If your maintenance team can't tell you the MTBF of your top 10 critical assets in under 60 seconds, you're not running a reliability program — you're running a reactive firefighting operation dressed up in a spreadsheet. Every percentage point of PM compliance you lose costs roughly $80,000 per year in unplanned downtime for a mid-sized plant. Every hour added to MTTR cascades through OEE, throughput and customer commitments. The plants winning in 2026 aren't tracking more metrics — they're tracking the right 15, in real time, with automated drill-down to root cause. Book a free maintenance KPI audit with iFactory engineers →
Reliability Is a Measurement Discipline — Not a Maintenance Department
U.S. manufacturers losing 5–20% of production capacity to unplanned downtime share one root cause: they measure activity, not outcomes. The 15 KPIs in this guide separate leading from lagging indicators, define world-class benchmarks, and connect each metric to the operational decision it should drive. Tracked together inside a CMMS or EAM platform, they form the closed-loop reliability framework that converts maintenance from a cost center into a margin-protection function.
Why Maintenance KPIs Decide Whether Your Plant Compounds or Decays
Maintenance KPIs are the measurable indicators that translate equipment behavior into business decisions. They answer four questions every plant manager must answer weekly: Is my equipment getting more or less reliable? How fast do we recover when it fails? Are we maintaining proactively or reacting to breakdowns? And what is reliability costing us per unit produced? Without these numbers, every maintenance investment is a guess and every reliability claim is anecdotal. With them, maintenance becomes a forecasting function — predicting failures, scheduling interventions, and protecting throughput before it's lost.
The 2026 distinction between high-performing and average plants is no longer whether they track KPIs — almost everyone claims to. The distinction is whether they track leading indicators alongside lagging ones, whether the data updates in real time from work-order systems, and whether each KPI is tied to a decision threshold that triggers action. Plants that review month-old spreadsheet KPIs in a Tuesday meeting are documenting failure. Plants that surface KPI drift in real-time dashboards are preventing it.
Leading vs. Lagging Indicators: The Distinction That Changes Strategy
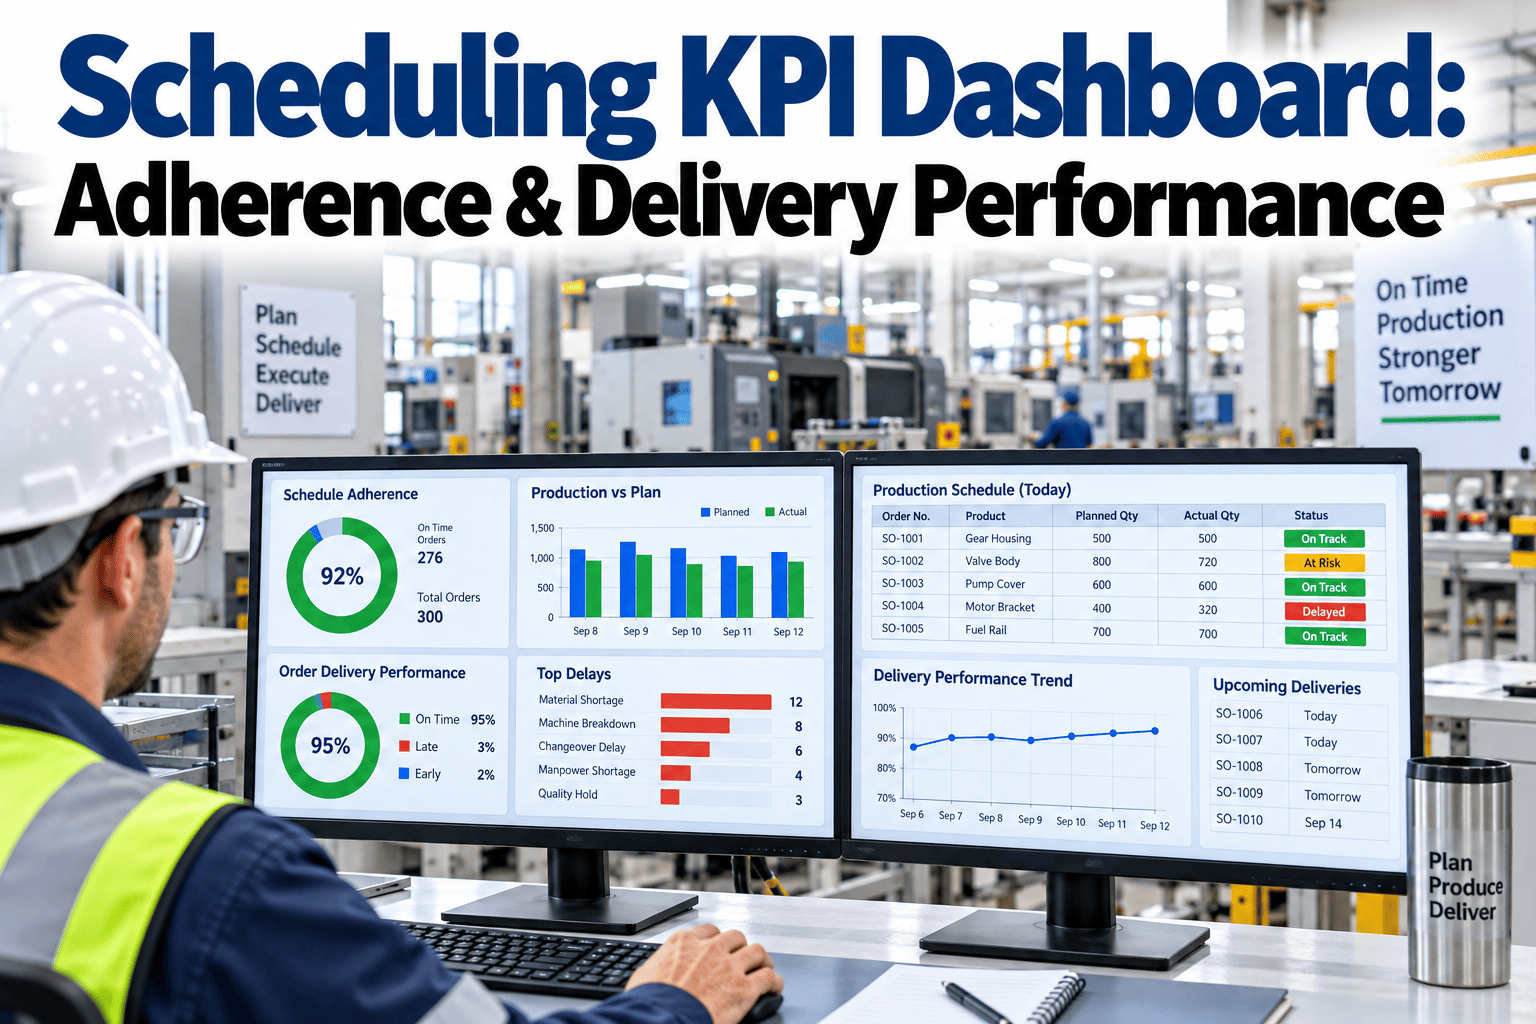
Every maintenance KPI falls into one of two categories, and confusing them is the most expensive mistake reliability programs make. Lagging indicators — MTBF, MTTR, downtime hours, total maintenance cost — measure what already happened. They are essential for trend analysis and executive reporting, but you cannot change yesterday's failure by staring at last month's MTBF. Leading indicators — PM compliance, schedule adherence, backlog age, wrench time — predict what will happen next. When leading indicators improve, lagging indicators follow within 60–120 days. A program that tracks only lagging metrics is permanently reactive.
- MTBF — equipment reliability outcome
- MTTR — repair speed outcome
- Asset Availability — uptime outcome
- OEE — production efficiency outcome
- Maintenance Cost % of RAV — financial outcome
- Unplanned Downtime Hours — disruption outcome
- PM Compliance — proactive discipline
- Schedule Adherence — planning quality
- Backlog Week-Supply — workload balance
- Wrench Time — workflow efficiency
- Planned vs. Reactive Ratio — strategy mix
- Work Order Aging — execution velocity
Plants that balance both tiers cut unplanned downtime by 30–45% within two quarters. Book a demo to see how iFactory surfaces leading indicators alongside lagging ones on a single dashboard.
The 15 Maintenance KPIs That Actually Prove Reliability Is Improving
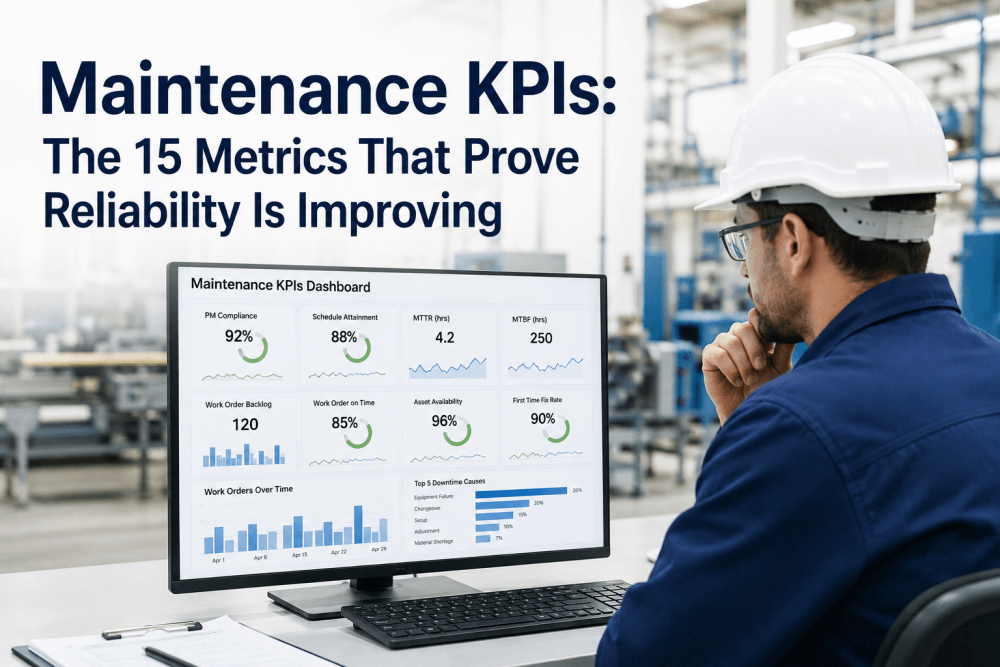
The metrics below are organized into four tiers — reliability, execution, financial, and asset-level — covering the full closed loop from equipment health to financial outcome. Each KPI includes its formula, world-class benchmark, and the decision it should drive when it crosses a threshold. Book a demo to see all 15 surfaced live in the iFactory CMMS dashboard against your own asset data.
| # | KPI | Formula | World-Class Benchmark | Decision Trigger |
|---|---|---|---|---|
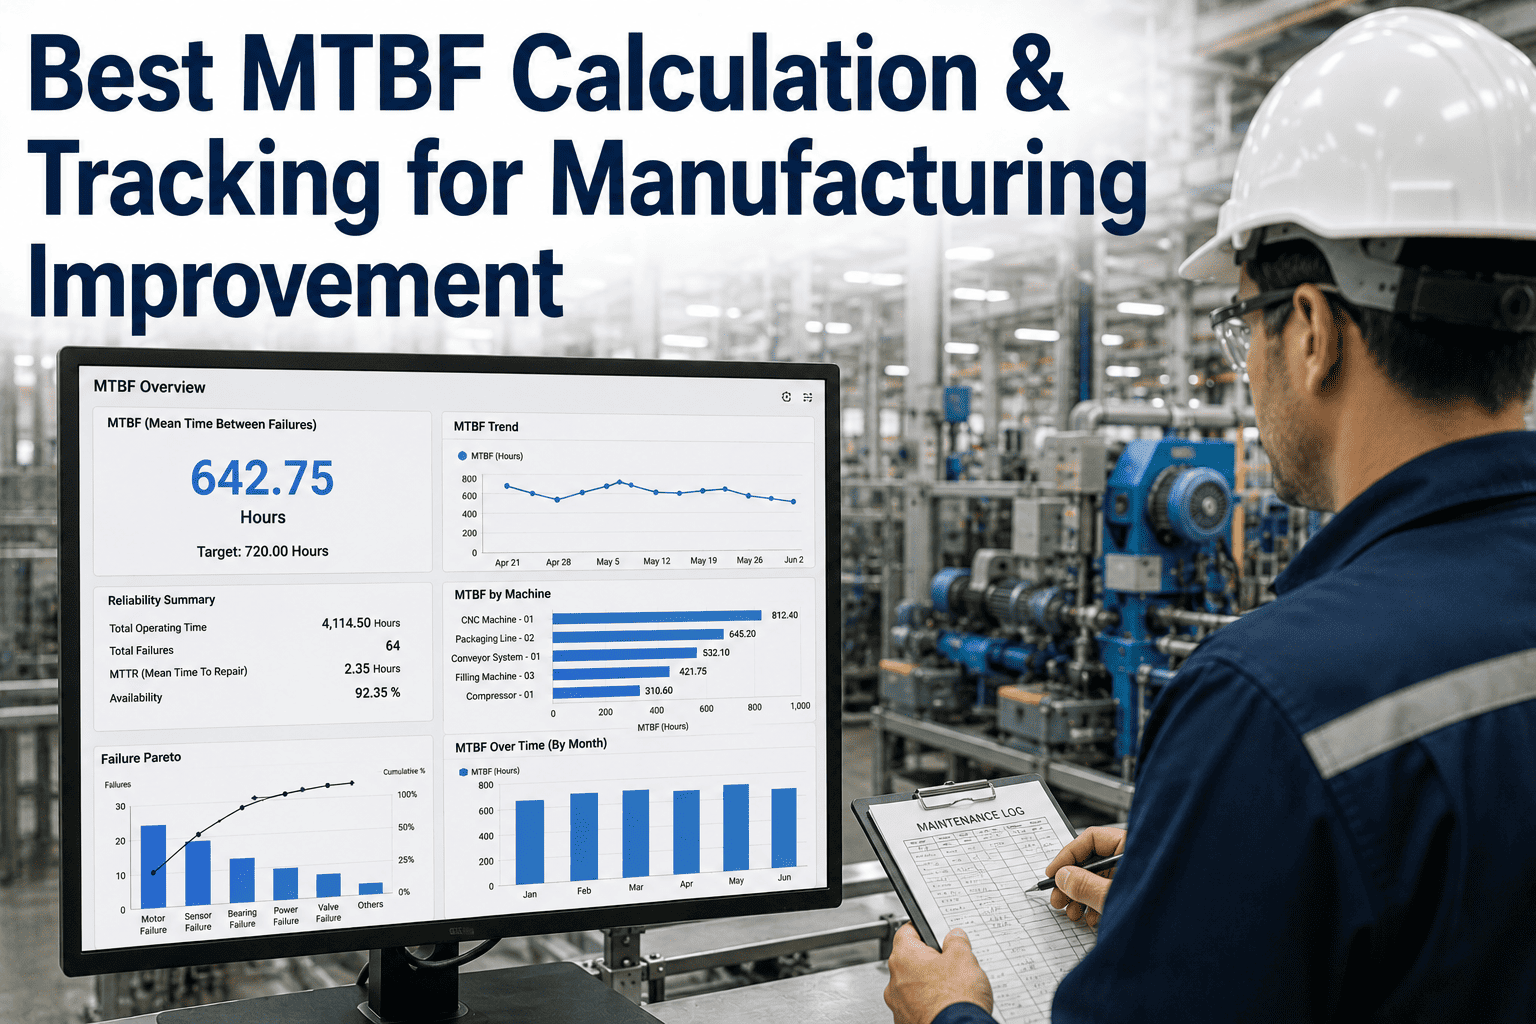
| 1 | MTBF | Operating hours ÷ failures | Asset-class specific; trend up month-over-month | Declining 3 months → reassess PM scope |
| 2 | MTTR | Total repair time ÷ repair events | Under 4 hours for most assets | Over 6 hours → audit parts, SOPs, training |
| 3 | Asset Availability | (Uptime ÷ scheduled time) × 100 | 95%+ for critical assets | Below 90% → critical reliability review |
| 4 | OEE | Availability × Performance × Quality | 85%+ world-class; 60% industry avg | Drop 5+ points → loss-cause analysis |
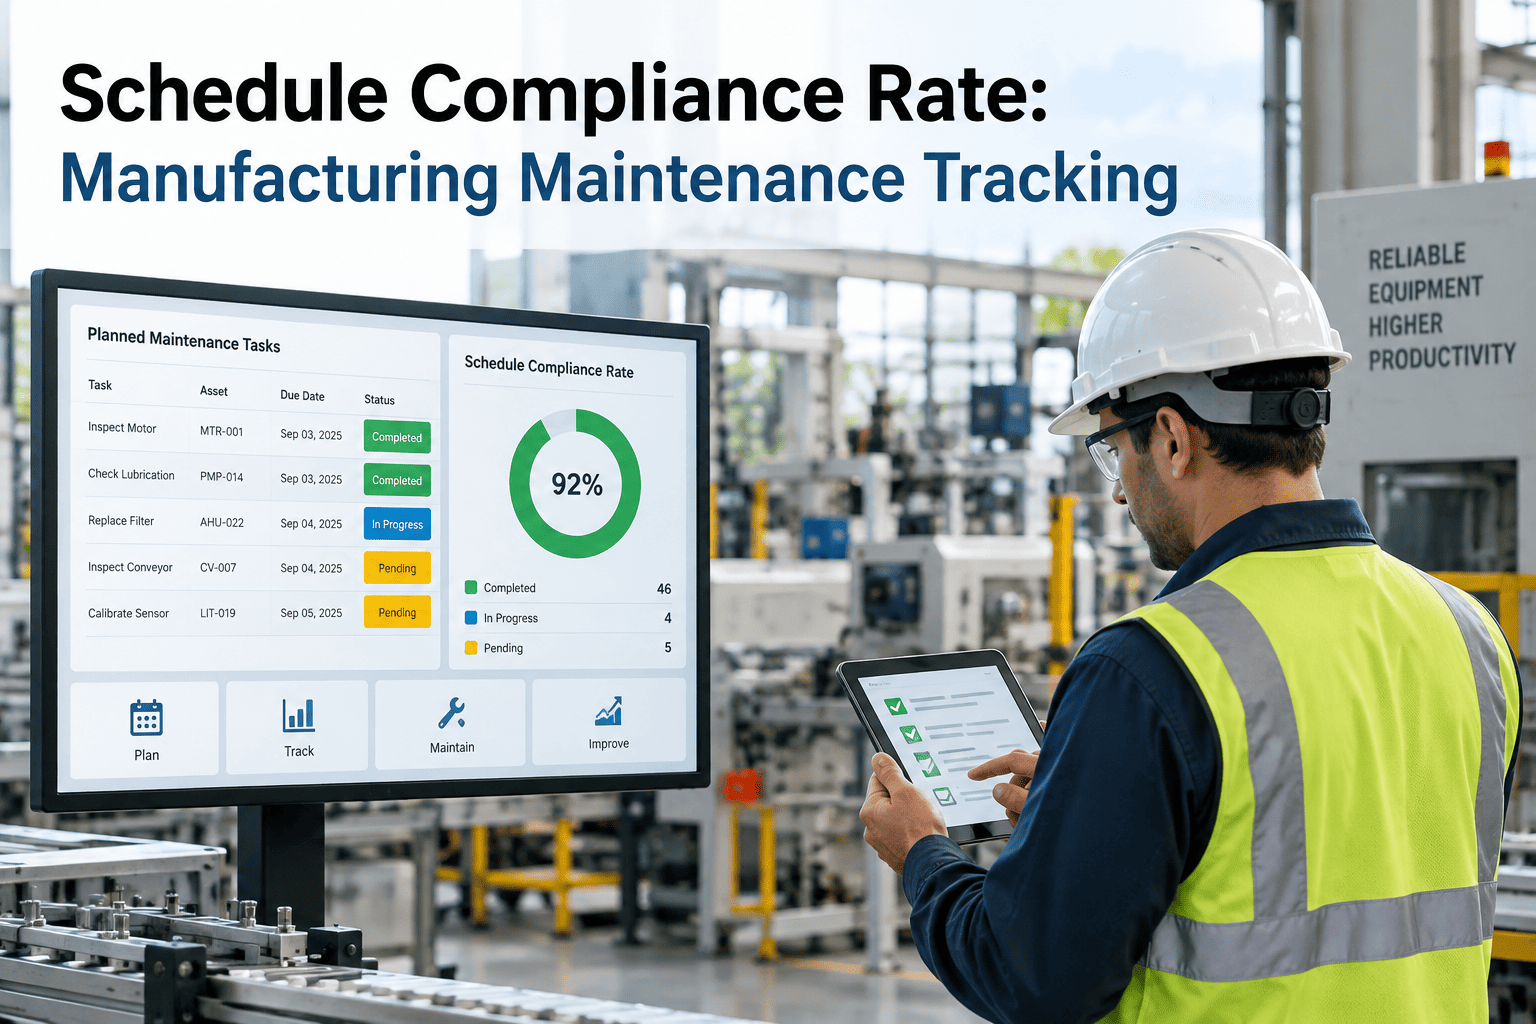
| 5 | PM Compliance | PMs completed on time ÷ PMs scheduled | 90%+ (within 10% interval window) | Below 85% → expect MTBF decline in 60–90 days |
| 6 | Schedule Adherence | Scheduled work completed ÷ planned | 85%+ attained | Below 70% → planning process is broken |
| 7 | Planned Maintenance % | Planned hours ÷ total maint. hours | 80%+ planned, under 20% reactive | Below 70% → firefighting mode |
| 8 | Wrench Time | Actual repair time ÷ technician shift | 50%+ on tools | Below 35% → fix kitting, mobile, parts staging |
| 9 | Backlog Week-Supply | Total backlog hours ÷ weekly capacity | 4–6 weeks | Over 8 weeks → work not closing; under 2 → no runway |
| 10 | Emergency Work % | Emergency WOs ÷ total WOs | Under 10% | Over 20% → reliability program failing |
| 11 | Maint. Cost % of RAV | Annual maint. cost ÷ replacement asset value | 2–4% for manufacturing | Over 5% → aging fleet or reactive culture |
| 12 | Maint. Cost / Unit | Total maint. cost ÷ units produced | Trend down quarter-over-quarter | Rising while volume stable → cost leak |
| 13 | Spare Parts Inventory Turnover | COGS of parts ÷ avg inventory value | 2–4 turns/year for MRO | Below 1 → obsolete stock; above 6 → stockout risk |
| 14 | Mean Time To Detect (MTTD) | Avg time from anomaly to alert | Under 15 minutes with IoT sensors | Hours-long detection → invest in condition monitoring |
| 15 | Overdue PM Aging | Days past scheduled completion | Zero PMs over 7 days late | Any PM over 14 days → reliability risk |
The KPI Maturity Curve: Where Your Plant Sits Today
Reliability programs don't jump from spreadsheets to predictive AI overnight. They move through a measurable maturity curve — and knowing your current stage is the single most important diagnostic before investing in new tools. The four-stage progression below maps the typical journey from reactive to prescriptive maintenance, with the KPI capability and business outcome at each level. Book a demo to benchmark your facility against this curve in a 30-minute working session.
The 6 Most Common KPI Tracking Mistakes — And How to Avoid Them
Tracking the right KPIs incorrectly is worse than not tracking them at all — it creates false confidence that masks deteriorating reliability. These are the six mistakes that consistently appear in maintenance audits across U.S. manufacturing plants, with the corrective discipline for each. Book a demo to get an audit-ready KPI configuration that prevents every mistake on this list.
How iFactory AI Turns 15 KPIs Into One Decision Loop
Tracking 15 metrics in spreadsheets compounds work; tracking them in iFactory AI compounds insight. The platform's CMMS and EAM modules calculate every KPI in real time from work-order, asset, and IoT sensor data — then surface drill-downs, automated alerts, and role-specific dashboards so every level of the organization sees what they can act on. Plant managers see availability and cost. Maintenance supervisors see backlog and schedule adherence. Technicians see wrench time and overdue PMs on mobile. Book a demo to see your own assets mapped to this framework.
- All 15 KPIs updated from live work-order data
- Asset-level drill-down on every metric
- Role-based views for executives, managers, technicians
- 30 / 90 / 365-day trending with anomaly highlight
- PM compliance under 85% → supervisor escalation
- MTTR exceeds 4 hours → root-cause workflow
- Backlog crosses 8 weeks → capacity planning alert
- Overdue PM beyond 14 days → reliability risk flag
- AI flags KPIs trending toward failure thresholds
- 14–21 day predictive failure lead time on critical assets
- "Downtime Prevented" metric for proactive reporting
- Prescriptive recommendations on PM scope adjustments
"The KPI Itself Is Worthless. The Decision It Triggers Is Everything."
In our work with U.S. manufacturers across automotive, food & beverage, and discrete assembly, the pattern is consistent: plants that fail to improve reliability are almost never short on data. They're short on the discipline of connecting each KPI to a pre-defined decision threshold and an owner. A 92% PM compliance number sitting in a Tuesday review deck doesn't reduce downtime — but the same number triggering an automated workflow when it drops to 84% does. The fastest reliability gains we see come not from new sensors or new software, but from defining the threshold and owner for every metric on the dashboard before adding a single new measurement. The 15 KPIs in this guide are not aspirational. They're the minimum viable scoreboard. The work begins after the dashboard is live.
Conclusion: Build the Dashboard, Then Build the Discipline
The 15 KPIs in this guide are not a menu — they are a closed-loop system. Leading indicators (PM compliance, schedule adherence, wrench time, backlog) predict the lagging outcomes (MTBF, MTTR, availability, OEE), which in turn drive the financial metrics (cost per unit, maintenance % of RAV). Skipping any tier breaks the loop. Tracking them in spreadsheets breaks the velocity. The plants that will win on margin and reliability in 2026 are the ones treating their maintenance KPI dashboard as the most important operating document in the facility — reviewed weekly at the supervisor level, monthly at the plant-manager level, and quarterly at the executive level, with thresholds, owners, and actions defined for every metric before the report is generated.
iFactory AI provides the integrated CMMS, EAM, and predictive maintenance platform that makes this closed loop possible without a six-month implementation. Every KPI in this guide is calculated automatically, drilled down by asset, and escalated when it crosses a threshold — so your team manages reliability instead of compiling reports about it.
iFactory engineers will benchmark your current maintenance KPIs against world-class targets, identify the 3 leading indicators most likely to unlock reliability gains in 60–90 days, and map your assets into a live dashboard. Most audits complete in one week and surface $200K+ in recoverable downtime cost.