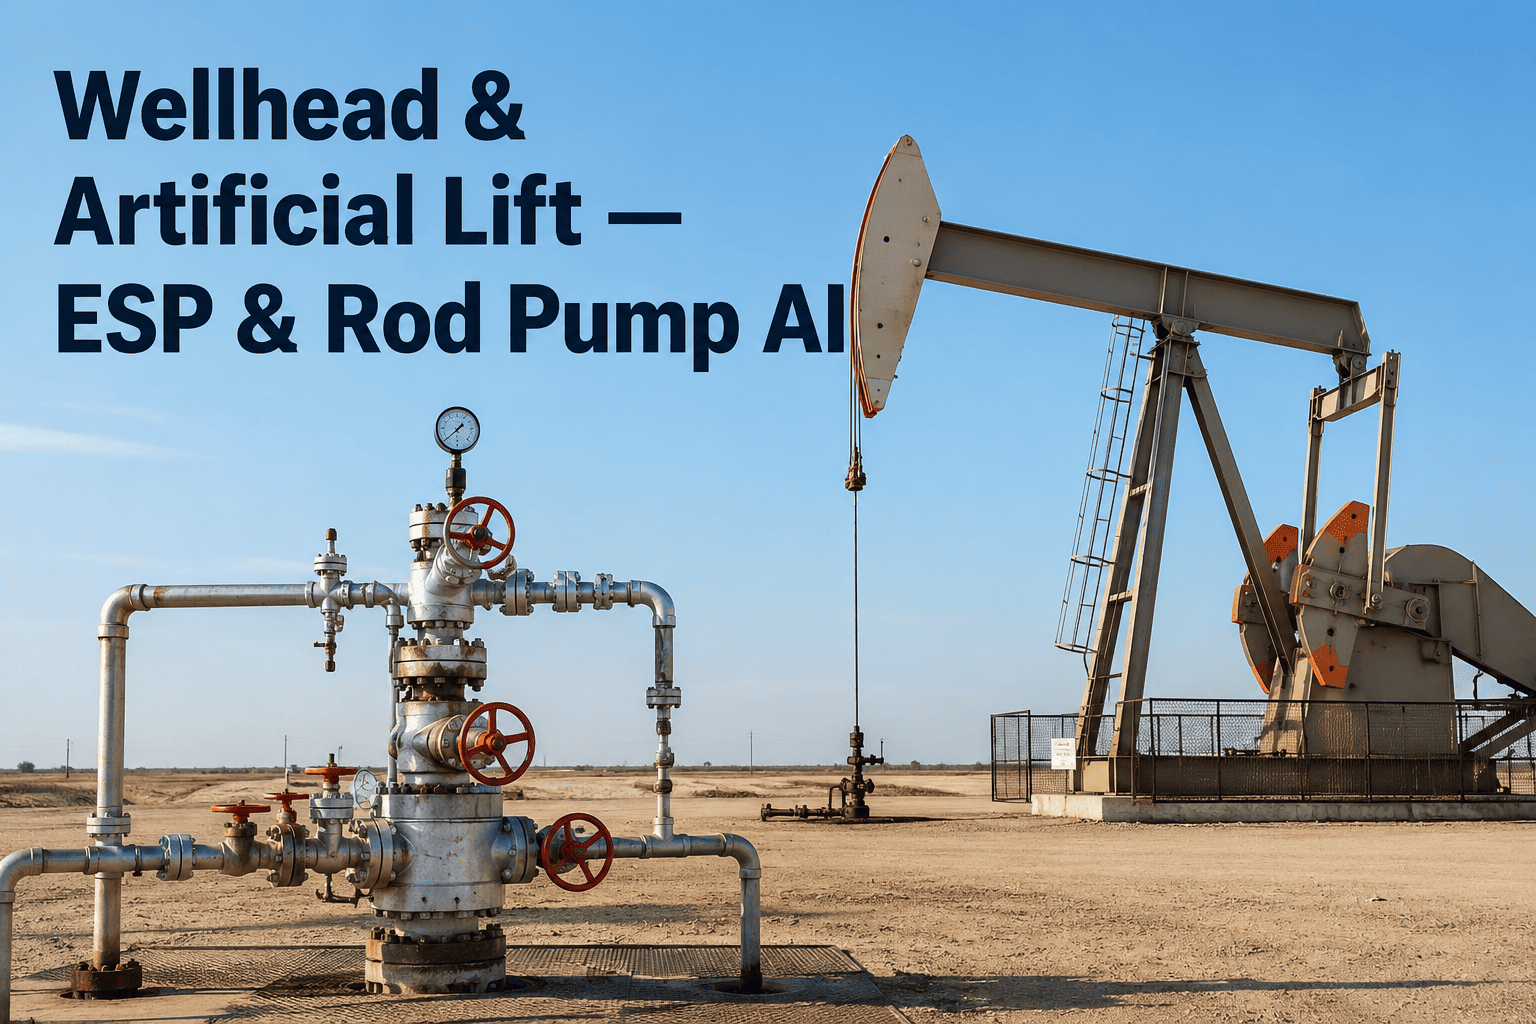
A well that has moved past natural flow into artificial lift enters a different kind of production math — one where the pump itself becomes the variable most likely to determine whether a well hits its production target or quietly underperforms for months before anyone notices. Whether it's an ESP running outside its optimal frequency range or a rod pump with a dynamometer card nobody has looked at in weeks, the gap between actual and achievable production on a lifted well is almost always a monitoring gap first and a mechanical problem second. Operators running artificial lift across a multi-well field can book a demo to see how continuous monitoring closes that gap well by well.
Two Lift Methods, One Shared Blind Spot
Electric submersible pumps and sucker rod pumps fail differently, get monitored differently, and get optimized by entirely different teams in most operations — but they share the same underlying problem. Both generate a continuous stream of diagnostic data that, left unwatched, becomes noise instead of an early warning system. ESP current signature, motor temperature, and intake pressure tell the same kind of story that a rod pump dynamometer card tells, just in a different dialect. AI-based artificial lift optimization reads both dialects continuously, translating raw sensor data into a single production uplift recommendation regardless of lift type.
Best for high-volume wells. Monitoring priority: motor current signature, intake pressure, vibration, and frequency drift against VSD setpoint.
Best for lower-volume, stripper wells. Monitoring priority: dynamometer card shape, pump-off timing, and rod string load trends.
Reading an ESP Current Signature Like a Diagnostic Report
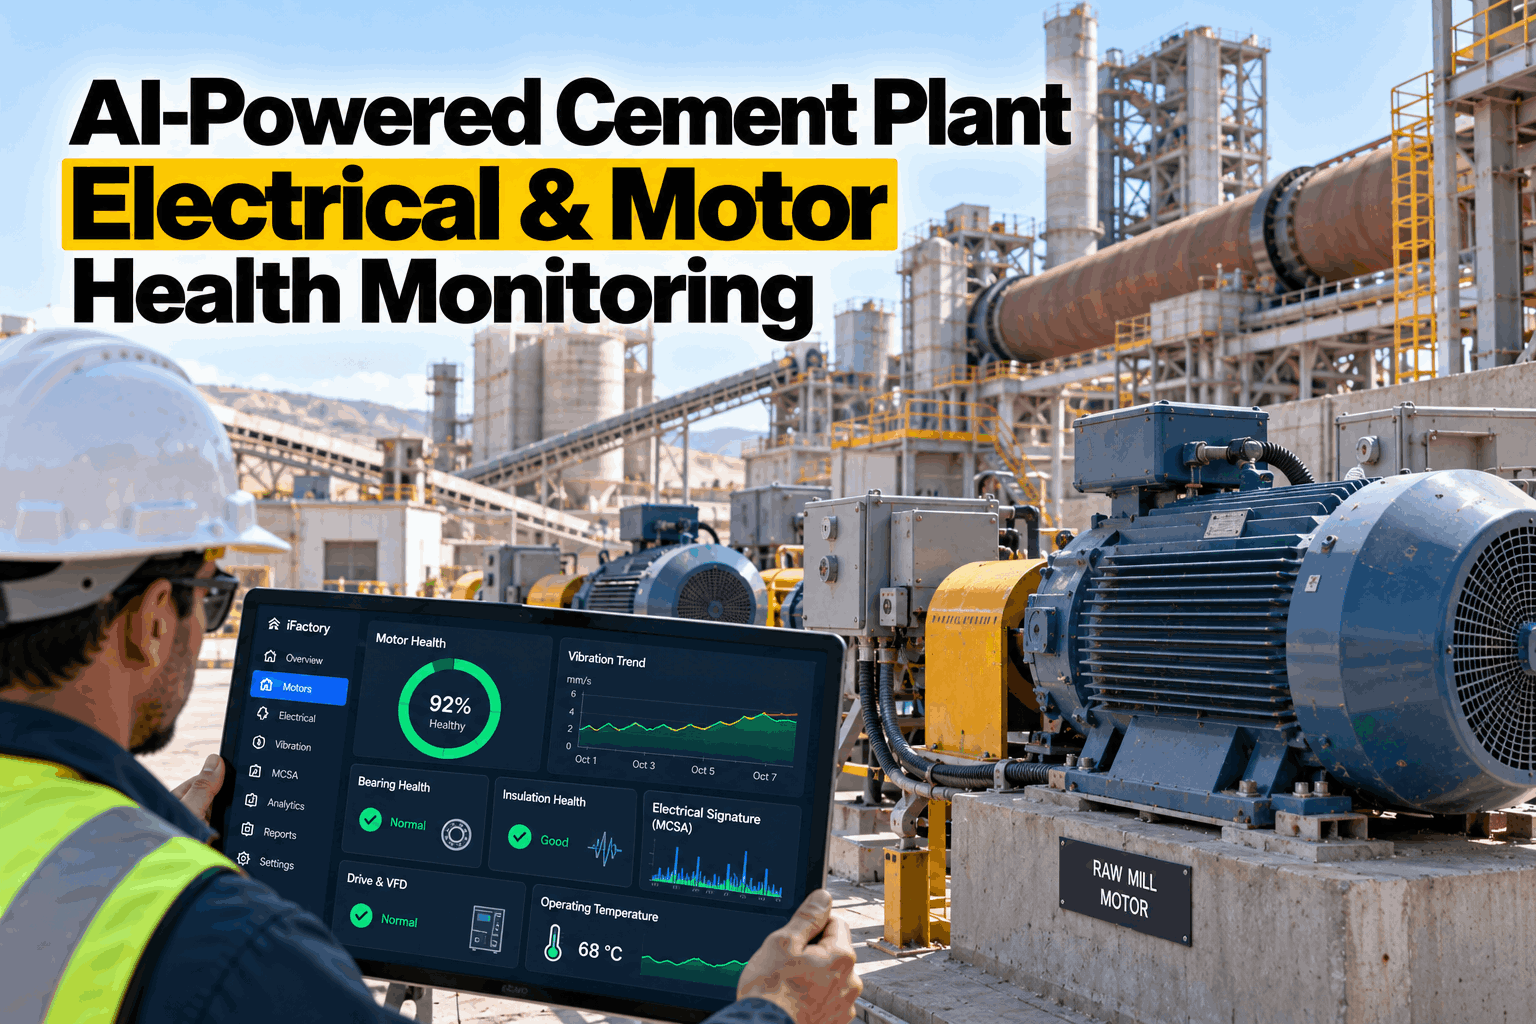
ESP electric submersible pump monitoring lives or dies on how well the current signature is interpreted. A healthy ESP shows a stable, narrow current band; a degrading one shows widening variance long before the pump actually trips offline. Wellhead monitoring AI trained on current signature patterns can distinguish between gas interference, scale accumulation, and bearing wear from the shape of the current trace alone — a distinction that used to require a field visit and a downhole gauge pull to confirm.
Widening variance band is the earliest indicator of mechanical degradation, often visible weeks before failure.
Declining intake pressure relative to reservoir model signals gas interference or insufficient submergence.
Gradual temperature rise at constant load indicates cooling flow restriction or bearing friction increase.
Comparing frequency setpoint against actual production reveals whether the pump is running outside its efficient operating range.
Dynamometer Card Analysis, Automated
Rod pump dynamometer analysis has historically depended on an experienced pumper reading card shapes by eye — recognizing a fluid pound pattern, a gas interference card, or a worn traveling valve from the curve alone. That expertise doesn't scale across a field of two hundred wells with a handful of pumpers covering all of them. AI-based dynamometer analysis classifies card shape automatically and flags the wells that need attention first, turning tribal knowledge into a repeatable, field-wide process. Book a demo to see automated card classification running against your own rod pump fleet.
| Dynamometer Card Pattern | Likely Cause | Recommended Action | Production Impact |
|---|---|---|---|
| Fluid pound | Pump running faster than well can supply fluid | Reduce strokes per minute | High |
| Gas interference | Free gas entering pump barrel | Adjust intake depth or add gas separator | Medium |
| Worn traveling valve | Valve leakage reducing displacement | Schedule workover | High |
| Rod parting risk | Excessive peak polished rod load | Reduce stroke length or SPM | Very High |
| Tubing movement | Anchor slippage | Inspect and reset tubing anchor | Medium |
Production Allocation and the Case for Continuous Well Testing
Well production allocation is only as accurate as the test data feeding it, and most fields still run periodic well tests every 30 to 60 days — a cadence that misses every production swing that happens in between. Combining wellhead flowing pressure, artificial lift diagnostics, and downhole pressure gauge data into a continuous virtual metering model closes that gap without requiring a physical test separator on every well. This matters most for production decline curve analysis, where a single missed test interval can distort the decline trend enough to misinform a workover prioritization decision across an entire field.
Frequently Asked Questions: Artificial Lift Optimization
How much production uplift can AI-based artificial lift optimization deliver?
Operators typically see a 10–20% production uplift per optimized well, driven mostly by catching underperformance early — VSD frequency drift, gas interference, or pump-off mistiming — rather than any single dramatic fix. Book a demo to model the uplift potential across your own well portfolio.
Can the same platform monitor both ESP and rod pump wells?
Yes — a unified wellhead monitoring platform can ingest ESP current signature data and rod pump dynamometer data simultaneously, giving field teams a single ranked priority list across mixed lift-type portfolios rather than two separate systems.
What causes most ESP failures and can they be predicted?
Gas lock, scale buildup and bearing wear account for the majority of ESP failures, and each produces a distinct current signature pattern days to weeks before the pump actually trips offline, making most ESP failures predictable with continuous monitoring.
How does pump-off controller optimization improve rod pump efficiency?
A pump-off controller stops the pump when fluid level drops below an efficient threshold, preventing fluid pound and reducing unnecessary rod and motor wear. AI-based timing optimization adjusts the shutoff point continuously as well conditions change rather than using a fixed setting.
Does artificial lift monitoring integrate with existing SCADA and well test systems?
Most platforms are designed to pull from existing SCADA, VSD controllers and well test databases rather than requiring new downhole instrumentation, layering analytics on top of data already being collected. Talk to support to review your current system compatibility.