Redzone's 2025 Benchmark Report analyzed 1,500 factories and found the average baseline OEE is just 47%. That means most manufacturers are capturing less than half of their production potential every single day. For greenfield factory executives, the stakes are even higher — you're building from scratch with no historical data, no baselines, and investors watching every ramp-up milestone. These are the KPIs that separate plants that hit full production on schedule from those that burn through contingency budgets firefighting problems they never saw coming.
The 8 KPIs Every Greenfield Executive Must Track
OEE is the single most important manufacturing productivity metric — it combines three dimensions into one number that tells you exactly how much of your production potential you're actually capturing. An OEE of 100% means you're manufacturing only good parts, as fast as possible, with zero downtime.
MTBF measures the average operating time between equipment failures — it's the definitive indicator of equipment reliability. In a greenfield factory, MTBF baselines are especially critical because you're establishing the performance profile of brand-new equipment. Early failures during ramp-up often reveal installation defects, not manufacturing defects.
MTTR measures how fast your maintenance team can get a failed machine back into production. Combined with MTBF, these two metrics tell the complete reliability story: how often equipment fails and how quickly you recover. For greenfield teams with new maintenance crews, MTTR exposes training gaps and spare parts readiness faster than any other metric.
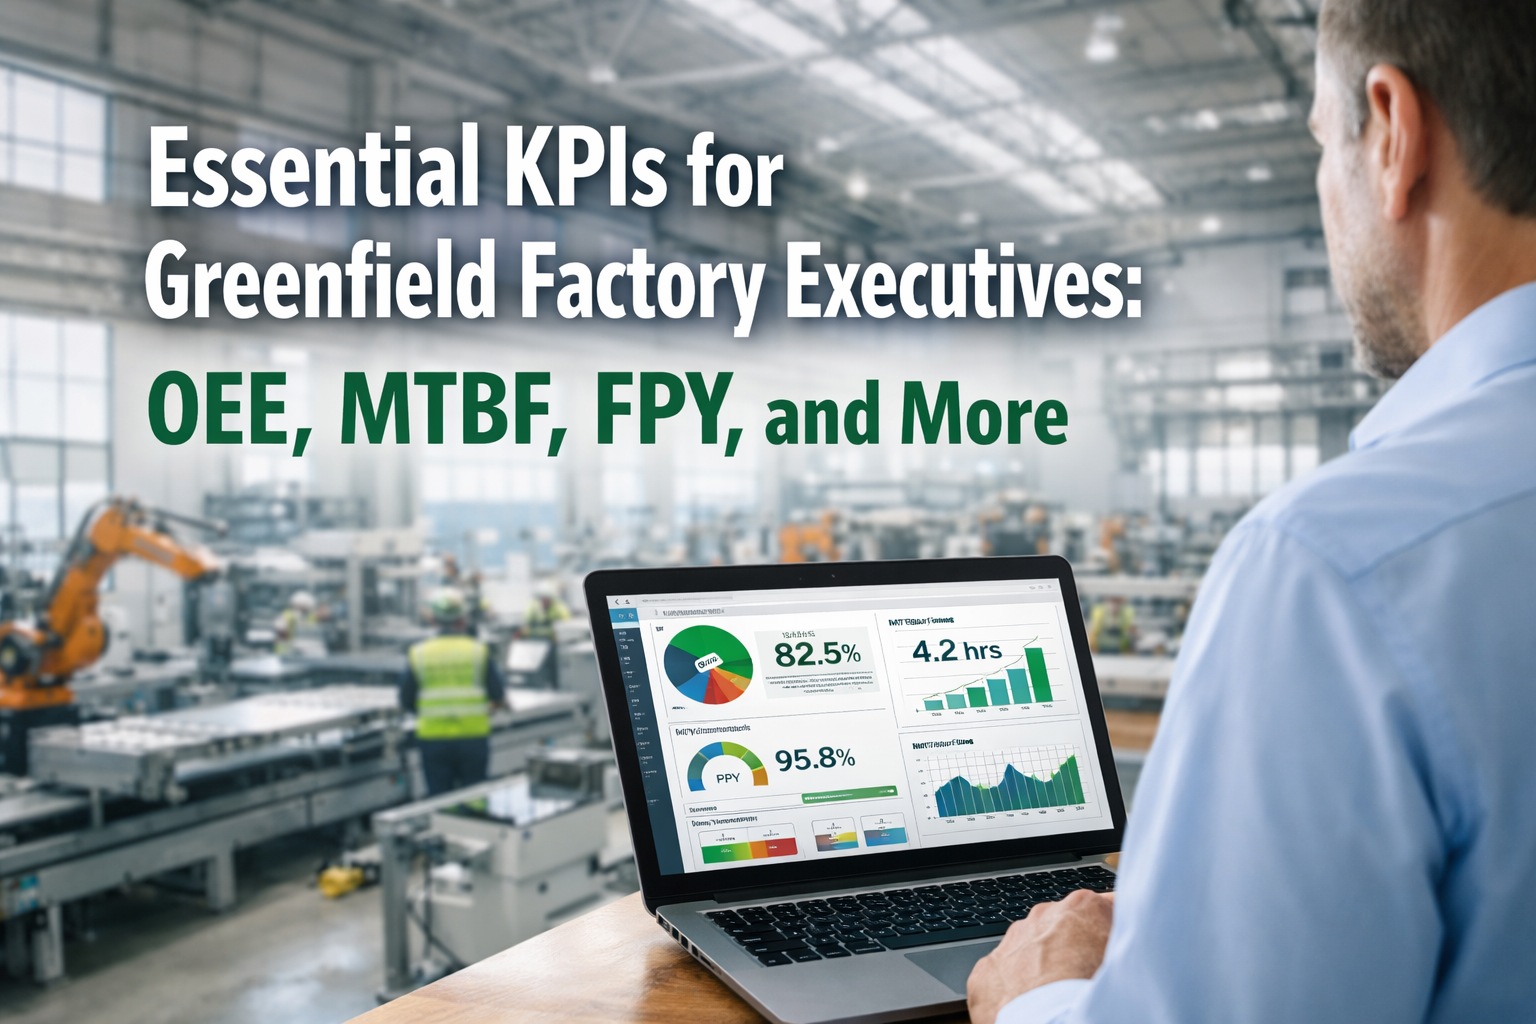
See These KPIs Live in iFactory
iFactory dashboards calculate OEE, MTBF, MTTR, and more in real-time — giving greenfield executives instant visibility from commissioning day one.
FPY measures the percentage of products manufactured correctly on the first attempt — no rework, no scrap, no quality holds. It is the purest measure of process stability and operator proficiency. During greenfield ramp-up, FPY is the canary in the coal mine: if it's dropping, something upstream is wrong.
This KPI measures how much energy is consumed to produce each unit — and it's becoming one of the most scrutinized metrics in manufacturing as energy costs rise and ESG reporting requirements tighten. In a greenfield factory with edge computing, robotics, and AI inference running alongside production, energy costs can surprise teams that didn't plan for high-density compute loads.
Ramp-up velocity measures how quickly your greenfield factory progresses from first article production to target output levels. This is the KPI that boards and investors watch most closely — it directly determines time-to-revenue and payback period. Deloitte's greenfield research confirms that dashboards tracking WIP status, equipment performance, and line yield during ramp-up make the difference between hitting targets and missing them.
PMP reveals the maturity of your maintenance strategy by measuring how much of your total maintenance activity is planned versus reactive. A greenfield factory should target high PMP from the start — because every hour spent on unplanned firefighting is an hour stolen from the ramp-up timeline.
Capacity utilization measures how much of your factory's total production potential is actually being used. For greenfield executives, this metric is the bridge between ramp-up and steady-state — it tells you when you've unlocked the capacity you built and when it's time to plan the next phase of expansion.
The pattern that separates leaders from laggards: Organizations with strong performance cultures achieve 3x better KPI improvement rates than those relying solely on technology and measurement systems. The factories that win aren't just tracking KPIs — they're acting on them in real-time, with cross-functional teams that share targets and collaborate on solutions rather than pointing fingers when performance drops.
Frequently Asked Questions
Get Real-Time Plant Intelligence From Day One
iFactory's AI-powered dashboards give greenfield executives instant visibility into OEE, MTBF, FPY, energy costs, and ramp-up velocity — configured during construction, not after launch.
Ready to track the KPIs that matter from commissioning day one? Book your free iFactory demo and see how AI-powered dashboards turn raw equipment data into executive-level plant intelligence.