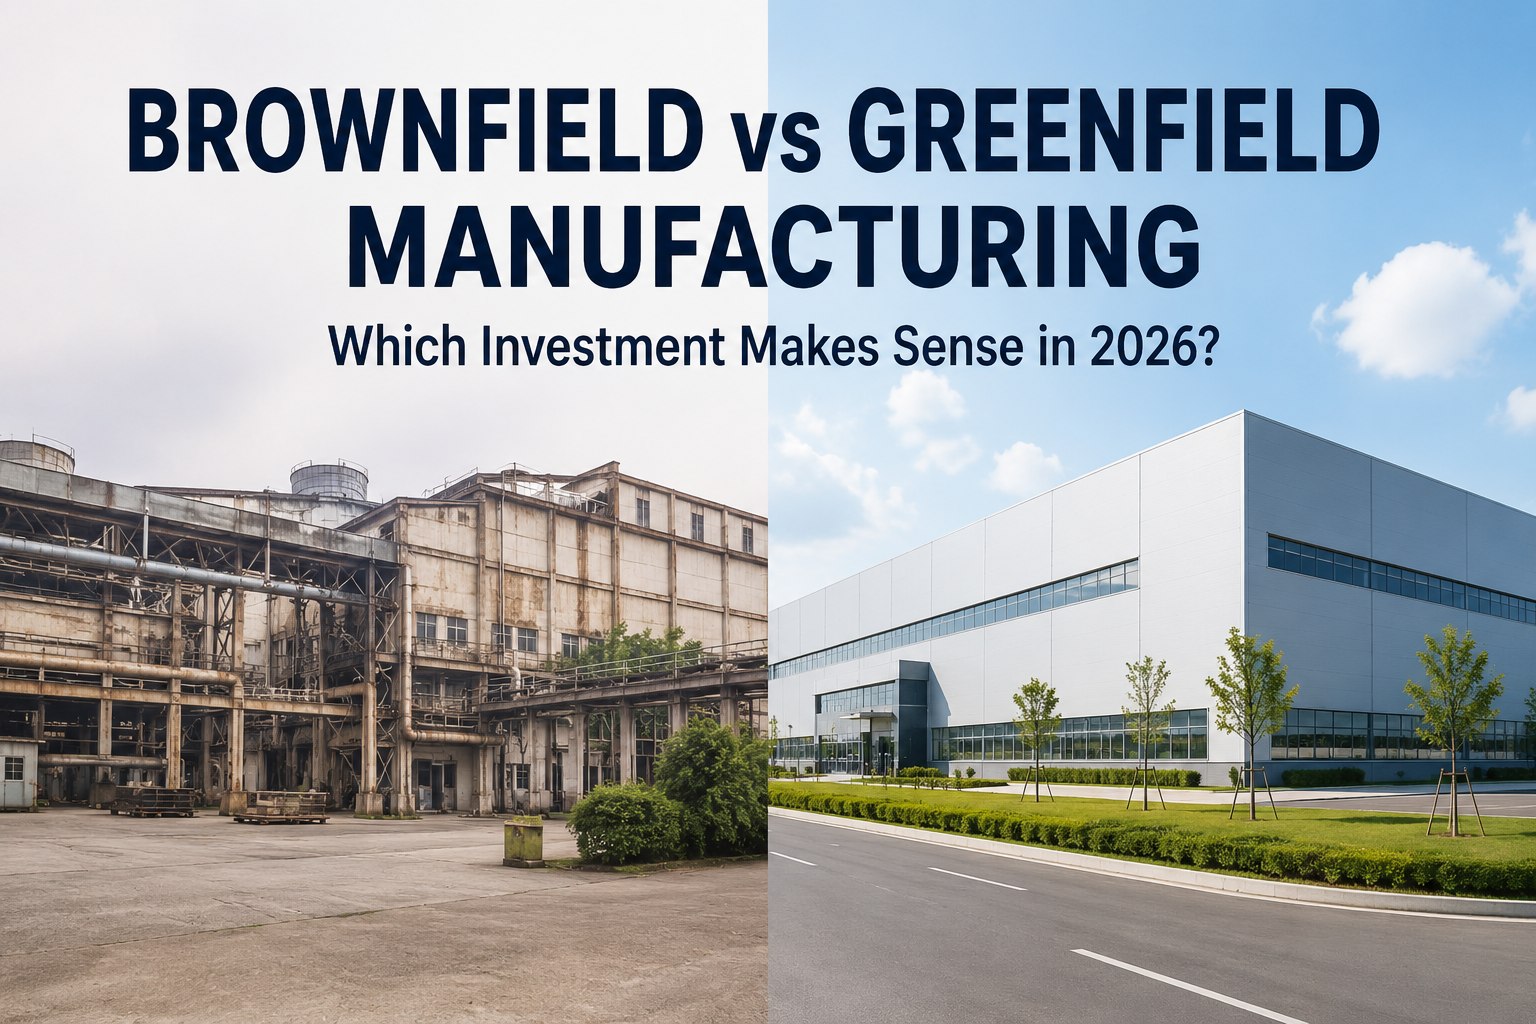
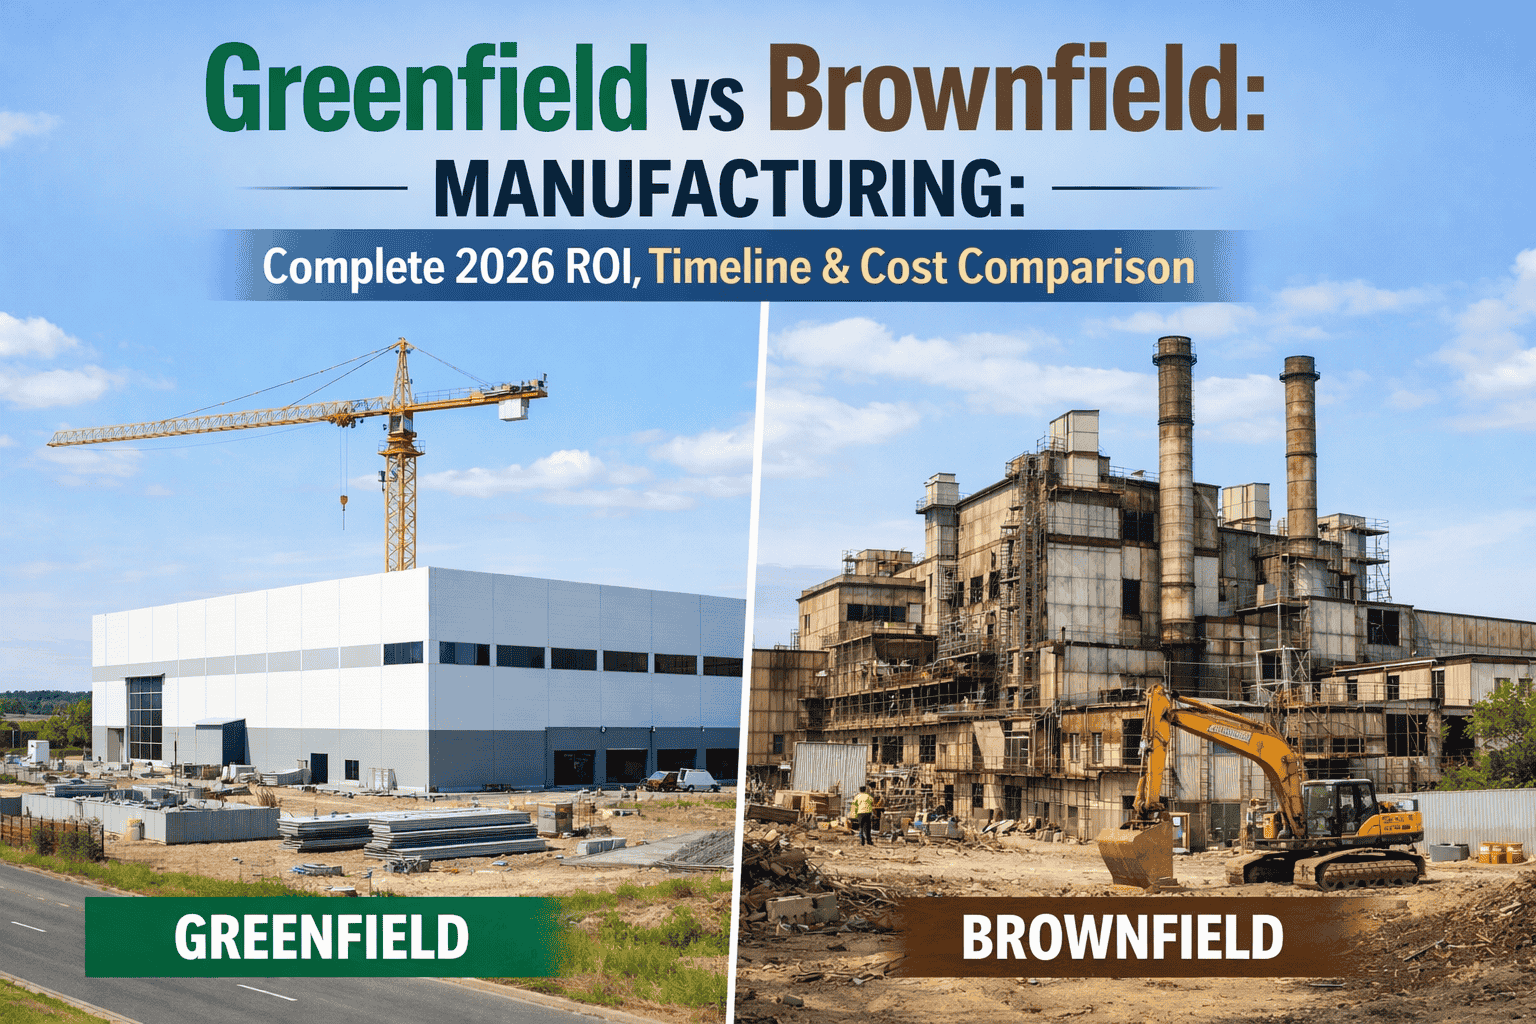
Only 14% of manufacturers choose pure greenfield construction. The other 86% face the same trade-off every CFO and operations leader recognizes: build new on a blank slate, or retrofit what already exists and start producing in months instead of years. The answer isn’t about which path is “better” — it’s about which path delivers better ROI for a specific situation. Greenfield builds cost 40–60% more upfront but achieve 45% faster technology adoption and 25% higher ROI by year three. Retrofits deploy 50–70% faster but typically hit a performance ceiling at 60–80% of potential. The real numbers, the hidden costs, and the decision framework that separates winning bets from billion-dollar mistakes are below. Book a custom ROI analysis demo to see your project modeled against both paths.
GREENFIELD
Build New
Higher CAPEX, higher ceiling
RETROFIT
Renovate & Upgrade
Lower CAPEX, faster ROI
The Headline Numbers Every Manufacturing Leader Should Know
Before diving into framework, anchor to the data. These are the figures CFOs are quoting in 2026 board decks, and they reframe the conversation from gut feel to capital allocation.
$12–55M
Greenfield
Typical capital cost range for a new manufacturing facility, depending on industry and scale
$6–22M
Retrofit
Typical capital cost for brownfield renovation — roughly 40–60% lower upfront investment
3–5 yr
Greenfield
Concept to stable production, with a J-curve before positive cash flow arrives
6–18 mo
Retrofit
Assessment through integration — 50–70% faster time-to-production than greenfield
75–85%
Greenfield
Realistic OEE target for AI-native plants designed for Industry 4.0 from day one
50–75%
Retrofit
Realistic OEE ceiling on retrofits — still above the 55–65% industry average
Head-to-Head: The 7 Dimensions That Actually Decide ROI
Most comparison frameworks pick three or four dimensions and call it a day. The real decision lives across seven. Here’s how each path performs on every one — with the numbers your finance team will demand to see.
Round 01
Upfront Capital Investment
Greenfield
$12M–$55M typical range; can hit $500M+ for mega-projects. Land, infrastructure, utilities, equipment, controls, and digital stack all from zero.
Retrofit
$6M–$22M typical range. Existing structure, utilities, and access already paid for. 40–60% lower CAPEX out of the gate.
Retrofit wins on raw CAPEX — almost always.
Round 02
Time to First Revenue
Greenfield
36–60 months from concept to stable production. Permits, construction, equipment lead times, and ramp-up compound.
Retrofit
6–18 months assessment through integration. Often partial production maintained during renovation.
Retrofit wins by 50–70% on speed when market urgency is the deciding factor.
Round 03
Technology Ceiling
Greenfield
75–85% OEE achievable. Layout, controls, MES, and AI designed in from day one. 45% faster technology adoption.
Retrofit
50–75% OEE ceiling. Column spacing, ceiling height, electrical capacity, and legacy PLCs constrain what’s possible.
Greenfield wins when the next-decade competitive position depends on OEE headroom.
Round 04
Hidden & Discovered Costs
Greenfield
70% of greenfield projects exceed budget. Long-lead equipment, permit delays, and labor shortages drive overruns.
Retrofit
68% of retrofits exceed schedule by 12+ days from undocumented conditions. Integration costs run 20–35% above base estimates.
Both bleed surprises — but retrofit surprises are structural and harder to model in advance.
Round 05
Payback Period
Greenfield
24–36 month payback typical, 3–7 years to full IRR realization. Higher long-term returns through efficiency.
Retrofit
12–18 month payback typical for smart-factory retrofit. Lower CAPEX + faster start compresses the curve.
Retrofit wins on payback — the question is whether the ceiling matters more than the speed.
Round 06
5-Year Total Cost of Ownership
Greenfield
Lower ongoing maintenance, higher OEE, lower energy intensity. By year five, often becomes the cheaper plant.
Retrofit
Lower upfront CAPEX, but higher legacy maintenance, energy waste, and technical debt compound year over year.
Greenfield wins on TCO when horizon stretches beyond three years.
Round 07
Year-3 ROI Performance
Greenfield
25% higher ROI than retrofits by year three in major markets. Future-proofing premium pays off measurably.
Retrofit
Strong early returns plateau as performance ceiling and legacy constraints become binding.
Greenfield wins the long game. Retrofit wins the short game.
Want these seven dimensions modeled against your specific project numbers? Book a custom ROI scoping demo with our greenfield consulting team.
The 5-Year TCO Story — Where the Two Paths Actually Cross
The most underestimated number in this comparison is the crossover year — the point at which greenfield’s higher upfront cost is offset by retrofit’s higher operating cost. For most manufacturers, that crossover lands somewhere between year three and year five, and it’s the single biggest driver of which path wins on a 10-year horizon.
Year
Greenfield Cumulative
Retrofit Cumulative
Crossover Status
Year 0–1
Heavy CAPEX, no revenue
Production starts, lower CAPEX
Retrofit ahead
Year 2
Ramp-up begins, J-curve
Approaching payback
Retrofit ahead
Year 3
Hits design throughput
Hits performance ceiling
Crossover window
Year 4–5
Efficient operations, low maintenance
Legacy maintenance & tech debt rising
Greenfield ahead
Year 6–10
25% higher ROI maintained
Plateau, may need second retrofit
Greenfield ahead
Model Your Crossover Year on Real Data
iFactory’s ROI platform runs Monte Carlo simulation against your CAPEX assumptions, demand forecasts, and energy costs — producing confidence intervals on payback, IRR, and 5-year TCO for both paths. See your specific crossover year before you commit.
The Decision Framework: Six Questions That Settle It
The right answer isn’t always the same answer. Walk these six questions in order, and the path your project should take usually becomes obvious by question four. If it doesn’t, the hybrid strategy at the bottom of this section is almost certainly the right move.
Q1
How urgent is time-to-market?
If under 18 months: retrofit. If 24+ months is acceptable: both paths open.
Q2
What OEE do you need to be competitive in five years?
Above 80%: greenfield is the only realistic path. 65–75%: retrofit can hit it.
Q3
Does demand justify net-new capacity, or just better existing capacity?
Net-new: greenfield. Better existing: retrofit almost always wins.
Q4
How tight is the CAPEX envelope today?
Constrained: retrofit + smart factory layer. Open: evaluate both on long-term ROI.
Q5
Are your existing facilities suitable for the products you’ll make in 2030?
Yes: retrofit is safe. No or unclear: greenfield avoids a forced rebuild later.
Q6
Is there a regulatory or contamination risk attached to existing sites?
Yes: greenfield, almost always. No: retrofit remains viable.
Still split between paths after the six questions? Book a 30-minute strategy demo to map your specific answers against a quantified decision.
The Hybrid Play — What Smart Manufacturers Actually Do
Many manufacturers don’t choose. They sequence. Start production in a brownfield facility for speed-to-market, then plan and build a greenfield facility for long-term capacity once cash flow stabilizes. This hybrid strategy compresses the worst risk of each path and is the dominant approach among manufacturers running multi-site networks in 2026.
Phase 1
Brownfield Speed Play
Months 0–18
Retrofit an existing facility with smart factory technology — IoT sensors, predictive maintenance, AI quality — for fastest possible production start. Generates revenue while greenfield planning happens in parallel.
Phase 2
Greenfield Build Begins
Months 12–48
Site selection, FEED, and construction of the long-term capacity facility — informed by real operating data from Phase 1. Risk model now uses actual yield and demand curves instead of assumptions.
Phase 3
Network Optimization
Months 48+
Greenfield runs at high-OEE for premium products; brownfield continues serving stable demand or pivots to secondary lines. Capacity, product mix, and energy footprint optimized across the network.
Expert Perspective
"The calculus shifted in the last two years because smart manufacturing technology can now be deployed in both environments. IoT sensors, AI analytics, digital twins, and predictive maintenance retrofit cleanly onto legacy PLCs from any era using standard industrial protocols. That changes the ROI profile of brownfield projects dramatically — while making greenfield builds even more powerful when the strategic case justifies them. The leaders winning in 2026 aren’t the ones picking sides. They’re the ones running the math on both paths against their specific demand, capital, and time-to-market constraints — and acting on the answer."
— Manufacturing Capital Strategy, 2026 industry research
10:1
ROI achievable on both paths with AI-powered maintenance
27%
of PdM adopters reach payback in under one year
41%
lower variance for teams using risk-adjusted ROI models
Conclusion: The Right Question Isn’t Which — It’s When
Greenfield builds win the long game on OEE, technology adoption, and 5-year TCO. Retrofits win the short game on CAPEX, speed-to-revenue, and payback period. Neither is inherently right or wrong — the right answer depends entirely on demand urgency, OEE requirements, capital position, and the suitability of existing facilities for the products you’ll make in 2030. For most manufacturers, the highest-ROI move in 2026 isn’t to pick one path, but to sequence both: retrofit for revenue today, greenfield for capacity tomorrow, network optimization for the decade after. What separates winning bets from billion-dollar mistakes is the discipline to model both paths against real data — not gut feel, not vendor pitches, not last quarter’s assumptions. That model is exactly what a focused ROI demo is built to produce.
Run Your Greenfield vs Retrofit ROI Today
iFactory’s consulting team models both paths against your specific demand, CAPEX, energy costs, and timeline — producing confidence intervals on payback, IRR, and 5-year TCO that hold up in front of your board. Get a free ROI strategy session.
Frequently Asked Questions
Which is cheaper — greenfield or retrofit?
Retrofit is cheaper upfront in almost every case. Brownfield renovations typically run $6M–$22M against $12M–$55M for new greenfield builds — a 40–60% lower CAPEX position. However, retrofits often incur hidden integration costs of 20–35% above base estimates, and 68% of them exceed schedule by 12+ days due to undocumented electrical, plumbing, or structural conditions. When 5-year total cost of ownership is factored in, greenfield frequently becomes the cheaper plant by year three to five because of lower ongoing maintenance, higher OEE, and reduced energy intensity. The honest answer: retrofit is cheaper today, greenfield is often cheaper by year five.
How fast can a retrofit produce revenue compared to greenfield?
Retrofits typically reach production in 6–18 months — assessment in 1–3 months, renovation in 3–12 months, integration in 2–3 months. Greenfield projects require 3–5 years from concept to stable production, with 6–12 months for planning and design, 12–36 months for construction and equipment installation, and 6–12 months for commissioning and ramp-up. The 50–70% timeline advantage is why 70% of manufacturers under market pressure choose the brownfield path. Greenfield catches up on long-term efficiency, but if market timing is the deciding factor, retrofit almost always wins.
Can a brownfield retrofit achieve smart factory performance?
Yes — with realistic ceiling expectations. Modern IoT sensors and AI platforms connect to legacy PLCs from the 1960s onward using standard industrial protocols like Modbus and OPC UA. A brownfield smart factory pilot typically costs $50K–$500K for 10–20 assets, with ROI visible within 45–90 days of deployment. Digital twins, cobots, and predictive maintenance retrofit successfully into existing facilities. The honest constraint: brownfield typically achieves 50–75% OEE versus 75–85% for AI-native greenfield builds. That’s still significantly above the 55–65% industry average, and for most manufacturers it’s the highest-ROI path when CAPEX is constrained.
What payback period should I expect for each approach?
Retrofits typically achieve faster initial payback — 12–18 months when AI-powered maintenance and quality layers are part of the project. Greenfield builds have a longer payback window of 24–36 months, with full IRR realization over 3–7 years depending on industry and scale. The key trade-off: retrofit delivers faster cash but plateaus at the performance ceiling; greenfield takes longer to break even but delivers 25% higher ROI by year three in major markets and maintains that advantage across the 10-year horizon. For a board-grade decision, the right metric isn’t which payback is faster — it’s which path produces the higher IRR over your investment horizon.
Can a hybrid greenfield-and-retrofit strategy actually work?
It’s increasingly the dominant approach among multi-site manufacturers. The pattern: start production in a brownfield retrofit for fastest possible revenue (months 0–18), use that revenue to fund a greenfield build for long-term capacity (months 12–48 in parallel), then optimize across the resulting network from month 48 onward. The advantage is that greenfield design decisions can be informed by real operating data from the retrofit, instead of pre-production assumptions. The risk profile drops because demand and yield curves are proven before the greenfield CAPEX is committed. For manufacturers facing both urgent market demand and long-term capacity needs, the sequenced hybrid play frequently produces better risk-adjusted ROI than either single path alone.