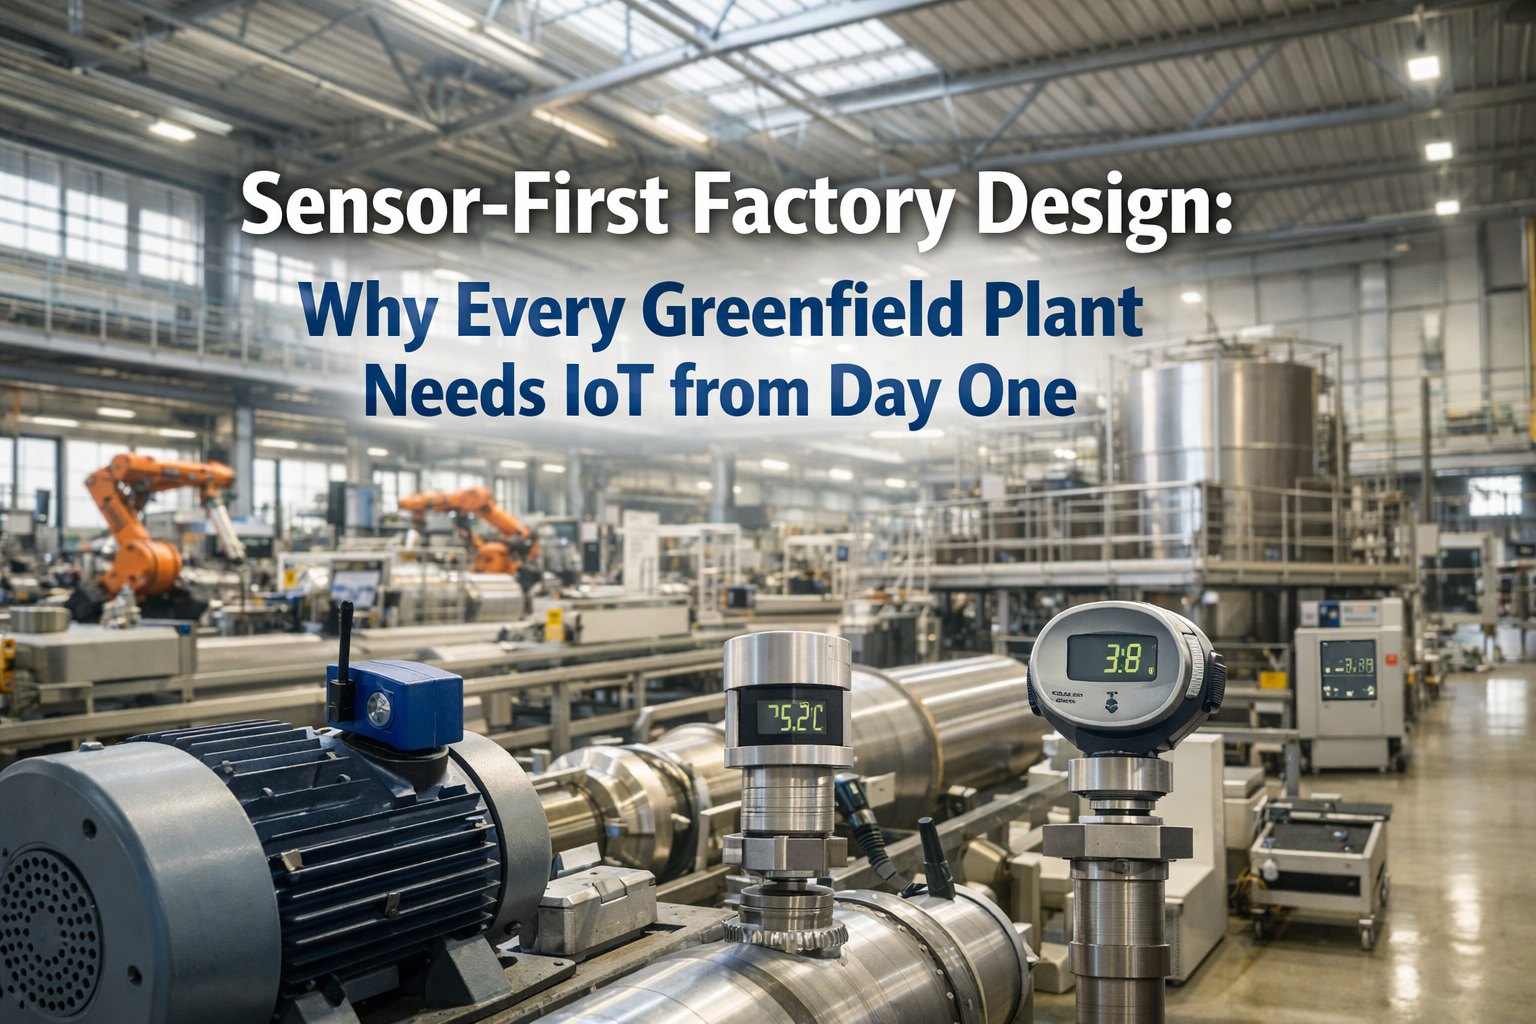
After two decades of commissioning factories, the pattern is unmistakable: the number one reason predictive maintenance projects fail isn't the AI model, the analytics platform, or the CMMS integration — it's wrong sensors in wrong locations producing noise instead of data. Temperature sensors mounted near heat sources give false readings. Vibration sensors on flexible sheet-metal brackets amplify structural resonance instead of measuring bearing health. Pressure transmitters installed downstream of control valves see process noise, not real pressure. Wireless sensors placed behind steel columns lose signal and send intermittent data that corrupts every ML model trained on it. Every one of these failures is a design decision made (or not made) before the sensor was ever installed. In a greenfield factory, you have one chance to get sensor architecture right — and zero excuse not to, because the cost of correct placement during construction is a fraction of retrofit. We select the right sensor type, connectivity, and mounting for every use case — and design the data collection infrastructure that feeds AI analytics with trustworthy data from day one. Design Your Sensor Architecture
Why Sensor Placement Is the #1 Failure Point
In twenty years of factory commissioning, I've seen the same mistakes repeated across industries. These aren't theoretical problems — they're real consulting findings from plants that spent $500K-$2M on sensor infrastructure and got unreliable data in return.
Temperature Sensor Near Heat Source
A bearing temperature sensor mounted 150mm from a steam line reads 15-20°C above actual bearing temperature. The AI model learns the wrong baseline. When the bearing actually overheats, the model doesn't flag it because the reading is "normal" relative to the corrupted baseline. Fix: mount on the bearing housing with thermal isolation from adjacent heat sources. Specify in the equipment drawing — not left to the installer's judgment.
Vibration Sensor on Flexible Bracket
A vibration sensor stud-mounted on a sheet-metal guard instead of the bearing housing. The guard has a natural resonance at 800 Hz that amplifies and masks the actual bearing defect frequencies. The sensor reads "high vibration" continuously — generating nuisance alarms that operators learn to ignore. When a real bearing fault develops, nobody responds. Fix: machined flat pad on the bearing housing, specified on the mechanical drawing.
Wireless Sensor Behind Steel Column
A wireless vibration sensor installed on equipment behind a steel I-beam. Signal strength drops from -60 dBm to -95 dBm (below receiver threshold). Data arrives intermittently — 40% packet loss. The time-series database has gaps that make FFT analysis impossible. Fix: map RF propagation through the building structure during design. Position wireless gateways with line-of-sight to every sensor, or use wired connection where metal structures block wireless.
Pressure Transmitter After Control Valve
A pressure sensor installed downstream of a modulating control valve reads process noise from the valve — not actual system pressure. Every valve movement creates a transient that the AI interprets as a pressure anomaly. Hundreds of false alarms per day. Fix: install upstream of the control valve, or add a pulsation dampener. Specify the exact P&ID location during design — not decided during installation.
Want every sensor location specified correctly on your equipment drawings before construction? Design Your Sensor Architecture — we deliver sensor specifications, mounting details, and connectivity design as construction-ready documentation.
Sensor Selection by Measurement Requirement
| What You Need to Know | Sensor Technology | Range / Accuracy | Mounting | Sampling Rate | Connectivity | Cost/Point |
|---|---|---|---|---|---|---|
| Bearing health (rolling element) | Piezoelectric accelerometer (ICP) | ±50g; 0.5 Hz-20 kHz | Stud mount on bearing housing (machined pad) | 25.6-51.2 kHz continuous | Wired (4-wire ICP) | $150-$400 |
| Bearing health (fleet coverage) | MEMS wireless accelerometer | ±16g; 0-6 kHz | Adhesive or magnetic on bearing housing | 1 Hz continuous; 6 kHz burst | Wireless (BLE/WiFi/LoRa) | $80-$250 |
| Motor winding condition | RTD or thermocouple (embedded) | -50 to +250°C; ±0.5°C | Embedded in winding during motor manufacture | 1 Hz | Wired (4-20mA or Modbus) | $50-$150 |
| Surface temperature (external) | Contact RTD or IR non-contact | -40 to +500°C; ±1°C | Surface mount (RTD) or aimed (IR) | 1 Hz | Wired or wireless | $30-$200 |
| Process pressure | Piezoresistive transmitter | 0-600 bar; ±0.1% FS | Process connection (threaded or flanged) | 10-100 Hz | Wired (4-20mA HART) | $200-$800 |
| Motor load / energy | CT clamp + power analyzer | 0-1000A; ±1% reading | Clamp on motor power cable | 1 kHz (for MCSA); 1 Hz (energy) | Wired (Modbus) or wireless | $100-$500 |
| Oil condition (gearbox) | Inline particle counter + moisture | 4-70 μm particles; 0-100% RH | Inline in lubrication loop (bypass or main) | Continuous (1 Hz reporting) | Wired (4-20mA or Modbus) | $500-$2,000 |
| Leak detection (compressed air) | Ultrasonic microphone (airborne) | 20-100 kHz | Handheld or fixed-mount aimed at joints | Periodic survey or continuous | Wireless (survey) or wired (fixed) | $200-$1,000 |
| Ambient environment | Combined T/RH/particulate sensor | -40 to +85°C; 0-100% RH; PM2.5/PM10 | Wall or ceiling mount in zone | 0.1 Hz (slow-changing environment) | Wireless (LoRaWAN ideal) | $50-$300 |
Mounting Engineering: Where Data Quality Is Decided
Vibration Sensor Mounting Hierarchy
Data quality is directly proportional to mounting rigidity. From best to worst: (1) Stud mount on machined flat pad — full bandwidth to 20+ kHz, gold standard for permanent monitoring. (2) Epoxy/adhesive stud — reliable to 10+ kHz, acceptable for permanent installation where machining isn't possible. (3) Magnetic mount — usable to 2-5 kHz, adequate for route-based collection only. (4) Handheld probe — 0-1 kHz, screening tool only. In greenfield: specify machined mounting pads on bearing housings in the mechanical equipment specification — the cost is negligible during manufacturing but impossible to add later without disassembly.
Temperature Sensor Placement Rules
Mount on the measurement target — not near it. Bearing temperature: sensor in a thermowell drilled into the bearing housing, not clamped to the outside surface (which reads 5-15°C lower). Process temperature: sensor tip in the flow stream center, not touching the pipe wall (which reads pipe temperature, not fluid temperature). Ambient temperature: shielded from radiant heat, direct sunlight, and HVAC discharge. In greenfield: thermowell locations specified on P&IDs and mechanical drawings during engineering.
Pressure Transmitter Installation
Pressure sensors are sensitive to installation effects that corrupt readings. Mount upstream of control valves (not downstream where valve noise dominates). Use impulse tubing of correct length (too short: pressure spikes; too long: damped response). Seal pots for corrosive or high-temperature fluids. Diaphragm seals where process media would clog impulse tubing. In greenfield: P&ID symbols show exact transmitter locations; instrument engineers review every installation detail before construction.
Environmental Sensor Positioning
Temperature and humidity sensors for room monitoring: mount at the point of measurement interest, not at the most convenient wall location. In a cleanroom: measure at work surface height, not ceiling height. In a paint booth: measure at part surface level where conditions affect quality. Avoid locations near HVAC diffusers (reads supply air, not room condition), near doors (reads transition air), or in direct sunlight (radiant heating bias). In greenfield: sensor locations plotted on architectural reflected ceiling plans during design.
Connectivity Decision Framework
There is no single "best" connectivity technology. The right choice depends on four factors: data rate requirement, reliability requirement, power availability, and physical environment. Here's the decision framework we apply in every greenfield design.
| Decision Factor | Choose Wired | Choose WiFi/BLE | Choose LoRaWAN | Choose Private 5G |
|---|---|---|---|---|
| Data rate needed | High-frequency (25+ kHz continuous vibration, vision) | Medium (1 kHz burst vibration, process data) | Low (1 Hz environmental, tank level, utility meter) | Medium-high (mobile robot, AGV, streaming video) |
| Reliability required | Mission-critical (machine protection, safety) | Important (condition monitoring, mobile HMI) | Tolerant (environmental, non-critical assets) | Critical mobile (AGV collision avoidance, remote control) |
| Power available | Yes (loop-powered, PoE, or dedicated supply) | Usually (battery or USB power; 6-24 month battery) | No (5-10 year battery life; solar harvesting) | Usually (battery or vehicle power) |
| Physical environment | Fixed equipment; cable routing feasible | Indoor; 30-50m range; metal interference manageable | Campus-wide; 2+ km range; metal structures tolerated | Plant-wide; licensed spectrum; zero interference |
| Greenfield design note | Cable trays and conduit designed in; 60-70% cheaper than retrofit | AP locations planned; coverage verified before construction | 1-3 gateways cover entire plant from elevated positions | Small cell locations and fiber backhaul pre-installed |
Not sure which connectivity mix your factory needs? Design Your Sensor Architecture — we specify wired, WiFi, LoRaWAN, and 5G coverage zones mapped to your facility layout and equipment criticality.
Data Gateway & Edge Architecture
Converts sensor protocols (4-20mA, Modbus RTU, BLE, IO-Link) to IP-based data streams (MQTT, OPC UA). One gateway per 10-50 sensors. Mounted in local junction boxes or DIN-rail panels. In greenfield: gateway location, power drop, and network connection specified on equipment layout drawings. This is the most commonly forgotten item in greenfield design — and the most expensive to retrofit.
Runs local analytics: threshold alerts, spectral analysis, anomaly detection. Reduces data volume by 90-95% before upstream transmission (sends features, not raw waveforms). Industrial PC or NVIDIA Jetson GPU for ML inference. In greenfield: edge compute rack space, power, cooling, and network in zone-level cabinets designed into facility layout.
MQTT broker aggregates all sensor data into a unified topic hierarchy. Provides pub/sub architecture for multiple analytics consumers. Store-and-forward during network disruptions ensures zero data loss. In greenfield: runs on a server in the edge server room with redundancy. Broker topic structure designed during architecture phase, not grown organically.
InfluxDB, TimescaleDB, or equivalent ingests millions of data points per second. ML models consume feature-engineered data for RUL prediction, failure classification, and prescriptive recommendations. Predictions trigger auto work orders in CMMS. In greenfield: storage IOPS and capacity sized during IT infrastructure design. Analytics platform selected and integrated before commissioning.
Sensor Lifecycle Management
Every sensor calibrated and verified during equipment commissioning — not after production starts. Baseline readings captured under known-good conditions at multiple operating points. This baseline becomes the AI's "healthy" reference. In greenfield, commissioning baseline capture is a formal step in the IQ/OQ process.
Every sensor has a calibration interval based on manufacturer specification, regulatory requirement, and historical drift rate. AI monitors sensor health indicators (noise floor, zero drift, response time) and flags sensors approaching calibration limits — enabling condition-based calibration instead of fixed-interval. CMMS auto-generates calibration work orders.
Wireless sensor batteries deplete at rates determined by sampling frequency, transmission interval, and temperature. AI predicts battery remaining life from voltage trending and environmental conditions — scheduling replacements in maintenance windows, not discovering dead sensors during data review. Fleet-level battery management dashboard shows all sensor health at a glance.
As equipment ages and failure patterns emerge, sensor placement evolves. Assets that develop unexpected failure modes get additional sensors. Assets that prove highly reliable get monitoring downgraded. The sensor architecture is a living design — updated annually based on maintenance data, failure history, and evolving AI model requirements.
Key Benefits & ROI
Bad Data In = Bad Predictions Out — Architecture Is Everything
After 20+ years of factory commissioning, the lesson is clear: sensor architecture decisions made during design determine whether your AI delivers value or generates noise. iFactory designs complete IIoT sensor architecture as construction-ready documentation — so every sensor delivers trustworthy data from day one.
Frequently Asked Questions
The Sensor You Place Wrong Today Generates False Data for Years
Sensor placement decisions are permanent. Get them right during design — mounting pads machined, cable routes designed, wireless coverage verified — and every prediction your AI makes will be trustworthy.