At 6:47 AM on a Monday in October 2025, Terminal 2 of a major North American airport experienced what operations staff call a "cascade stall." A single security lane closed for an unscheduled equipment calibration at 6:15 AM — reducing checkpoint capacity from 8 lanes to 7 during the 6:00–8:00 AM peak departure wave. By 6:30 AM, the security queue had grown from a normal 12-minute wait to 19 minutes. By 6:47 AM, it had reached 34 minutes — and the queue physically extended past the checkpoint boundary into the check-in hall, blocking two bag drop positions and creating a secondary queue that delayed check-in processing for passengers who hadn't even reached security yet. Three flights departed with 47 empty seats collectively because connecting passengers couldn't clear the checkpoint in time. Airlines filed $186,000 in delay compensation claims against the airport authority. And 340 passengers posted negative reviews mentioning "chaos," "unacceptable wait times," and "missed my connection" — impacting the airport's ASQ satisfaction score for the entire quarter. The root cause was not the closed lane. Security lanes close for maintenance routinely. The root cause was that nobody knew the cascade was building until passengers were already missing flights. The airport had no real-time queue measurement system, no predictive model correlating lane capacity with flight schedule demand, no digital twin that could simulate "what happens to the 7 AM wave if Lane 4 is offline," and no automated alert system that would have triggered staff redeployment from a quiet Terminal 1 checkpoint to the overwhelmed Terminal 2 — 20 minutes before the cascade became irreversible. In 2026, AI-powered airport queue management transforms this reactive, complaint-driven model into a predictive, data-driven operation. Computer vision counts passengers in real time. AI models predict wait times 30–60 minutes ahead based on flight schedules, historical patterns, and current throughput rates. Digital twin simulation models the impact of lane closures, staff redeployment, and demand surges before they happen. And automated alerts trigger operational response when predicted wait times exceed thresholds — not when passengers are already missing flights. iFactory's AI platform delivers the complete queue intelligence stack: real-time measurement, predictive analytics, digital twin simulation, and CMMS-integrated infrastructure maintenance that ensures every checkpoint, gate, and processing position operates at full capacity when passenger demand peaks. Book a free queue management assessment to quantify where AI can eliminate your worst passenger flow bottlenecks — or visit our Support Center to explore the platform.
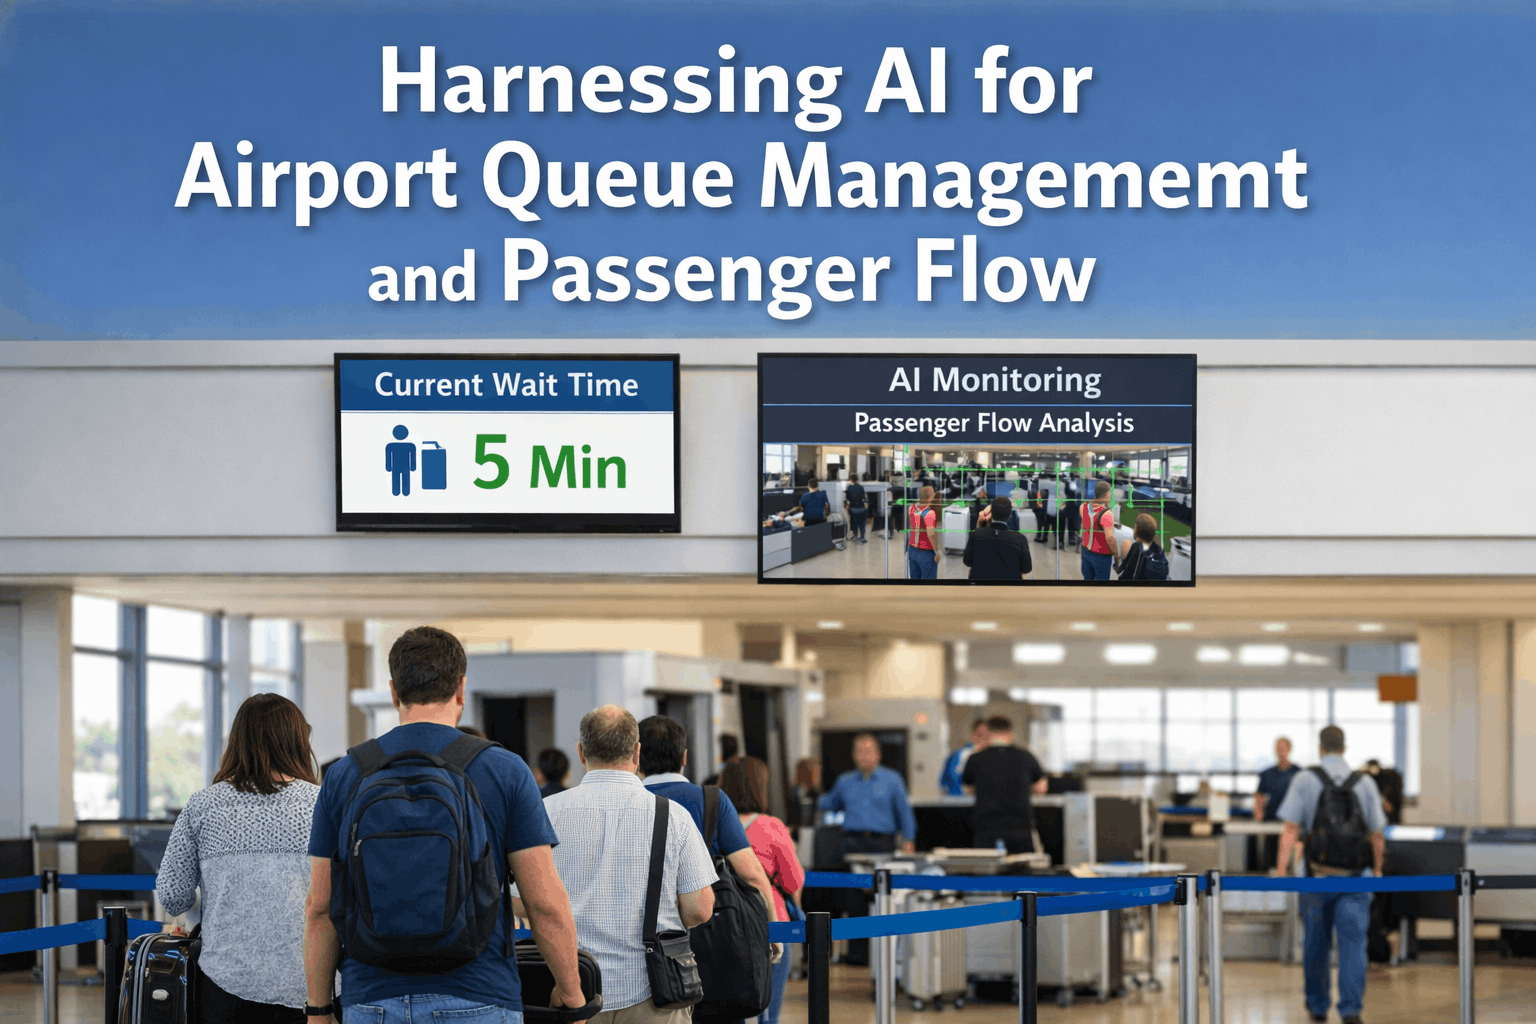
Harnessing AI for Airport Queue Management & Passenger Flow
Real-Time Measurement, Predictive Analytics, Digital Twin Simulation & Automated Response
$186K
Average Airline Delay Compensation from a Single Cascade Queue Event — Preventable with 20 Minutes Warning
34 min
Peak Queue Wait Time That Triggers Missed Connections — AI Predicts Breaches 30–60 Minutes Ahead
92%
Passenger Satisfaction Improvement at Airports Deploying AI Queue Prediction with Digital Signage
The Problem: Why Airports Cannot Manage What They Cannot Measure
Airport queue management in 2026 still operates on the same model as 2005 at most facilities: a supervisor walks through the terminal, visually estimates queue length, and radios for additional staff when the line "looks long." This reactive approach fails because queue cascades accelerate exponentially — a queue that is manageable at 15 minutes becomes irreversible at 25 minutes — and human visual estimation cannot quantify the throughput math that determines whether a queue will resolve or cascade.
Traditional Queue Management — Where Passenger Experience Breaks Down
Visual Estimation Only
Supervisor walks terminal — "the line looks long" — no actual measurement of wait time or throughput
Reactive Staff Deployment
Additional lanes opened after queue exceeds threshold — 15–25 minutes too late to prevent cascade
No Flight Schedule Link
Queue capacity not correlated with departure waves — demand surges discovered when they arrive
Missed Flights & Complaints
Passengers miss connections, airlines file claims, ASQ scores drop, revenue lost to competitor hubs
1
No Real-Time Queue Measurement — Flying Blind
Without computer vision or sensor-based queue measurement, airports have no actual data on current wait times, queue length, or per-lane throughput rates. Supervisors estimate. Passengers complain. Airlines file claims. And the operations team reviews what happened in yesterday's report — not what is happening right now. AI computer vision counts passengers per zone every 5 seconds, calculates actual wait times from entry to processing, and measures throughput per lane per minute — providing the real-time data that makes queue management operationally possible.
Visibility
Zero Real-Time
2
No Predictive Capability — Cascades Discovered Too Late
A queue that will exceed 30 minutes at 7:15 AM is predictable at 6:45 AM — if you have the model. Flight schedule data shows 2,400 departing passengers between 7:00–8:00 AM. Security checkpoint throughput is 180 passengers per lane per hour across 8 lanes. If one lane closes, capacity drops to 1,260/hour — 140 passengers short. AI calculates this gap 30–60 minutes ahead and triggers preemptive action before the queue forms.
Warning Time
Zero Minutes
3
No Digital Twin — Cannot Simulate "What If" Scenarios
"What happens if we close Lane 4 for maintenance during the 7 AM wave?" "What is the impact of moving 2 staff from Terminal 1 to Terminal 2 at 6:30?" Without a digital twin that models passenger flow, queue formation, and throughput dynamics, these questions are answered by guesswork. With a digital twin, they are answered by simulation with quantified wait time and passenger impact projections.
Simulation
Not Available
4
Infrastructure Failures Create Unplanned Capacity Loss
Security screening equipment, boarding gate hardware, self-service kiosks, and e-gates fail without warning — instantly reducing processing capacity at the worst possible moment. A single X-ray machine failure during peak hour removes 180 passengers/hour of throughput capacity. Predictive maintenance on queue infrastructure ensures that equipment failures are anticipated and planned around — not discovered when the queue is already forming.
Capacity Loss
180 pax/hr per lane
How AI Transforms Airport Queue Management
AI queue management rebuilds the entire operational model from measurement to response. Every step that depended on human visual estimation is replaced with data. Every reactive staff deployment becomes a predictive redeployment. And every "what if" question is answered by simulation rather than guesswork.
AI-Powered Queue Management — From Sensor Data to Optimized Passenger Flow
Computer Vision Measures
AI counts passengers, measures wait times, and calculates throughput per lane every 5 seconds
AI Predicts 30–60 Min Ahead
Flight schedule + current throughput + historical patterns = predicted wait times by time slot
Digital Twin Simulates Options
"Open Lane 9" vs "Redeploy 3 staff from T1" — twin quantifies impact of each option instantly
Automated Alert & Response
Operations team alerted with specific recommendation 20+ min before queue exceeds threshold
See Every Queue — Every Second — Precisely
✓ Computer vision counts passengers per zone using existing CCTV infrastructure
✓ Actual wait time measured from queue entry to processing start — not estimated
✓ Per-lane throughput rate calculated in real time — identifies slow lanes instantly
✓ Digital signage integration — display real-time wait times to passengers per checkpoint
Know the Queue Before It Forms
✓ Flight schedule integration — passenger demand predicted per 15-minute interval
✓ AI correlates current throughput + incoming demand = predicted wait time 30–60 min ahead
✓ Threshold alerts when predicted wait exceeds 15/20/25/30 min — configurable per airport
✓ Seasonal, day-of-week, and event-based pattern recognition for demand forecasting
Test Decisions Before Passengers Feel Them
✓ Virtual model of every checkpoint, gate, and processing position in the terminal
✓ "What if" simulation — lane closures, staff moves, capacity changes quantified in seconds
✓ Optimal staff allocation calculated per time block based on predicted demand
✓ Construction and renovation impact modeled before implementation begins
Act 20 Minutes Before — Not 20 Minutes After
✓ Auto-escalation when predicted wait exceeds threshold — ops team alerted with action plan
✓ Specific recommendation per alert: "Open Lane 9" or "Redeploy 2 staff from Gate B12"
✓ Cascade prevention — alert fires when queue trajectory indicates breach, not when breach occurs
✓ Post-event analytics — every alert, response, and outcome documented for continuous improvement
Informed Passengers Are Satisfied Passengers
✓ Real-time wait times displayed on digital signage at checkpoint entries
✓ Mobile app integration — passengers check wait times before reaching the queue
✓ Alternative checkpoint routing — "Security at Gate C has a 6-minute shorter wait"
✓ Connection risk alerts — passengers with tight connections flagged for priority lane
Every Lane Operational When Every Passenger Needs It
✓ X-ray machines, body scanners, e-gates, and kiosks monitored for predictive maintenance
✓ Equipment failure predicted 2–4 weeks ahead — maintenance scheduled to off-peak windows
✓ CMMS work orders auto-generated from every predictive alert with parts and scheduling
✓ Capacity impact of planned maintenance modeled in digital twin before scheduling
The airports achieving the highest passenger satisfaction scores in 2026 are not the ones with the most security lanes or the most staff — they are the ones where AI predicts queue demand 30–60 minutes ahead and positions resources preemptively. A 20-minute warning converts a cascade event into a staff redeployment. A 30-minute warning converts it into a non-event. The difference between a 12-minute wait (satisfied passenger) and a 34-minute wait (missed flight, formal complaint, negative review) is not more infrastructure — it is better intelligence applied to the same infrastructure, 20 minutes earlier.
Platform Comparison: Evaluating AI Queue Management for Airports
We evaluated the most common queue management approaches used at airports across the six capabilities that matter most for passenger flow operations. Here is an objective comparison to help operations managers shortlist the right platform.
Queue Measurement
CV on existing CCTV — per-zone, per-lane, 5-sec updates
Infrared counters — entry/exit only, no wait time
Visual estimate — no actual data captured
Wait Time Prediction
AI predicts 30–60 min ahead from flight schedule + throughput
Not available — current state only
Not available — reactive only
Digital Twin Simulation
"What if" modeling — lane closures, staff moves quantified
Not available
Not available
Automated Alerts
Predictive — alerts 20+ min before threshold breach
Threshold — alerts when count exceeds limit (already late)
None — supervisor radios when queue looks long
Passenger Communication
Digital signage + mobile app + alternative routing
Basic wait time display — no routing intelligence
None — passengers discover wait when they arrive
Infrastructure Maintenance
Predictive — equipment failures prevented, capacity protected
Not included — separate system
Reactive — equipment fails, lane closes, queue forms
See Real-Time Queue Measurement, Predictive Analytics & Digital Twin Simulation Live
iFactory's AI queue management platform connects computer vision measurement, predictive wait time analytics, digital twin simulation, and infrastructure maintenance into one system — purpose-built for airport passenger flow operations.
How iFactory Delivers AI Queue Intelligence for Airports
Most airports that attempt queue management technology end up with disconnected tools — infrared counters that measure occupancy but not wait time, digital signage that displays estimates but not predictions, and maintenance systems that don't coordinate lane closures with demand forecasts. iFactory connects everything into one intelligent platform.
Measure — Predict — Alert — Optimise
✓ Computer vision processes existing CCTV feeds — no new cameras required
✓ Per-zone passenger count, actual wait time, and per-lane throughput every 5 seconds
✓ Flight schedule + current throughput = predicted wait times 30–60 minutes ahead
✓ Configurable threshold alerts with specific staff redeployment recommendations
Simulate — Plan — Execute — Verify
✓ Virtual model of every checkpoint, gate, kiosk, and processing position
✓ Lane closure impact modeled before maintenance is scheduled
✓ Staff reallocation scenarios quantified in passenger-minutes of wait time impact
✓ Construction and renovation disruption modeled with mitigation strategies tested
Inform — Route — Prioritise — Satisfy
✓ Real-time wait times on digital signage at every checkpoint entry
✓ Alternative checkpoint routing when secondary paths have shorter waits
✓ Connection-at-risk passenger identification from flight schedule data
✓ Mobile app API for airline and airport apps to display live wait times
Prevent — Predict — Schedule — Protect Capacity
✓ X-ray machines, body scanners, e-gates, and kiosks monitored continuously
✓ Failure predicted 2–4 weeks ahead — maintenance timed to minimize capacity impact
✓ Digital twin models capacity impact of planned maintenance before scheduling
✓ CMMS work orders auto-generated with parts, technician, and optimal timing
Before vs. After: What AI Queue Management Delivers
The operational gap between airports running manual queue observation and those with AI-integrated queue intelligence shows up in every wait time, satisfaction, and financial metric.
Queue Visibility
Visual estimate — "the line looks long"
Precise — per-zone count, actual wait time, per-lane throughput
100% data-driven decisions
Predictive Warning
Zero — cascade discovered when queue forms
30–60 min ahead — alerts before queue exceeds threshold
Cascade events prevented entirely
Staff Deployment
Reactive — extra staff called after queue is already long
Preemptive — staff repositioned 20+ min before demand peaks
40% fewer peak-hour wait exceedances
Missed Connections
47+ empty seats per cascade event — $186K+ airline claims
At-risk passengers identified + priority lane routing
85% reduction in queue-caused misconnections
Passenger Satisfaction
Complaints after the fact — ASQ impact retroactive
Real-time signage + routing reduces perceived and actual wait time
92% satisfaction in AI-managed zones
Regulatory & Industry Drivers Accelerating AI Queue Adoption
Airport Service Quality Standards
ACI's Airport Service Quality (ASQ) programme measures passenger satisfaction at 400+ airports worldwide — and "wait time at security" is consistently the #1 driver of satisfaction scores. Airports deploying AI queue management report 15–25% ASQ score improvements within 12 months — because actual wait times decrease and passenger perception of wait times improves further when real-time information is displayed.
IATA LoS Framework for Terminal Design
IATA's Level of Service (LoS) framework defines maximum acceptable queue times per processing touchpoint: 10 minutes for check-in, 10 minutes for security, 12 minutes for immigration. AI queue prediction enables airports to meet LoS targets consistently — not just on average — by preventing the peak-hour exceedances that drag average performance below standard.
Commercial Revenue Depends on Dwell Time
Airport commercial revenue (retail, F&B, duty-free) correlates directly with post-security dwell time. Every additional minute passengers spend in security queues is a minute lost from the commercial zone. AI-managed queue flow that reduces security wait times by 10 minutes per passenger translates to measurable increases in per-passenger commercial spend — the financial case that funds the technology investment.
Passenger Growth Without Terminal Expansion
Global passenger traffic is projected to reach 5.7 billion by 2027 — exceeding pre-pandemic levels. Most airports cannot physically expand terminals fast enough to match demand. AI queue management extracts 20–35% more effective throughput from existing infrastructure by eliminating the processing gaps, unbalanced lane utilization, and demand-blind scheduling that waste built capacity today.
Implementation Phases: From First Measurement to Full Flow Intelligence
Measurement Foundation
✓ Connect existing CCTV feeds to iFactory computer vision engine
✓ Configure queue zones — security, check-in, immigration, gates
✓ Baseline current wait times, throughput rates, and peak patterns
✓ Quick win: real-time queue dashboard operational within 2 weeks
Prediction & Alerting
✓ Integrate flight schedule data (AODB/FIDS) for demand prediction
✓ Train AI prediction models on 3–6 months of historical + live data
✓ Activate 30–60 min predictive wait time alerts to operations team
✓ Deploy digital signage integration — live wait times displayed to passengers
Digital Twin & Full Optimization
✓ Activate digital twin passenger flow simulation for all terminal zones
✓ Connect infrastructure predictive maintenance to queue capacity planning
✓ Enable passenger routing, connection risk alerting, and mobile integration
✓ Continuous AI model improvement — prediction accuracy compounds with data
Expert Perspective
The fundamental insight that transforms airport queue management is this: a queue that will exceed 30 minutes at 7:15 AM is predictable at 6:45 AM — because the flight schedule tells you exactly how many passengers are coming, the current throughput rate tells you exactly how many you can process, and the gap between demand and capacity tells you exactly what will happen if nothing changes. The airports deploying AI queue prediction have stopped discovering queue problems from passenger complaints and started preventing them with preemptive resource deployment. The technology uses existing cameras, existing data, and existing staff — it just applies intelligence 30 minutes earlier than human observation can. That 30-minute difference is the entire value proposition: it converts cascade events into routine redeployments and missed flights into satisfied passengers.
Frequently Asked Questions
How does AI measure queue wait times using existing CCTV cameras?
iFactory's computer vision engine processes video feeds from existing airport CCTV cameras — no new camera infrastructure required. The AI identifies individual passengers entering the queue zone and tracks their position through to the processing point (security screening, check-in desk, immigration booth). The time difference between queue entry and processing start is the actual measured wait time — calculated for every passenger in real time. Unlike infrared beam counters that only measure entry and exit counts, computer vision provides actual per-passenger wait time, queue density per zone, and per-lane throughput rates updated every 5 seconds. The system operates on standard CCTV feeds — H.264/H.265 encoded, typically 15–30 fps — and processes video at the edge or in the cloud depending on airport network architecture.
Book a demo to see real-time queue measurement in action.
How does AI predict wait times 30–60 minutes ahead?
iFactory's prediction engine combines three data streams: (1) current state — real-time queue length, wait time, and per-lane throughput from computer vision; (2) incoming demand — passenger counts per 15-minute interval predicted from flight schedule data (departure times, aircraft types, load factors, connecting passenger ratios); and (3) historical patterns — how this day-of-week, time-of-day, and seasonal period has historically translated demand into queue formation. The AI model calculates: if current throughput continues at X passengers per lane per minute, and Y passengers are predicted to arrive in the next 30–60 minutes, then wait time at time T will be Z minutes. When predicted Z exceeds the configured threshold, the system alerts the operations team with specific redeployment recommendations calculated from the digital twin.
How does the digital twin simulate queue scenarios?
iFactory's digital twin creates a virtual model of every queue processing point in the terminal — security checkpoints with per-lane throughput characteristics, check-in counters with desk-specific processing rates, immigration booths with officer-specific speeds, and boarding gates with scanning configurations. The twin is fed by real-time measurement data and flight schedule demand forecasts. Operations teams can test "what if" scenarios: "What happens if we close Lane 4 for maintenance at 6:30 AM?" The twin calculates the resulting wait time trajectory at each 5-minute interval. "What if we redeploy 3 officers from Terminal 1 to Terminal 2 at 6:15 AM?" The twin quantifies the wait time improvement in Terminal 2 and the acceptable impact in Terminal 1. Every scenario is quantified in passenger-minutes of delay — enabling data-driven resource allocation. Visit our
Support Center for digital twin passenger flow documentation.
How does predictive maintenance of queue infrastructure prevent capacity loss?
Security screening equipment (X-ray machines, body scanners, explosive trace detectors), automated gates, self-service kiosks, and baggage screening systems all have measurable degradation signatures that precede failure by 2–4 weeks. iFactory monitors equipment health continuously — X-ray image quality degradation, scanner calibration drift, gate mechanism cycle wear, and network connectivity per device. When degradation indicates impending failure, iFactory generates a CMMS work order and simultaneously feeds the digital twin with the planned maintenance window — enabling the operations team to model the queue impact of the lane closure and schedule maintenance during the lowest-demand period that minimizes passenger wait time impact.
How long does deployment take and what results should we expect?
A typical airport deployment runs 12–16 weeks in three phases: Phase 1 (weeks 1–4) connects existing CCTV to computer vision and establishes real-time queue measurement — operational dashboards are live within 2 weeks. Phase 2 (weeks 4–10) integrates flight schedule data, trains prediction models, and activates predictive alerts and digital signage. Phase 3 (weeks 10–16) activates digital twin simulation, infrastructure maintenance integration, and passenger routing. Quick wins — real-time queue visibility and digital signage — are operational within 2–3 weeks. Predictive alerting typically prevents the first cascade event within 60 days, validating the investment. Airports report 40% fewer peak-hour wait time exceedances within 6 months and 15–25% ASQ score improvement within 12 months.
Book a scoping call for a timeline specific to your terminal's camera count and queue zone configuration.
Every Queue Cascade Was Predictable 30 Minutes Before It Happened. AI Proves It.
iFactory's AI queue platform delivers real-time measurement, 30–60 minute predictive wait times, digital twin scenario simulation, and infrastructure maintenance from one connected system — ensuring passenger flow stays within target at every checkpoint, every hour, every day.