Biogas Plant Dashboard KPIs: Gas Yield, Efficiency & Cost Metrics
By oxmaint on March 7, 2026
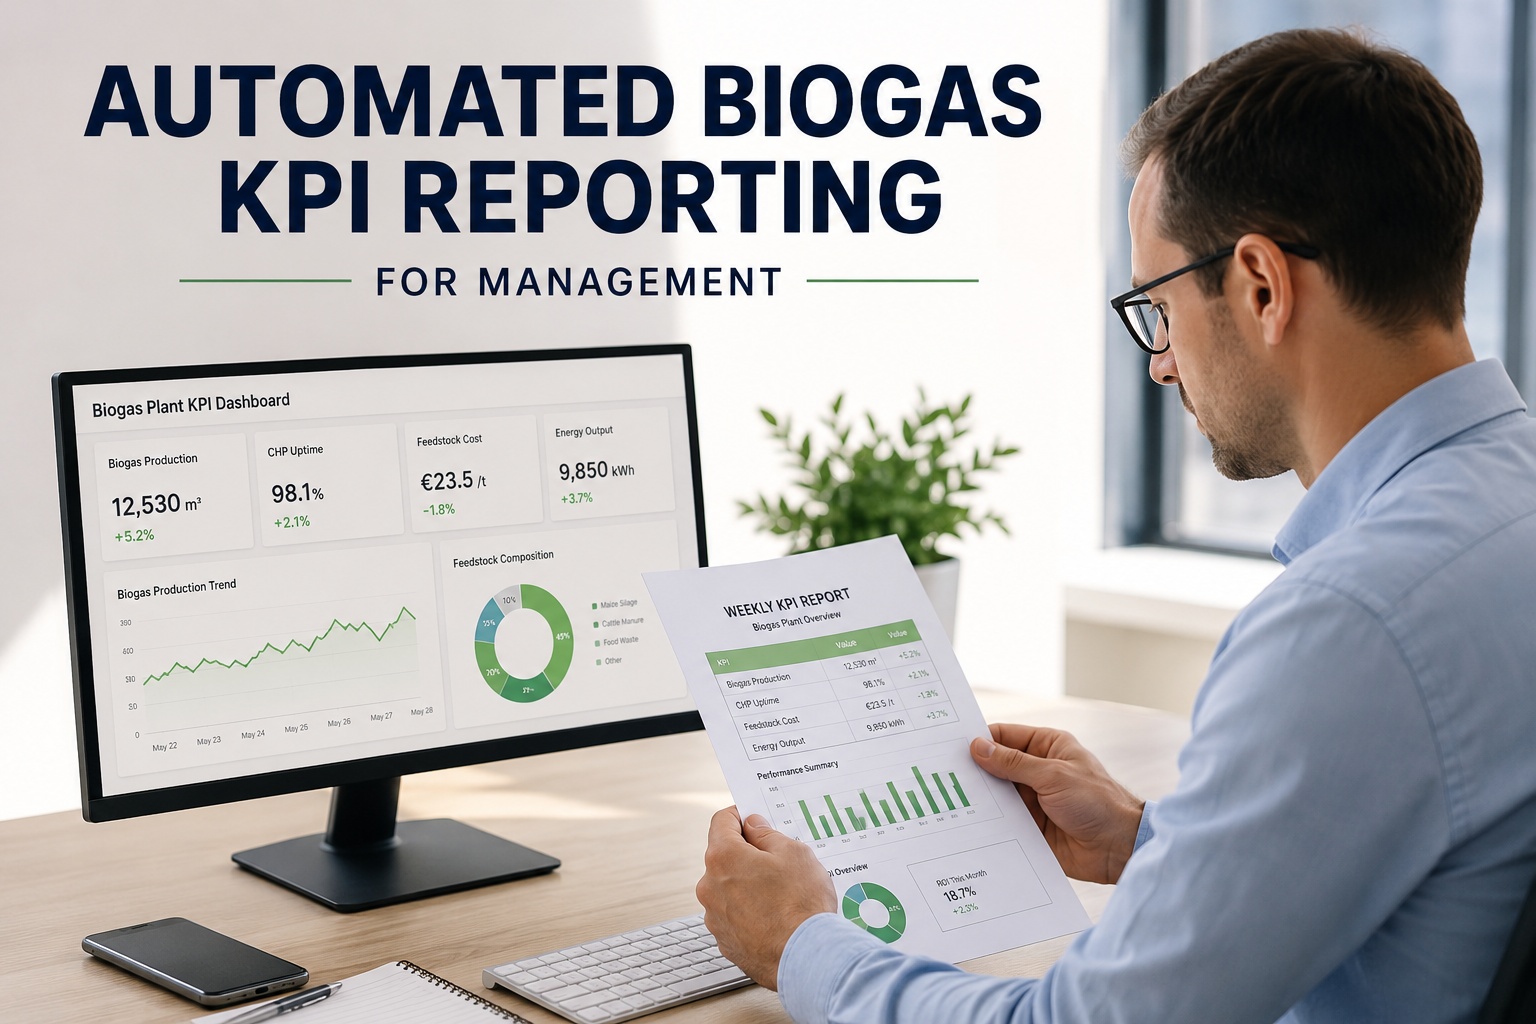
Every cubic meter of biogas your plant produces carries a story—of feedstock quality, digester health, operator decisions, and hidden cost leaks. Without the right KPIs on a centralized dashboard, that story stays buried in sensor logs and monthly spreadsheets. Biogas plant operators who track gas yield, substrate efficiency, and cost metrics in real time consistently outperform those relying on periodic manual checks—capturing up to 15% more output from the same feedstock and cutting unplanned downtime by half. See how a unified KPI dashboard transforms your plant's performance visibility—schedule a walkthrough today.
What Are the Most Important Biogas Plant KPIs?
Biogas KPIs fall into three essential categories: production metrics that measure what your plant generates, efficiency metrics that reveal how well your digestion process works, and financial metrics that determine whether the operation is actually profitable. The global biogas market crossed $48 billion in 2024 and continues expanding—but only plants that measure the right indicators at the right frequency capture their share of that growth.
Production KPIs
Biogas yield per ton, methane content percentage, net gas output, and daily production volume—the metrics that tell you how much usable energy your plant actually creates.
Efficiency KPIs
Plant uptime, feedstock conversion rate, organic loading rate, and parasitic energy consumption—revealing whether your process is running at peak capacity or leaking value.
Financial KPIs
Levelized cost of energy, operating margin, ROI, and cost per ton processed—the numbers that determine whether your plant attracts investment or drains capital.
Ready to see all three KPI categories in one view?
Join biogas operators who have replaced scattered spreadsheets with a single real-time dashboard.
How to Track Biogas Yield and Methane Output in Real Time
Gas yield is the heartbeat of any biogas operation. It determines revenue potential, validates feedstock strategy, and provides the earliest signal when something goes wrong inside the digester. Yet many plants still measure yield only at monthly intervals—missing critical dips that cost thousands in lost output.
01
Biogas Yield per Ton of Feedstock
Primary KPITarget: 50-200 m³/ton
This is the single most direct measure of anaerobic digestion performance. Dairy manure typically produces 25-35 m³ per ton, food waste delivers 100-200 m³ per ton, and industrial organic waste can exceed 400 m³ per ton. Your dashboard should display this metric hourly, with automated alerts when yield drops more than 10% below your rolling 7-day average.
02
Methane Content Percentage
Quality KPITarget: 55-70% (raw) | 97%+ (RNG)
Raw biogas contains 50-70% methane, with the remainder being mostly CO2. For CHP electricity generation, 55-65% methane is workable. For pipeline injection as Renewable Natural Gas, upgrading to 97% or higher purity is required. Track methane content at both the digester outlet and the upgrading system to pinpoint exactly where quality losses occur.
03
Specific Methane Yield (SMY)
Normalized KPITarget: 150-250 Nm³ CH4/ton VS
By expressing yield per ton of volatile solids rather than raw feedstock weight, SMY lets you compare digester performance across completely different input types. Agricultural waste operations should aim for 150-250 Nm³ CH4 per ton VS. This normalized view is essential for multi-feedstock plants and benchmarking against industry standards.
04
Net Biogas Production
Revenue KPITrack: Gross-to-Net Ratio
Gross output minus the biogas consumed internally for digester heating, mixing, and plant operations. This is the actual saleable volume that hits your revenue line. If your net production is less than 75% of gross, your parasitic load is too high and eating into profitability—a problem only visible when both numbers live side by side on your dashboard.
Achieving yield rates above 90% of theoretical maximum should be the operational goal for well-managed facilities. If your dashboard consistently shows performance below this threshold, investigate digester temperature stability, hydraulic retention time, and feedstock volatile solids content. Start tracking yield KPIs with automated alerts configured for your feedstock mix—create your free account in minutes.
Digester Efficiency Metrics Every Operator Should Monitor
High gas yield means nothing if your plant breaks down constantly, your feedstock is poorly utilized, or your digester runs below capacity. Efficiency KPIs reveal the operational health beneath the production numbers—and they are where the biggest hidden savings opportunities live.
95%+
Plant Uptime
The percentage of time your plant is operational versus total available time. Mature biogas operations target 95% or higher. Each percentage point of downtime directly translates to lost RNG volume, missed regulatory credits, and wasted feedstock that degrades in storage.
90%+
Feedstock Conversion Rate
The volume of biogas produced per unit of volatile solids fed into the digester, measured against the theoretical biochemical methane potential (BMP). This is the most direct indicator of anaerobic digestion efficiency—improving it by even 10-15% can transform your financial outlook.
2-5
Organic Loading Rate (kg VS/m³/day)
Too high an OLR causes volatile fatty acid accumulation and process instability. Too low an OLR wastes digester capacity and your capital investment. Monitor this daily against your digester's design parameters and adjust feeding schedules to stay in the optimal range.
20-40
Hydraulic Retention Time (days)
The average time feedstock remains in the digester for mesophilic processes. Shorter retention does not always mean better throughput—it may mean incomplete digestion and lower methane yield. Dashboard tracking helps find the sweet spot between speed and extraction efficiency.
<25%
Parasitic Energy Consumption
The energy consumed internally to run your plant—heating, mixing, pumping, and upgrading. If parasitic load exceeds 25% of gross output, your net energy margin is being quietly eroded. This KPI is often the most overlooked and the most impactful when corrected.
85%+
CHP Engine / Equipment OEE
Overall equipment effectiveness for your combined heat and power units, upgrading systems, and critical pumps. Equipment failures cascade quickly in biogas—one pump failure can halt the entire operation. Track availability, performance, and quality together.
See efficiency metrics in action for your plant type.
Walk through a live dashboard configured for agricultural, municipal, or industrial biogas operations.
Biogas Plant Operating Cost Metrics That Drive Profitability
Biogas plants operate at the intersection of waste management and energy production, creating multiple revenue streams but also layered cost structures. Without dedicated cost KPIs on your dashboard, you might be producing gas profitably on paper while losing money in practice due to hidden feedstock logistics, maintenance spikes, or inefficient energy self-consumption.
Financial KPIs for Biogas Plant Dashboards
Cost Metric
What It Captures
Industry Benchmark
Dashboard Frequency
Levelized Cost of Energy (LCOE)
Total lifetime cost to produce one kWh of energy, including CAPEX and OPEX
6-14 USc/kWh for biogas (comparable to onshore wind)
Monthly calculation, quarterly trend review
O&M Cost as % of CAPEX
Annual operating and maintenance spend relative to initial capital investment
2-7% of capital cost per year (varies by plant scale)
Monthly tracking against annual budget
Cost per Ton of Feedstock Processed
All-in cost including collection, transport, pre-treatment, and digestate handling
$0 for manure/sludge up to $40+/ton for energy crops
Per-delivery tracking for variable feedstocks
Revenue per m³ of Biogas
Combined income from gas sales, tipping fees, carbon credits, and digestate sales
Varies widely—$0.03 to $0.15+/m³ depending on market and credits
Daily revenue tracking, weekly margin analysis
Internal Rate of Return (IRR)
Projected financial return over plant lifetime, critical for investor reporting
10-15% IRR expected by renewable energy investors
Quarterly recalculation with updated actuals
Payback Period
Time required for cumulative revenue to offset initial capital investment
2-7 years for well-planned systems
Updated semi-annually with actual performance data
Small agricultural plants ($5,000-10,000 per kW installed) have different cost profiles than large commercial facilities. Configure dashboard thresholds to match your plant's specific scale and revenue model.
Feedstock Conversion Rate Benchmarks by Input Type
Your KPI targets must reflect the specific feedstocks your plant processes. A dashboard showing "low yield" for a manure-only digester running at 30 m³/ton is actually reporting strong performance—while the same number from a food waste plant would signal serious problems. Context-aware benchmarking is what separates useful dashboards from noisy ones.
Dairy Manure
25-35 m³/ton
Monitor seasonal temperature impact and heating costs
Sewage Sludge
15-25 m³/ton
Track digestate quality compliance and tipping fee revenue
Food Waste
100-200 m³/ton
Watch for contamination rates and pre-treatment efficiency
Maize Silage
170-210 m³/ton
Manage procurement cost per hectare and storage losses
Industrial Organic Waste
Up to 400+ m³/ton
Ensure supply contract reliability and pre-treatment specs
Co-digestion of multiple feedstocks can boost output by 30-60% compared to single-substrate operations. For example, blending food waste with manure significantly increases gas yield while stabilizing the digestion process. A well-configured dashboard displays per-feedstock yield alongside blended performance, so you can optimize your recipe in real time. Get feedstock benchmarking templates calibrated for your region and input types—Get Support and configure them instantly.
How Real-Time Monitoring Prevents Costly Plant Downtime
A biogas plant is a living biological system—temperature swings of even 1°C in thermophilic digesters can disrupt the microbial community and crash production. Manual checks catch these problems days or weeks after they start. Real-time monitoring catches them in minutes.
Temperature Fluctuations
Mesophilic digesters need temperature stability within ±1°C. Thermophilic processes require even tighter control at ±0.5°C. Dashboard alerts trigger the moment temperatures drift outside safe bands.
Organic Overload
Exceeding digester capacity causes volatile fatty acid accumulation and process instability. Real-time OLR tracking prevents operators from pushing past safe feeding thresholds.
Ammonia Inhibition
High ammonia levels from nitrogen-rich feedstocks (above 1.5-3 g NH4-N/L) suppress methanogenic bacteria. Continuous monitoring detects rising concentrations before they crash the process.
Feedstock Composition Shifts
Sudden changes in the C/N ratio (optimal range: 20-30) disrupt microbial balance. Dashboard correlation between feedstock input logs and gas output catches recipe problems within hours, not weeks.
Predictive maintenance driven by KPI dashboards can reduce unplanned repair costs and downtime by up to 50%. When your monitoring system correlates declining CHP engine efficiency with operating hours and vibration data, it schedules maintenance before failure—not after. Explore how automated predictive alerts prevent biogas equipment failures—schedule a live demo with our team.
Manual Tracking vs. Automated KPI Dashboards
The difference between spreadsheet-based tracking and a real-time KPI dashboard is not just speed—it is the difference between managing by hindsight and managing by foresight.
Manual Spreadsheet Tracking
X Monthly meter readings with manual data entry
X Problems discovered days or weeks after they start
X No automated correlation between inputs and outputs
X Financial performance reviewed only at period end
X Operator intuition is the only early warning system
8-15%
potential output lost to undetected inefficiencies
Real-Time KPI Dashboard
✓ Continuous sensor feeds with 1-minute polling intervals
✓ Live cost-per-kWh and margin tracking every cycle
✓ Predictive maintenance prevents failures before they happen
95%+
of theoretical yield captured with continuous optimization
Stop Managing Biogas by Guesswork
Oxmaint centralizes gas yield, efficiency, and cost KPIs into a single dashboard—giving operators, managers, and investors the real-time visibility needed to maximize output and protect margins across every digester in your operation.
What is the single most critical KPI for biogas plant performance?
Biogas yield per ton of feedstock is widely considered the most important KPI because it directly measures how efficiently your anaerobic digestion process converts organic material into energy. However, it must be paired with methane content percentage (which determines energy value) and plant uptime (which determines consistency). A plant producing high yield for 60% of the month may underperform one with moderate yield at 95% uptime. See how yield, methane content, and uptime work together on a unified dashboard—schedule your personalized walkthrough.
How often should biogas plant KPIs be reviewed?
Critical process parameters like digester temperature, pH, and gas flow should be monitored continuously with at least 1-5 minute polling intervals. Daily reviews of yield and uptime help operators catch emerging trends. Weekly efficiency analysis and monthly financial KPI reviews create the reporting cadence that most successful plants follow. The key is matching review frequency to each metric's rate of change—temperature can shift in minutes, while LCOE changes over months.
What methane content should a biogas plant target?
Raw biogas typically contains 50-70% methane, with the balance being CO2 and trace gases. For CHP electricity generation, 55-65% methane is sufficient. For pipeline injection as Renewable Natural Gas (RNG), upgrading to 97% or higher purity is mandatory. Your dashboard should track methane percentage at both the digester outlet and the upgrading system output to identify where quality losses occur. Configure methane tracking with pre-built threshold alerts for your plant—create your account to get started.
How do biogas KPI dashboards help with regulatory compliance?
Modern dashboards automatically calculate CO2 emissions from fuel consumption using standard emission factors, track sustainability credits such as LCFS and RINs, and generate audit-ready compliance reports. This eliminates manual reporting errors, ensures you never miss filing deadlines, and provides documented evidence of environmental performance—protecting both your credit revenue and your operating license.
What does it cost to implement a biogas plant monitoring dashboard?
Costs vary by plant scale and existing instrumentation. Plants with modern SCADA systems already have most sensor infrastructure in place—adding a KPI dashboard layer is primarily a software investment. Plants with limited instrumentation may need flow meters, gas analyzers, and temperature probes (typically $5,000-25,000 depending on monitoring points). The ROI is typically realized within 6-12 months through improved yield, reduced downtime, and optimized feedstock procurement. Get a custom cost assessment and ROI estimate for your specific plant—schedule a free consultation with our engineers.