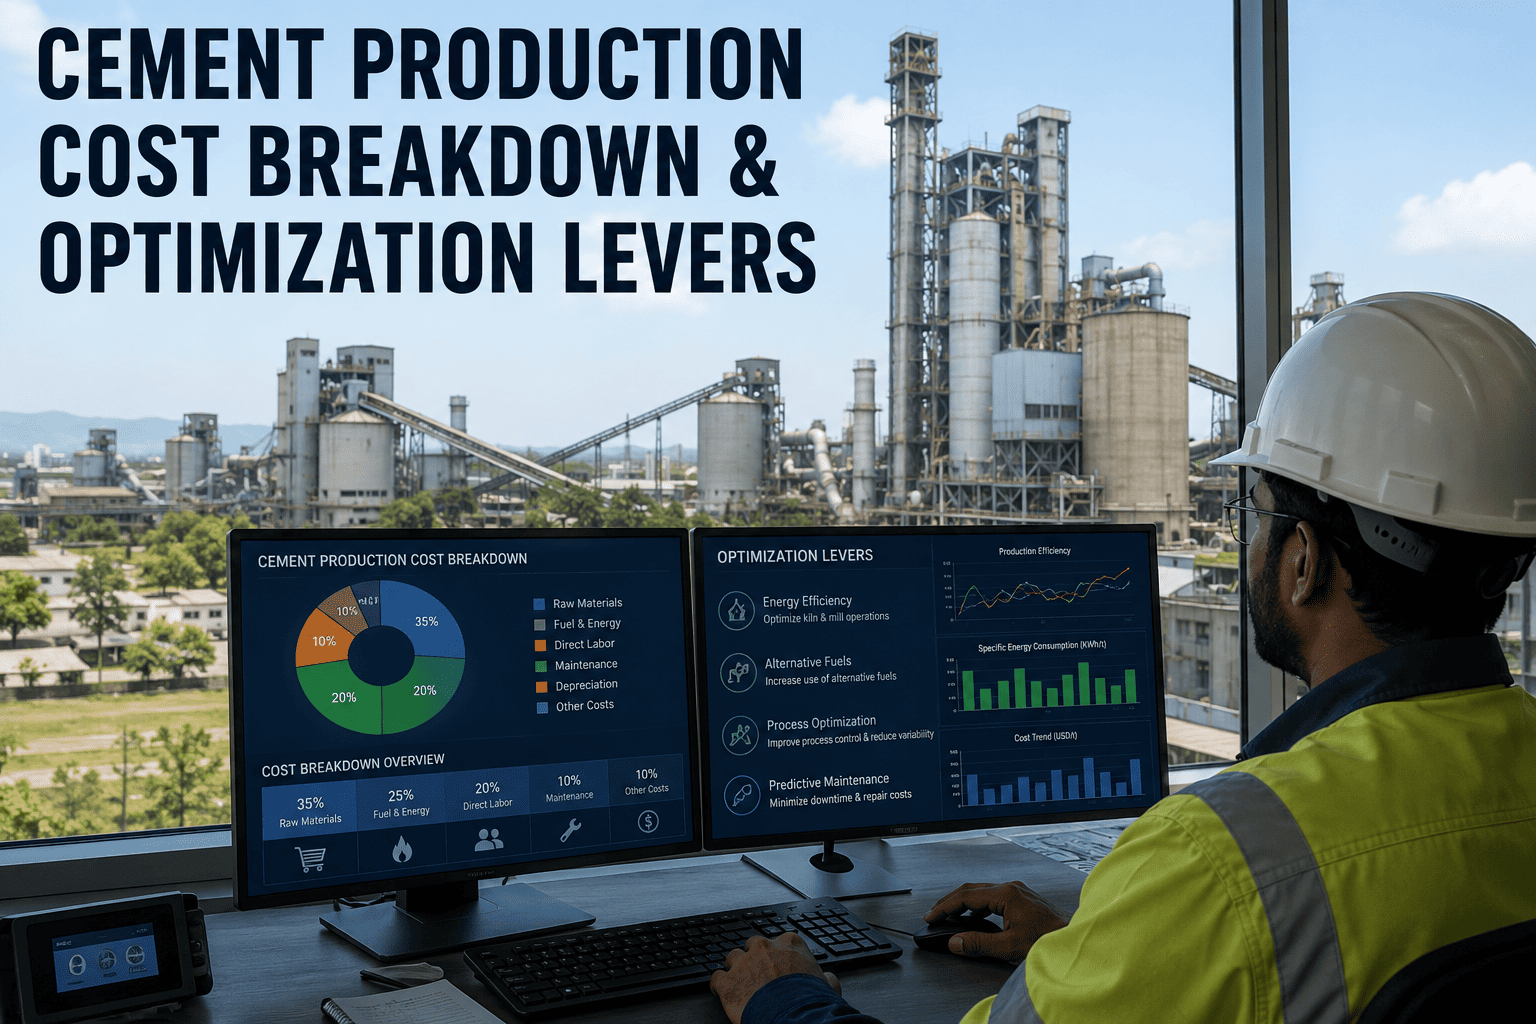
In the highly competitive cement industry, understanding the granular breakdown of production costs is not just a financial exercise — it is a strategic imperative. With global cement demand projected to reach 5.2 billion tonnes by 2028, manufacturers face mounting pressure to optimize every operational lever. The typical cost structure reveals that fuel and energy together account for a staggering 50-60% of total production expenses, followed by raw materials, labor, and maintenance. Yet, many plants still operate with outdated cost models, missing opportunities for 8-15% margin improvement. This comprehensive analysis dissects each cost component — from clinkerization to grinding — and identifies high-impact optimization strategies backed by industry benchmarks. Whether you are a plant manager, procurement head, or CFO, this guide equips you with actionable insights to reduce cost per tonne while maintaining product quality. For a personalized cost optimization roadmap tailored to your plant's specific parameters, Book a Demo with our experts today.
Decoding Cement Production Costs: From Pit to Packing
Unlock 12-18% cost reduction through data-driven optimization of fuel, power, and process parameters. Real results from 40+ plants globally.
Fuel & Thermal Energy
Coal, petcoke, alternative fuels, and natural gas used in the kiln for clinkerization. Thermal energy consumption averages 700-800 kcal/kg of clinker.
Electrical Energy
Power for raw material grinding, kiln drives, cement grinding, and conveying. Specific power consumption ranges 90-110 kWh per tonne of cement.
Raw Materials
Limestone, clay, shale, gypsum, and corrective materials. Mining, crushing, and blending costs vary based on deposit quality and proximity.
Labor & Overheads
Direct wages, supervision, administration, and plant overheads. Automation can reduce labor cost per tonne by 20-30%.
Maintenance & Spares
Preventive and breakdown maintenance of crushers, mills, kilns, and coolers. Predictive maintenance reduces unplanned downtime.
Transform Your Cost Structure Today
Our AI-powered platform analyzes 200+ parameters to identify your top 3 cost reduction levers. Average client saves $4.2 per tonne in first 6 months.
Top 5 Cost Optimization Levers by Impact
Alternative Fuel Substitution
Replace 20-40% of conventional fuel with RDF, biomass, or waste-derived fuels. Reduces thermal energy cost by 15-20% and lowers carbon footprint. Requires investment in feeding system and fuel preparation.
Vertical Roller Mill (VRM) Upgrade
Replace ball mills with VRMs for raw material and cement grinding. Cuts specific power consumption by 25-35% and improves product fineness. Payback period typically 18-24 months.
Waste Heat Recovery (WHR)
Install WHR systems to generate 25-35% of plant electricity from kiln exhaust gases. Reduces purchased power cost by $2-3 per tonne. Typical capacity 8-12 MW for a 1 MTPA plant.
Process Control Automation
Deploy advanced process control (APC) and AI-based optimization for kiln and mill operations. Stabilizes burning zone temperature, reduces fuel variation, and increases throughput by 5-8%.
Predictive Maintenance Program
Implement IoT sensors and ML models to predict equipment failures. Reduces unplanned downtime by 40-60% and maintenance cost by 20-30%. Critical for kiln and crusher reliability.
Cement Production Cost Benchmark (USD per Tonne)
| Component | Asia Pacific | Europe | North America | Middle East | Africa |
|---|---|---|---|---|---|
| Fuel & Thermal | $10.5 | $14.2 | $12.8 | $9.1 | $11.6 |
| Electrical Energy | $6.8 | $8.5 | $7.9 | $6.2 | $7.4 |
| Raw Materials | $3.9 | $4.8 | $4.5 | $3.5 | $4.2 |
| Labor & Overheads | $2.8 | $5.2 | $4.6 | $2.5 | $3.1 |
| Maintenance & Spares | $2.1 | $3.0 | $2.7 | $1.9 | $2.3 |
| Total Cost per Tonne | $26.1 | $35.7 | $32.5 | $23.2 | $28.6 |
Data sourced from 2024 industry reports and client benchmarks. Actual costs vary by plant age, technology, and local energy prices.
Case Study: 14% Cost Reduction in 9 Months
A 2.5 MTPA cement plant in India implemented a comprehensive cost optimization program using iFactory's platform. Key actions included 25% alternative fuel substitution, VRM upgrade for slag grinding, and APC installation on the preheater tower. Fuel cost dropped by 18%, power cost by 12%, and maintenance cost by 22%. Total annual savings exceeded $9.5 million. The plant achieved payback on the technology investment in 14 months.
Read the full case study or Book a Demo to see how we can replicate this success at your plant.
Frequently Asked Questions
What is the typical cost breakdown for cement production?
The typical cost breakdown for cement production consists of fuel and thermal energy (30-40%), electrical energy (20-25%), raw materials (10-15%), labor and overheads (8-12%), and maintenance and spares (5-8%). These percentages vary based on plant location, technology, and fuel mix. For a detailed analysis of your specific cost structure, Book a Demo with our cost optimization specialists.
How can I reduce fuel costs in cement manufacturing?
Reducing fuel costs can be achieved through several strategies: substituting 20-40% of conventional fuels with alternative fuels like RDF, biomass, or tire-derived fuel; optimizing kiln combustion parameters using advanced process control; improving preheater efficiency to reduce thermal energy consumption; and implementing waste heat recovery to generate power. Each strategy has different ROI and implementation timelines. To determine the best approach for your plant, Book a Demo for a personalized assessment.
What is the impact of automation on cement production cost?
Automation can reduce cement production costs by 8-15% through multiple levers: advanced process control (APC) stabilizes kiln operations, reducing fuel variation by 5-10%; predictive maintenance lowers unplanned downtime by 40-60%; and automated quality control minimizes waste and rework. Labor costs can also decrease by 20-30% as manual tasks are automated. The total savings depend on the current automation level and plant size. For a detailed automation roadmap, Book a Demo today.
How does raw material quality affect cement production costs?
Raw material quality directly impacts production costs in several ways: lower limestone grade increases grinding energy and fuel consumption for decarbonation; high moisture content requires additional drying energy; and variability in chemical composition leads to kiln instability and clinker quality issues. Blending with corrective materials like fly ash or slag can mitigate these effects but adds handling costs. On average, poor raw material quality can increase production costs by 5-10%. For a cost impact analysis of your raw materials, Book a Demo.
What is the benchmark for cement production cost per tonne globally?
Global cement production cost benchmarks vary by region: Asia Pacific averages $26-28 per tonne, Europe $35-38, North America $32-34, Middle East $23-25, and Africa $28-30. These figures include all cost components — fuel, power, raw materials, labor, and maintenance. Best-in-class plants achieve costs 15-20% below regional averages through advanced technology and operational excellence. To benchmark your plant against industry leaders, Book a Demo for a confidential cost comparison report.
Ready to Slash Your Cement Production Costs?
Join 40+ cement plants worldwide using iFactory's AI-driven platform to achieve 10-18% cost reduction. Get your personalized optimization plan in 48 hours.