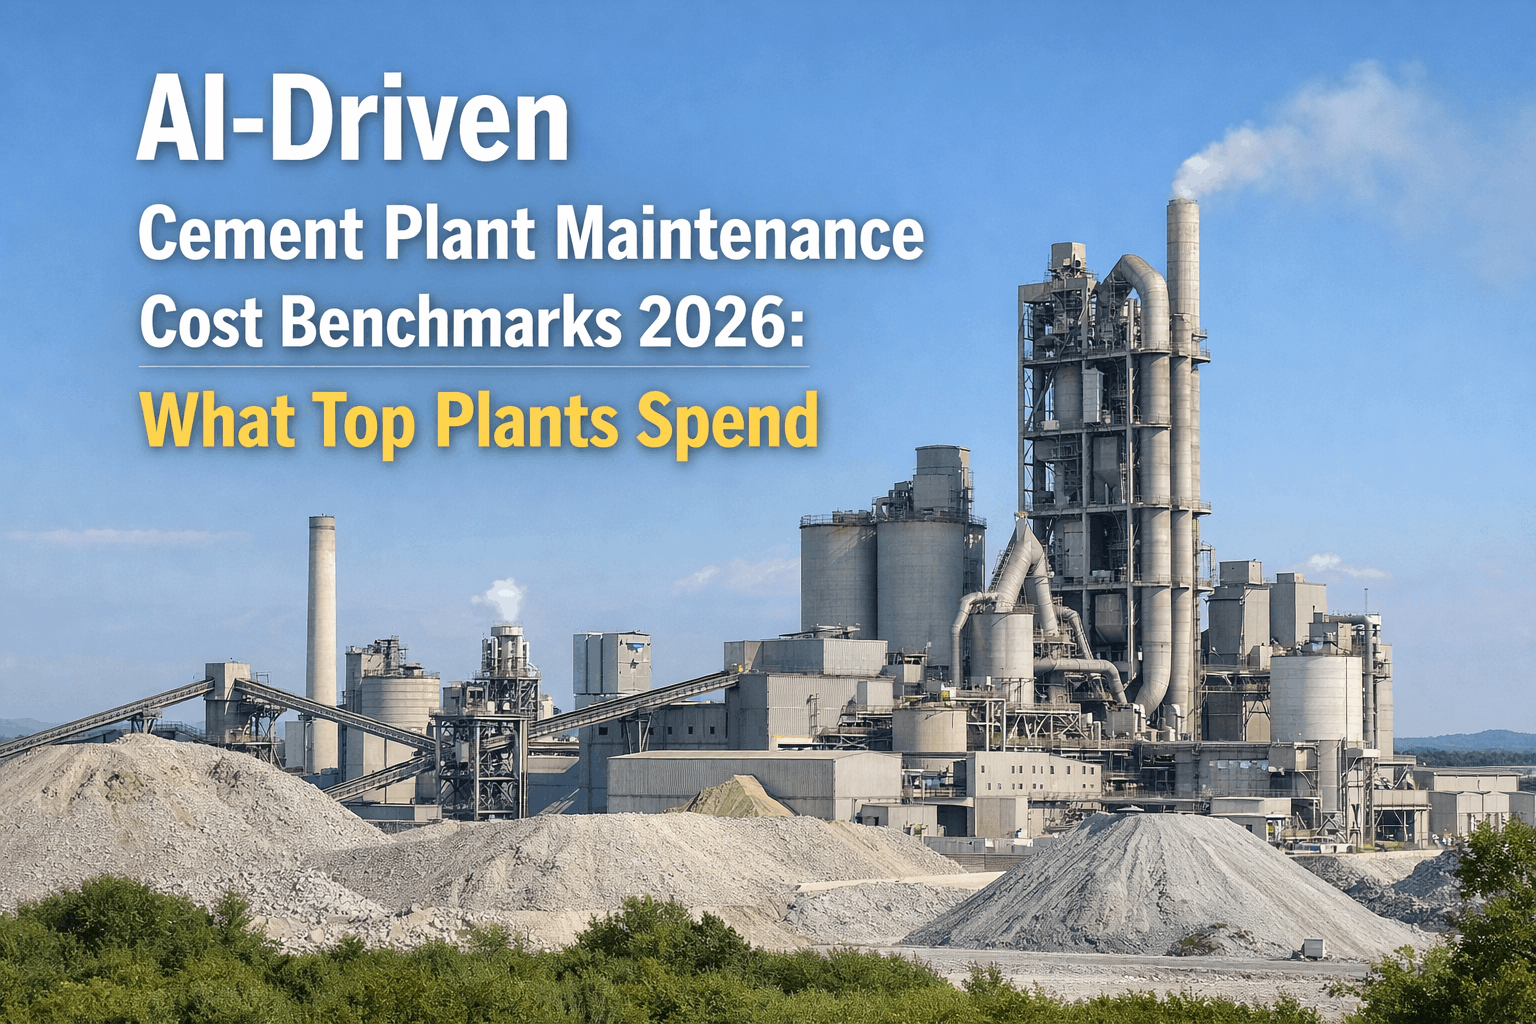
Cement plant maintenance budgets have always been substantial — but in 2026, the gap between plants that manage those budgets intelligently and those that do not has never been wider. The best-performing operations now spend $3.50–$5.50 per ton of cement produced on total maintenance, while industry laggards are burning through $9–$14 per ton on the same assets — nearly three times more, with worse equipment reliability to show for it. The difference is not fleet age or plant size. It is data. AI-driven cost analytics platforms give maintenance leaders real-time visibility into where every maintenance dollar goes, which assets are consuming disproportionate budget, and exactly where AI intervention delivers the biggest savings. This benchmark guide breaks down what top quartile cement plants actually spend in 2026 — and the AI strategies driving those numbers down year over year.
The Numbers Every Cement Plant Should Know
These benchmarks are derived from operational data across mid-to-large cement plants (2,000–6,000 TPD kiln capacity) implementing AI-assisted maintenance management. Use these as your calibration points for 2026 budget planning.
| Metric | Top Quartile | Industry Average | Bottom Quartile |
|---|---|---|---|
| Maintenance cost per ton produced | $3.50 – $5.50 | $6.50 – $8.00 | $9.00 – $14.00 |
| Maintenance spend as % of revenue | 2.1% – 2.8% | 3.8% – 4.6% | 6.0% – 9.5% |
| Maintenance spend as % of asset replacement value | 1.8% – 2.4% | 3.0% – 4.2% | 5.5% – 8.0% |
| Reactive (breakdown) maintenance share | 12% – 18% | 38% – 52% | 65% – 80% |
| Planned vs emergency work order ratio | 85:15 | 55:45 | 30:70 |
| Kiln availability rate | 92% – 96% | 82% – 88% | 68% – 76% |
Where Maintenance Budget Actually Goes
Understanding the budget split across equipment categories is the foundation of AI-driven cost optimization. In a typical 4,000 TPD cement plant, maintenance spending clusters heavily around four major asset groups — and AI analytics reveals that two of them consistently absorb far more than their share. Sign up for iFactory to map your plant's actual cost distribution against these benchmarks.
Typical budget allocation for a 4,000 TPD cement plant. AI analytics consistently reveals that kiln and grinding systems are over-budget relative to their criticality when reactive maintenance dominates the work order mix.
The Five Areas Where AI Cuts Maintenance Costs Most
Not all maintenance cost reduction opportunities are equal. AI platforms generate data that consistently points to five high-impact zones where the gap between top-quartile and average plants is widest — and where intervention delivers the fastest measurable ROI. Book a demo to see how iFactory maps these savings opportunities against your current cost structure.
Emergency repairs cost 3–5x more than planned repairs for the same work scope. AI predictive models identify equipment degradation 2–6 weeks in advance, converting emergency events into scheduled work orders. Plants shifting from 50% reactive to 15% reactive maintenance unlock the single largest maintenance cost reduction available.
Most cement plants carry 30–40% excess spare parts inventory — capital locked in warehouse shelves as insurance against failures that AI analytics can now predict. AI demand forecasting aligns parts procurement precisely with predicted failure windows, freeing working capital without increasing downtime risk.
Unplanned contractor mobilizations carry significant premium costs — emergency rates, expedited travel, and overtime. AI-optimized work order planning maximizes contractor utilization during planned windows, reduces mobilization events, and enables volume-based contractor negotiations built on accurate forward demand data.
Kiln refractory is the single most expensive recurring maintenance item in cement. AI thermal imaging and wear-rate modeling predict remaining refractory life with precision — enabling condition-based replacement rather than calendar-based replacement, extending brick campaigns by 15–25% without increasing hotspot risk.
Over-lubrication and under-lubrication are equally damaging to cement plant bearings — and both are endemic in plants relying on calendar-based lubrication schedules. AI sensor integration monitors actual operating conditions and triggers lubrication events based on real need, extending bearing life and reducing consumption costs simultaneously.
For plant managers preparing 2026 maintenance budgets, these five categories represent the most defensible ROI case for AI investment. A plant currently spending $8.00 per ton on maintenance that shifts to top-quartile performance at $5.00 per ton recovers $3.00 per ton — on a 1.5 million ton plant, that is $4.5 million in annual savings. Sign up for iFactory and start tracking which of these five categories holds your biggest cost reduction opportunity.
Maintenance-to-Revenue: The CEO's Benchmark
While operations teams track cost per ton, financial leadership monitors maintenance spend as a percentage of revenue — the metric that connects maintenance performance directly to margin and competitive position. AI analytics platforms produce this ratio automatically, segmented by asset class, and benchmarked against industry data in real time.
For a cement plant generating $120M annual revenue, the difference between top-quartile and average maintenance-to-revenue performance represents $3.0 million in annual savings — and between top and bottom quartile, $7.3 million.
How AI-Driven Plants Build Their Maintenance Budget
Traditional maintenance budgeting in cement plants is a top-down exercise: last year's spend plus an inflation factor. AI-driven budget planning reverses this entirely — building the budget from the bottom up, from actual equipment condition data, predicted failure probabilities, and optimized intervention schedules. Book a demo to see how iFactory generates AI-based maintenance budget forecasts for cement operations.
AI aggregates sensor data, inspection history, and failure records to produce a current health score for every major asset. This replaces estimated useful life assumptions with actual condition data.
Machine learning models calculate failure probability curves for each asset over the budget year. High-probability events translate directly into planned budget line items — not surprises.
AI compares intervention timing options — acting now vs deferring — weighting the cost of planned repair against the expected cost of failure. The budget reflects the lowest total cost path for each asset.
The planned work order calendar drives a 12-month resource demand forecast — skills, hours, and contractor mobilization windows — enabling advance procurement and volume-based contract negotiation.
Through the year, AI tracks actual maintenance spend against the budget in real time — surfacing variances, flagging emerging over-budget assets, and recalibrating forecasts as conditions change.
Your maintenance budget deserves AI-grade intelligence.
iFactory transforms maintenance cost management from an annual spreadsheet exercise into a live, data-driven operating advantage. Top-quartile performance starts with the right platform.
Join cement plants reducing maintenance cost per ton by 30–45% with iFactory AI analytics.
The transition from reactive to predictive maintenance management is not a single technology purchase — it is an operational transformation that requires consistent data capture, AI analysis, and management commitment to acting on what the data reveals. Plants that have completed this transition consistently land in the top quartile of these benchmarks within two to three annual cycles. Sign up for iFactory to begin building the data foundation that makes top-quartile performance achievable for your plant.