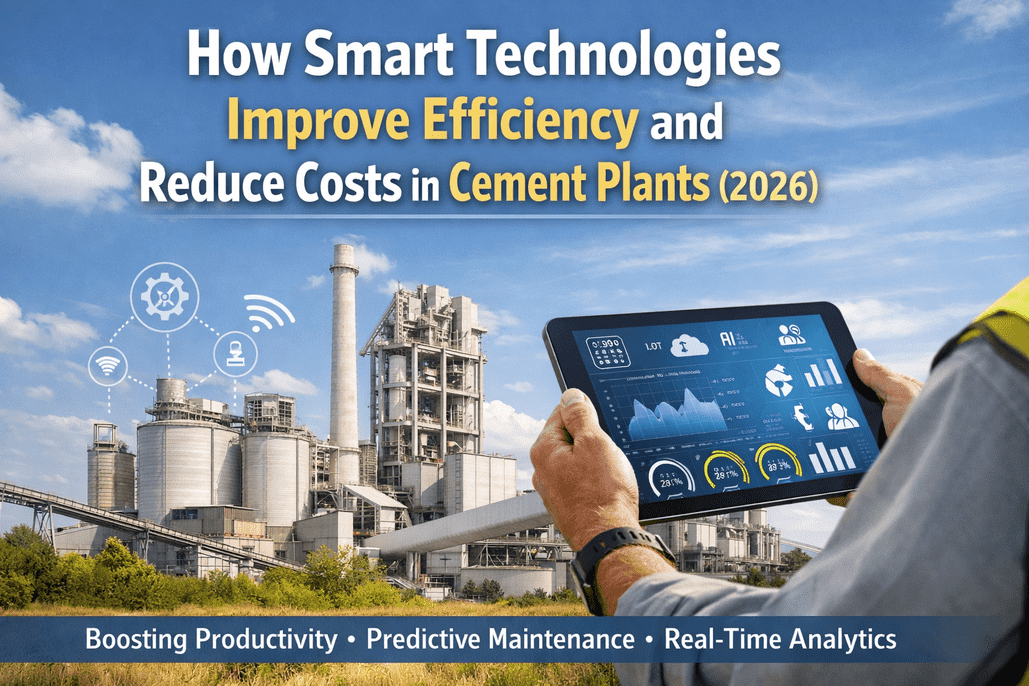
As energy volatility transitions from a quarterly concern to a daily operational threat, cement plant managers are finding that yesterday's monthly spreadsheets no longer guarantee margin stability. An energy strategy based on "looking back" at last month's utility bill now faces grid price spikes and carbon taxes that can erase profit in hours. In 2026, real-time energy visibility is no longer an optional "green" initiative—it is a core fiduciary responsibility for heavy industry. Achieving energy self-sufficiency demands a shift from static, reactive reporting to a dynamic, predictive **Smart Energy Dashboard** model. This guide outlines the framework for cement plant energy adaptation, leveraging AI-driven cost modeling and real-time smart-meter networks to protect production margins before the next demand surge arrives. Book a free demo to digitize your energy roadmap.
Smart Energy Dashboards & Strategic Decarbonization for Cement Plants
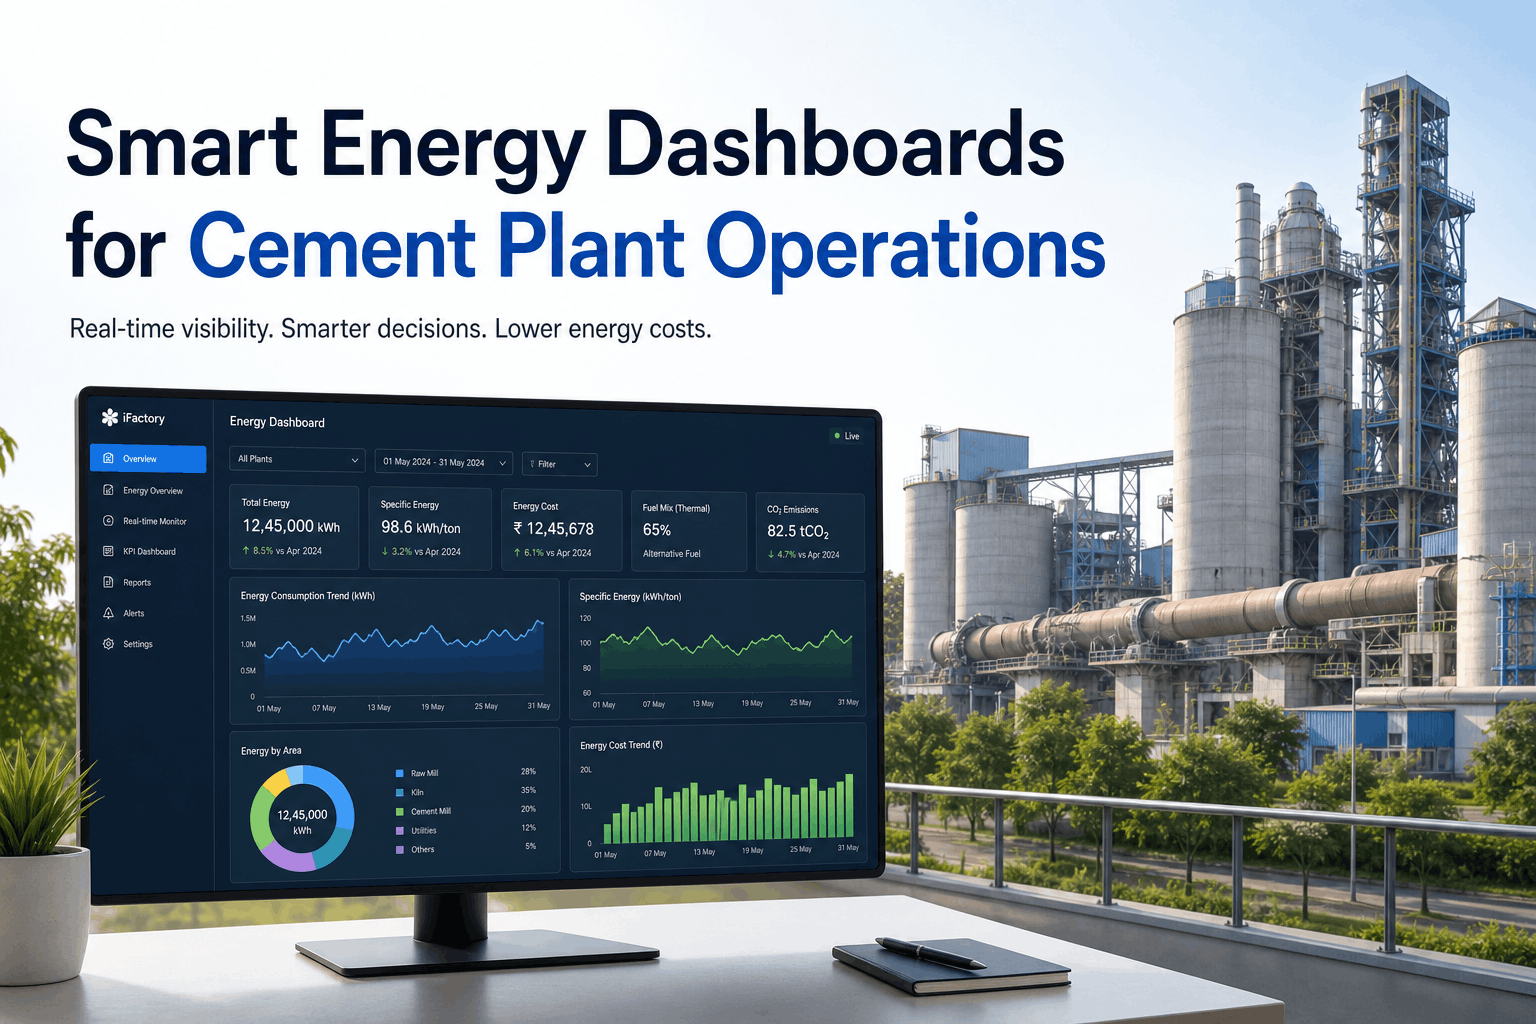
A comprehensive technical roadmap for deploying AI-powered energy analytics to visualize power, fuel, and carbon intensity across all production stages from crushing to packing.
Energy Inefficiencies Your Cement Mill Cannot Afford to Ignore
Traditional plants were built for stable utility prices. Today, managers must defend against six primary energy-driven failure modes that threaten operational continuity and corporate credit ratings. Schedule a consultation.
Invisible Energy Leaks
Manual meter readings miss sub-metering inefficiencies in massive fan motors and compressors. iFactory's live dashboards identify "phantom loads" during kiln shutdowns, saving thousands in unearned power costs.
Untracked Peak Demand Surges
Starting large mills simultaneously triggers catastrophic demand penalties. Our predictive dashboards forecast "Demand Peaks" and suggest optimal startup sequences to keep you below your utility-contracted limit.
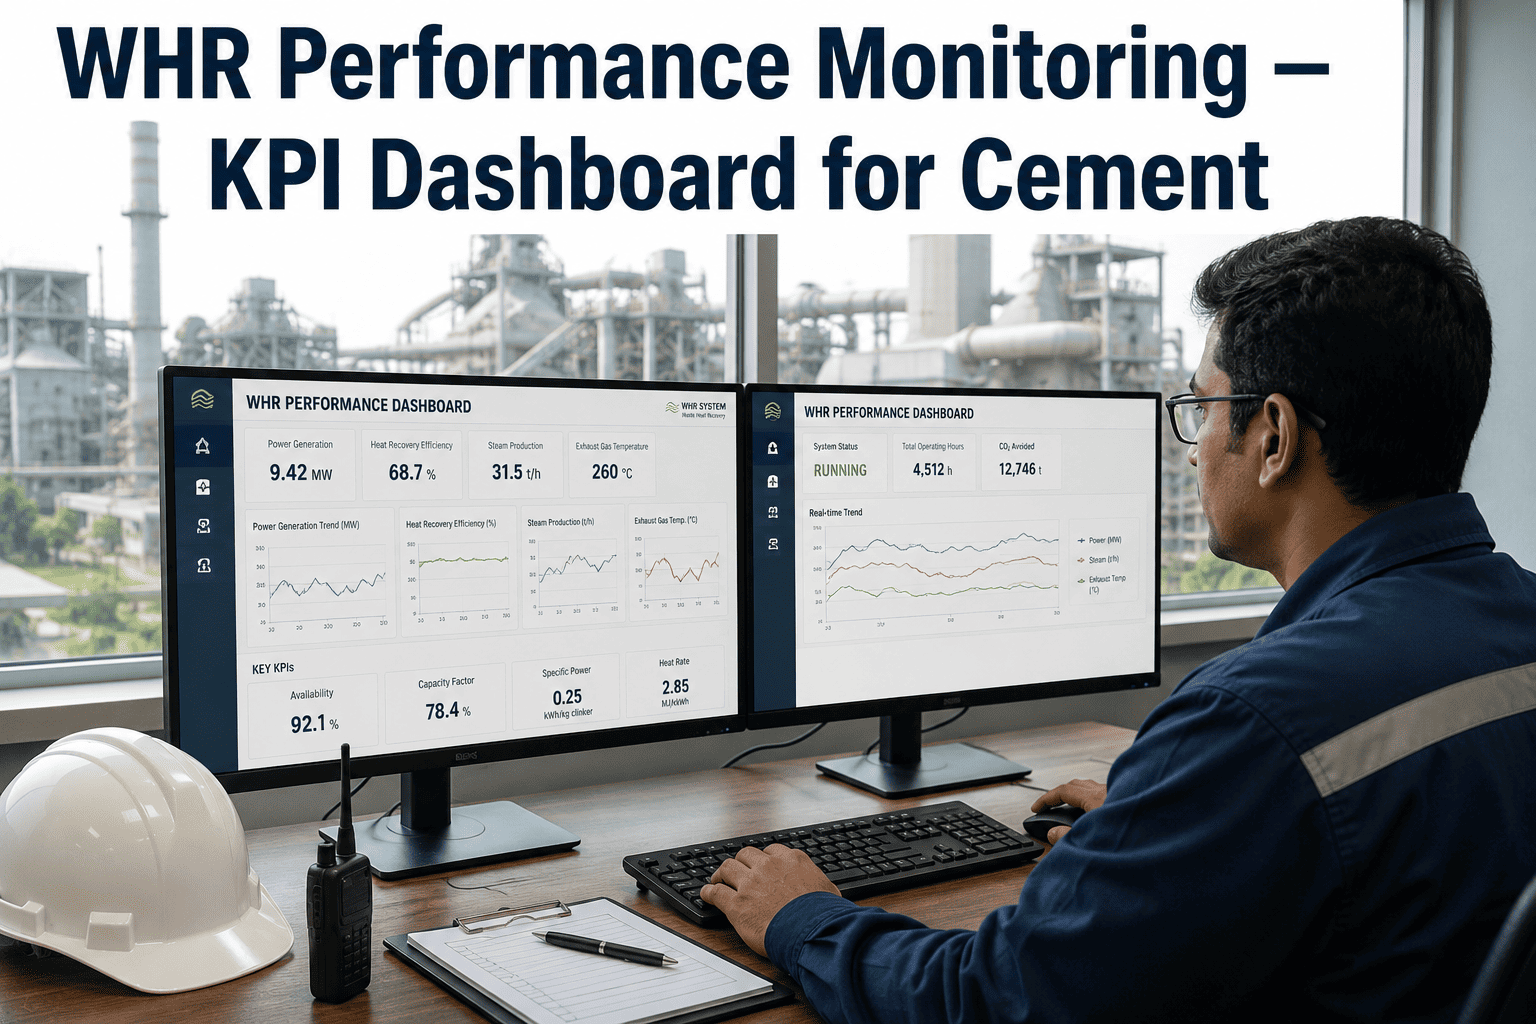
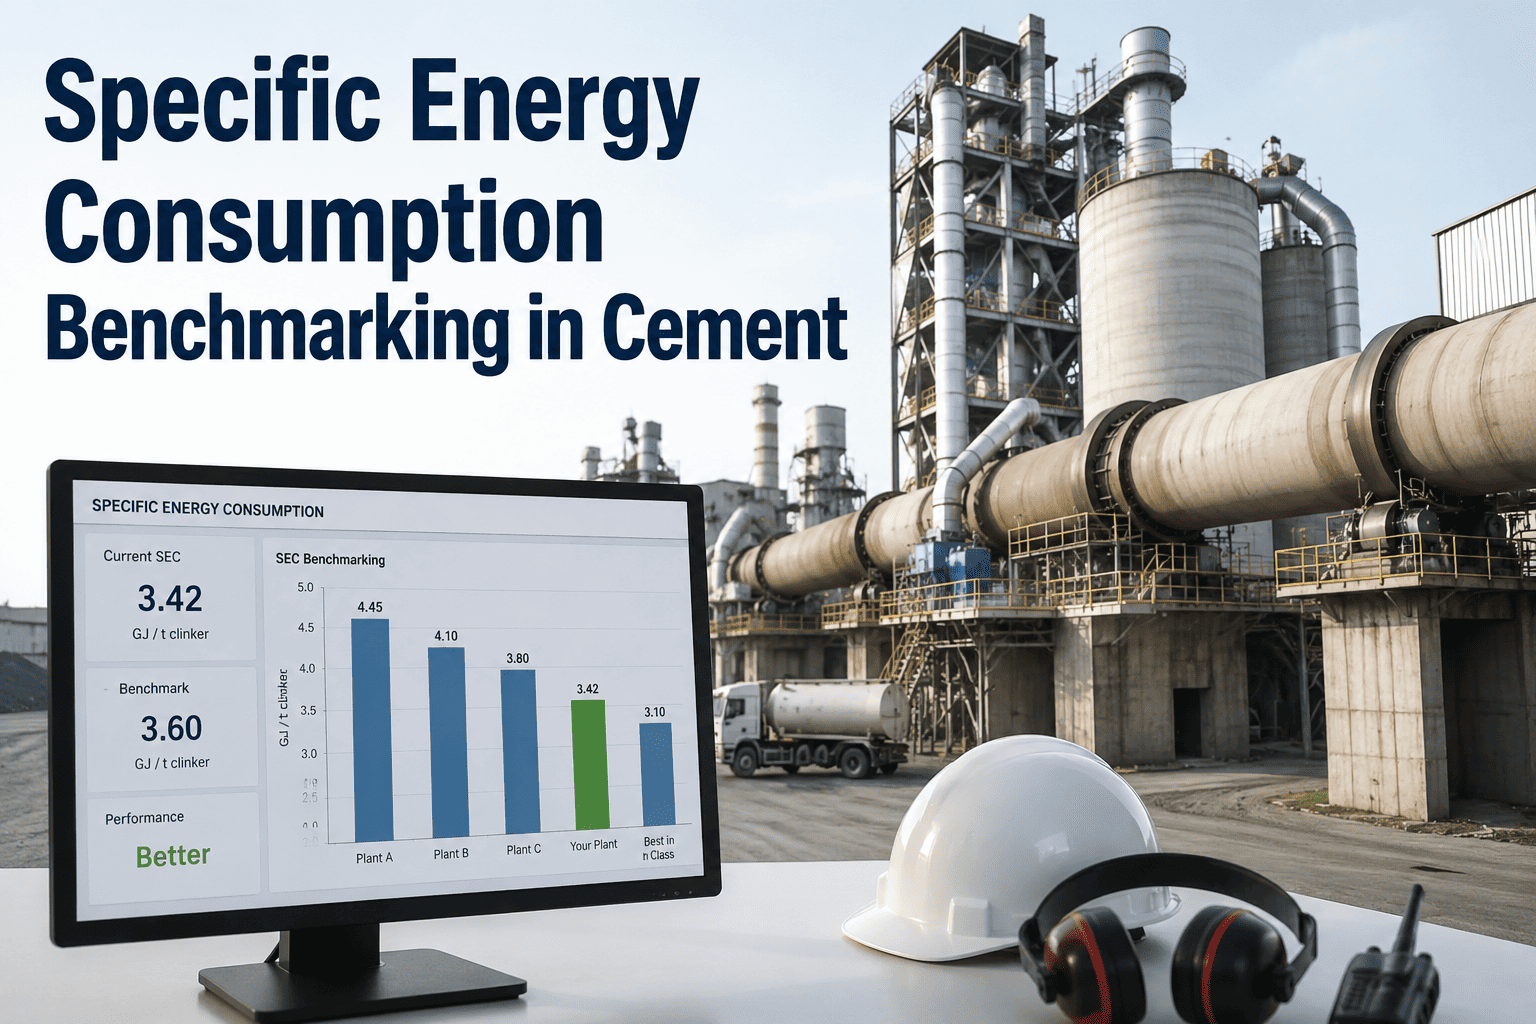
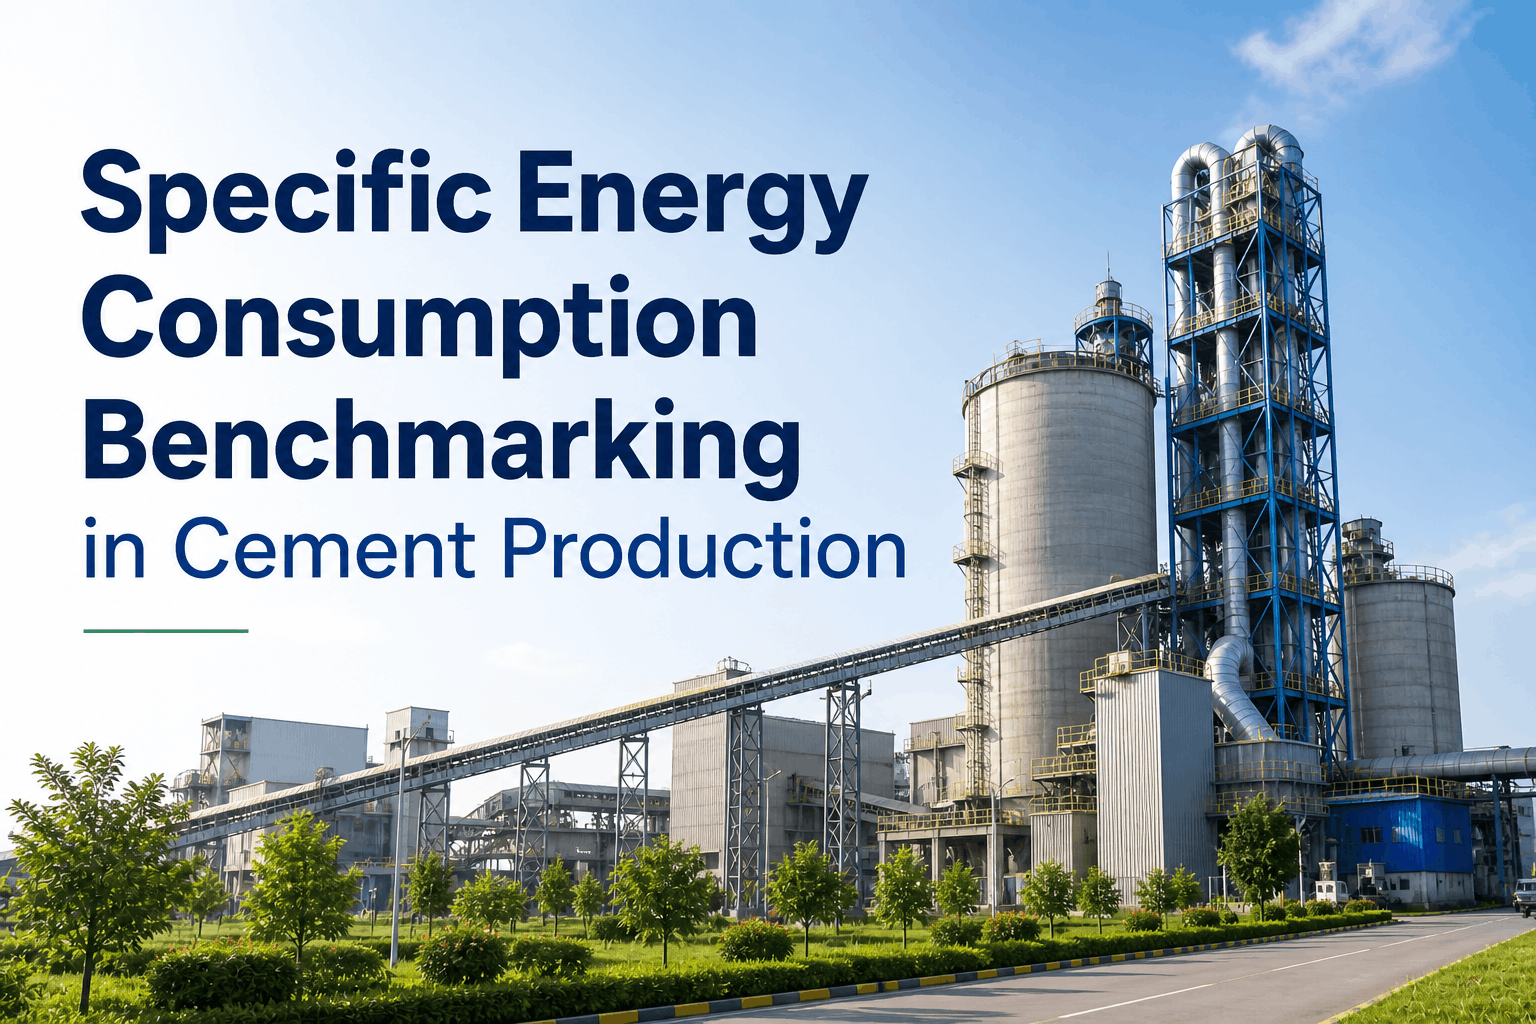
Baseline Invisibility (SEC)
Specific Energy Consumption (kWh/tonne) fluctuates wildly based on clinker quality. iFactory normalizes your energy data against production volume, providing a true efficiency baseline for every shift.
Siloed Departmental Data
Electrical and process departments rarely share real-time energy risk data. Our dashboards break these silos, showing how kiln thermal instability cascades into increased electrical load on preheater fans.
Compliance Audit Delays
Relying on manual spreadsheets for ISO 50001 audits takes months. iFactory's energy twin provides "Instant Transparency," flagging non-compliance within minutes, prioritizing your energy team for critical fixes.
Reactive Maintenance Loops
Energy surges often precede mechanical failure. We monitor power quality and motor torque to predict "stress zones," allowing for targeted maintenance before an expensive mill motor burns out. Book a demo.
Why Legacy "Monthly Reporting" Creates Financial Risk
Traditional energy reporting is a post-mortem exercise. A dynamic, dashboard-driven approach is now required to maintain cement mill service levels and margin stability.
Historical Bias Failure
Old reports assume next month's energy costs will mirror the last. This misses the volatility of dynamic grid pricing, leading to unbudgeted expenditures that erase production profit margins.
The "Reactive Funding" Trap
Plants lacking data-backed energy dashboards often miss out on federal decarbonization grants. Proactive visualization is now a requirement for non-discretionary sustainability funding.
Manual Audit Delays
Analyzing thousands of sub-meter points manually post-quarter takes weeks. iFactory's digital twins provide "Instant Visibility," flagging compromised efficiency zones within minutes of a shift change.
Unverified ROI on Upgrades
Without live dashboards, the actual energy savings from an IE4 motor or a new VFD remains theoretical. We provide the "Verification Layer" that proves your CapEx investments are actually delivering.
Secure Your Plant's Future with iFactory Energy AI Dashboards
iFactory provides the predictive analytics and real-time visualization required to transform energy-intensive cement operations into optimized, climate-hardened assets.
From SEC tracking to peak-shaving automation, our platform integrates directly with your SCADA and smart-meter networks to deliver an actionable energy roadmap. Automate your ISO 50001 and ESG compliance reporting while securing your plant's credit rating through verified energy reduction. Schedule an energy audit.
Energy Architecture: Four Deployment Models for Visualization
Cement producers can deploy energy technology across four distinct architectural tiers, from purely predictive modeling to fully autonomous adaptive grids.
Predictive Energy Twin
A 4D digital twin of the entire plant that simulates energy scenarios (e.g., kiln startup with 3 mills active). It identifies exactly where the peak demand limit will be breached. Book a demo today.
Real-Time IoT Metering Mesh
Deployment of high-frequency sub-meters across all high-torque motors. This "Live Nervous System" triggers automated efficiency alerts and deploys electrical teams to critical assets before they overheat.
Alternative Fuel Tracking (AFR)
Monitoring the thermal substitution rate (TSR) and NCV volatility of waste fuels. We use real-time calorific modeling to ensure your alternate fuel mix is optimized for maximum coal displacement.
Autonomous Adaptive Grids
Direct integration with SCADA to automatically load-balance the plant during a utility price excursion. This "Self-Healing" energy model requires the high-fidelity data iFactory provides. Talk to our engineer.
Regulatory Frameworks Driving Dashboard Investment
2026 mandates from federal and international bodies now require verifiable energy risk assessments for almost all industrial funding and insurance renewals.
The Evolution of Cement Energy Visualization
From analog meters to smart energy twins: how the methodology of industrial protection has transformed in the 21st century.
Analog Metering Era
Emphasis on massive manual clipboards and weekly meter logs. No intelligent monitoring; these systems were often blindsided by "ghost loads" that escaped static observation.
SCADA Baseline Integration
Widespread realization that energy needed to be tied to process data. Installation of early energy management software, but still lacking real-time cross-departmental connectivity.
The Rise of Cloud Analytics
First major industrial IoT initiatives. Focus on cloud-based storage, but difficulty in quantifying actual peak-shaving performance for regulatory audits.
Federal Decarbonization Funding
Infrastructure laws mandate energy-consideration for all industrial grants. Efficiency becomes a data task; plants begin integrating GIS and grid patterns to justify spending.
Autonomous Energy Hardening
The current standard: iFactory AI manages predictive demand-shaving, fuel-mix balancing, and sensor-based SEC warning. 100% data transparency becomes the baseline.
Static Reporting vs. AI-Powered Dashboards
A visual comparison of how plants respond to energy excursions using traditional methods versus the iFactory adaptive model.
High-Cost Vulnerability
Margin Continuity Guaranteed
How iFactory Delivers Energy Continuity
iFactory isn't just a dashboard—it's a plant-wide nervous system designed to withstand the stress of a volatile energy market. Our platform integrates deep-learning price models with high-fidelity asset data to provide an objective, real-time view of your plant's SEC and cost-performance. Book a demo today.
From motor efficiency monitoring to fuel substitution tracking, iFactory provides the "Record of Resilience" that stakeholders demand. We ensure that every dollar spent on energy efficiency is measurable, verifiable, and optimized for maximum margin impact.
For large-scale cement groups with multi-site operations, iFactory supports a federated energy model, allowing regional plants to maintain their specific workflows while sharing a unified corporate energy layer. This ensures that no "Siloed Inefficiency" cascades through the group's financial reports. Talk to our energy engineer.
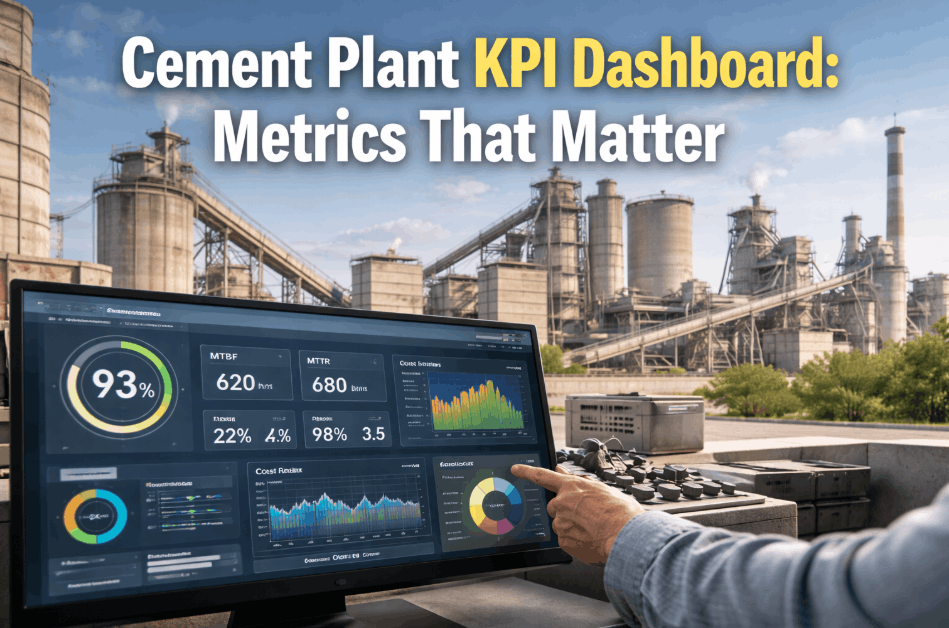
Quantifying the Dashboard Advantage
Cement producers that have transitioned to AI-driven energy visualization show measurable improvements in post-audit recovery speed and long-term asset lifespan.
Ready to Build an Energy-Optimized Smart Plant?
Speak with an iFactory energy specialist today about deploying predictive dashboards across your plant's critical asset network.
Whether you are planning AFR integration, hardening electrical substations, or mitigating peak-demand effects, iFactory provides the data infrastructure your margins depend on. Secure your grants, protect your assets, and guarantee continuity for the next decade. Book your energy demo now.
Smart Energy Dashboards: Frequently Asked Questions
Q: How does iFactory energy data help with corporate ESG ratings?
By providing verified data on energy reduction, iFactory proves you are less vulnerable to carbon taxes. This often results in lower borrowing costs and better positioning with global rating agencies.
Q: Can your dashboards integrate with our existing ABB/Siemens SCADA?
Yes, iFactory sits on top of your existing OPC-UA and Modbus layers to ingest plant-wide data. We layer real-time market pricing over this baseline to provide dynamic efficiency alerts instantly.
Q: What is the difference between "Energy Monitoring" and "Energy Analytics"?
Monitoring shows live consumption, while analytics predicts future demand peaks and prescriptive fixes. iFactory manages both to tell you exactly how starting a mill will impact your shift costs.
Q: How do dashboards handle multi-site energy benchmarking?
We provide a global layer that normalizes performance across different equipment vintages and regional costs. This allows corporate heads to identify and transfer efficiency best practices across the entire fleet.
Q: Is iFactory compliant with ISO 50001 energy review requirements?
Our data formats are specifically tuned to the ISO 50001:2018 energy review process for audits. This ensures your technical documentation is "Audit-Ready" from day one, saving hundreds of manual hours.
Q: What are the primary benefits of peak shaving in cement plants?
Peak shaving reduces high-demand utility charges by shifting non-critical loads to off-peak hours. This optimization protects profit margins from volatile grid pricing during high-production cycles.
Q: How does real-time monitoring reduce Specific Energy Consumption (SEC)?
Live tracking identifies invisible energy leaks and motor inefficiencies as they occur on the floor. Immediate corrective action ensures your kWh/tonne remains within optimized global benchmarks.
Q: Can energy dashboards track Scope 3 carbon emissions?
Yes, iFactory integrates supply chain data to visualize upstream and downstream carbon footprints. This provides a comprehensive record for transparency requirements in global sustainability reporting.
Q: What is the typical deployment timeline for a smart energy twin?
Most plants achieve full data connectivity and baseline visualization within 4 to 6 weeks. Our engineer-led implementation ensures zero disruption to your active production schedules.
Q: Does the platform support automated utility billing verification?
iFactory automatically reconciles meter data against utility tariffs to flag billing errors instantly. This verification layer often recovers thousands in overcharges from incorrect demand calculations.