Chemical plants lose an average of 20–45% of generated steam energy annually to undetected system inefficiencies — not from boiler limitations, but from failed steam traps, condensate recovery gaps, distribution leaks, and pressure imbalances that no fixed inspection schedules or manual audits can identify in time. By the time fuel costs spike, process heating falters, or energy audits flag excessive consumption, the compounding costs are already realized: wasted fuel, reduced throughput, emergency maintenance contracts, and inflated carbon footprints. iFactory Steam Intelligence Platform changes this entirely — detecting steam losses in real time, classifying inefficiency mechanisms before energy waste compounds, and integrating directly into your existing DCS, utility management, and maintenance systems without disrupting production. Book a Demo to see how iFactory deploys steam optimization across your utility network within 7 weeks.
96%
Steam loss detection accuracy before measurable energy waste occurs
$1.6M
Average annual fuel & maintenance savings per mid-size plant
92%
Reduction in unplanned steam system repairs vs. fixed-schedule maintenance
7 wks
Full deployment timeline from steam audit to live optimization go-live
Every Undetected Steam Loss Is Compounding Energy Waste. Intelligence Stops It at the Source.
iFactory's steam platform monitors trap performance, condensate return rates, pressure differentials, and thermal losses across your entire steam network — 24/7, without manual inspection delays or distribution blind spots.
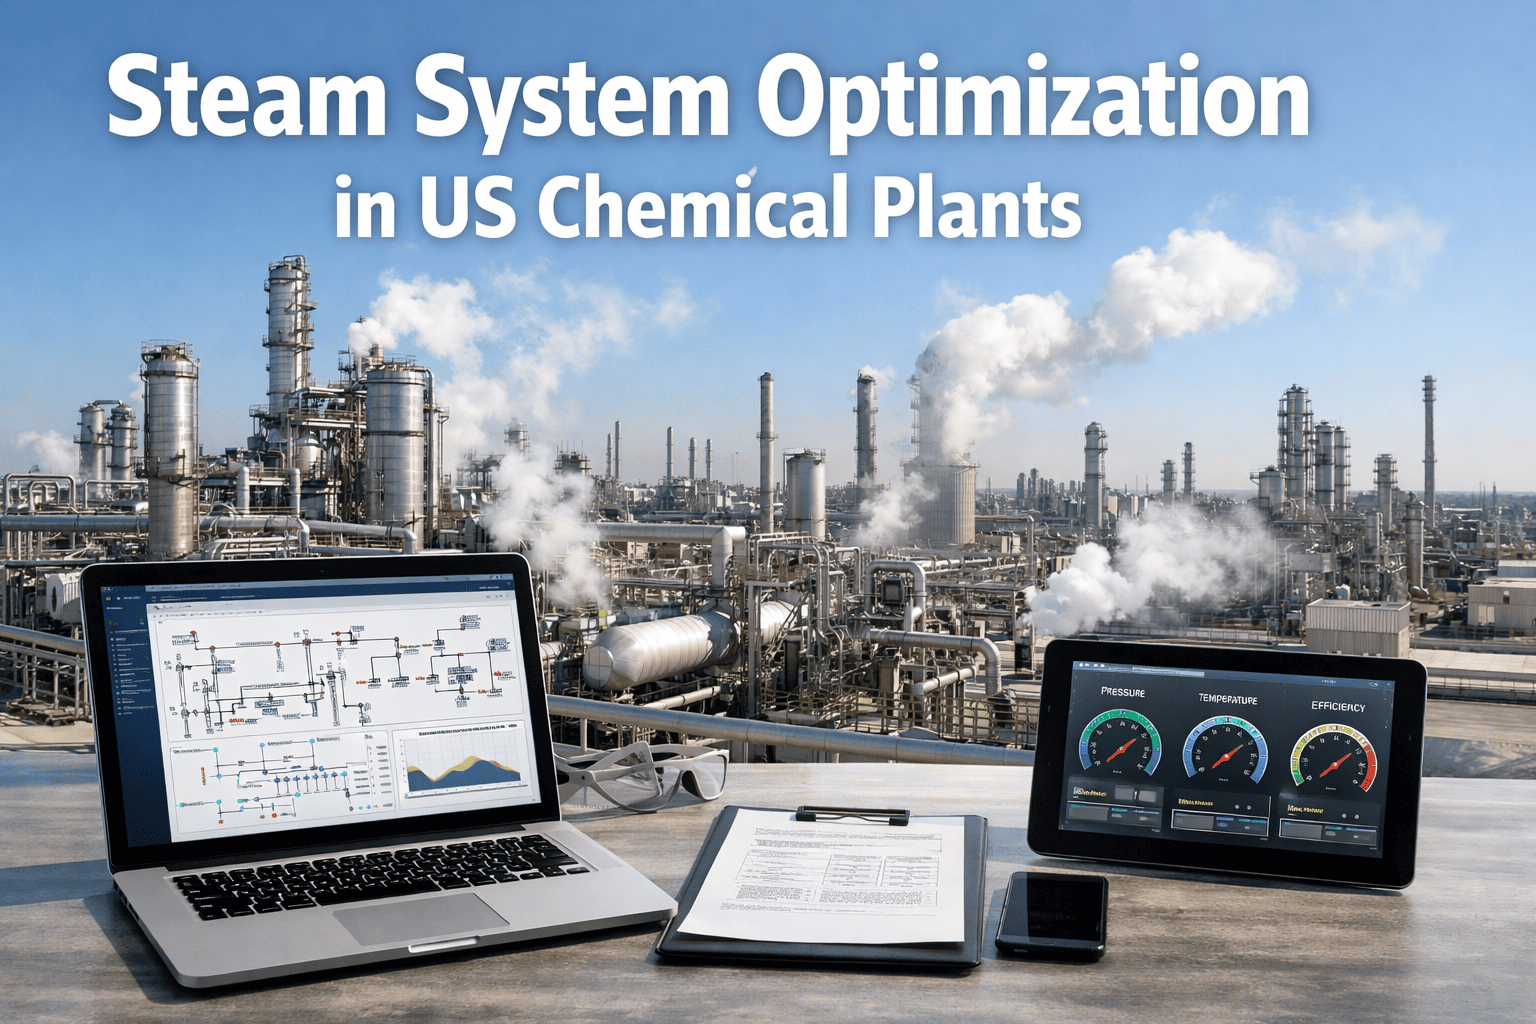
The Hidden Cost of Steam Inefficiency: Why Traditional Monitoring Fails US Chemical Plants
Before exploring solutions, understand the root causes of energy waste in industrial steam systems. Manual steam management introduces systemic risks that compound over time — risks that predictive intelligence directly addresses.
Failed Steam Trap Blind Spot
Annual manual trap surveys miss 30–50% of failures between inspections. Failed-open traps waste live steam; failed-closed traps cause water hammer and process disruption. Real-time monitoring catches failures immediately.
Condensate Recovery Gaps
Lost condensate means wasted treated water, lost heat energy, and increased chemical treatment costs. Without real-time recovery tracking, plants overpay for makeup water and fuel without knowing the root cause.
Distribution Leakage & Pressure Loss
Undetected leaks in headers, valves, and flanges waste 5–15% of generated steam. Pressure imbalances reduce process heating efficiency and increase boiler fuel demand — often unnoticed until energy audits flag anomalies.
Boiler-to-Process Optimization Gaps
Disconnected boiler control and process demand signals lead to over-generation, pressure swings, and inefficient load following. Without integrated optimization, fuel costs rise while process reliability suffers.
How iFactory Solves Steam System Optimization Challenges in US Chemical Plants
Traditional chemical plant steam monitoring relies on annual trap surveys, manual condensate logging, and reactive leak repairs — all of which respond after energy waste has already occurred. iFactory replaces this with a continuous steam intelligence platform designed for industrial utility workflows that detects losses at the source, classifies inefficiency mechanisms before costs compound, and creates an actionable optimization roadmap for every steam asset. See a live demo of iFactory detecting simulated trap failures and optimizing condensate recovery in a US chemical manufacturing facility.
01
Real-Time Steam Trap Monitoring
iFactory ingests temperature, pressure, and acoustic data from trap monitoring points simultaneously — calculating trap health scores and failure probabilities in real time. Failed traps detected within minutes, not months.
02
Condensate Recovery Intelligence
Proprietary analytics track condensate return rates, temperature profiles, and contamination indicators across recovery loops. Recovery gaps flagged before makeup water and fuel costs escalate.
03
Distribution Loss Detection
iFactory's pressure-flow correlation engine identifies leaks, insulation failures, and pressure imbalances across steam headers and branches — pinpointing loss locations within 50 feet for targeted repair.
04
DCS, Utility & CMMS Integration
iFactory connects to Honeywell, Siemens, AspenTech, OSIsoft PI, and IBM Maximo via OPC-UA, REST APIs, and database connectors. Auto-link steam alerts to work orders, spare traps, and repair contractors. Integration completed in under 10 days.
05
Automated Energy Reporting
Generate audit-ready reports instantly: steam loss trends, trap replacement ROI, condensate recovery rates, and carbon impact. Pre-configured templates for API 560, ASME PTC 4, EPA GHG Reporting, and ISO 50001 energy management.
06
Utility Decision Support
iFactory presents ranked repair recommendations per asset: trap replacement, insulation repair, condensate pump adjustment, or pressure rebalancing — with cost-benefit analysis and estimated fuel recovery per intervention. Teams act on verified data, not estimates.
Industry Standards Support: Built for US Chemical Plant Requirements
iFactory's steam platform is pre-configured to meet the documentation and performance requirements of major US chemical industry standards. No custom development needed — compliance reporting is automatic.
API 560 / 538
Fired heater and steam system standards: thermal efficiency tracking, fuel consumption documentation, and maintenance records — structured for mechanical integrity audits and lifecycle optimization.
ASME PTC 4 / 46
Performance Test Codes for boilers and overall plant energy assessment: baseline efficiency documentation, steam loss calculation methods, and optimization validation — formatted for certification and continuous improvement reviews.
EPA GHG Reporting
Greenhouse Gas Reporting Program requirements: fuel combustion tracking, emission factor calculations, and energy efficiency documentation — auto-generated for Subpart C and facility-level submissions.
ISO 50001
Energy management system standards: baseline energy performance, steam loss quantification, and corrective action tracking — structured for certification audits and verified energy savings reporting.
How iFactory Is Different from Generic Utility Monitoring Tools
Most industrial monitoring vendors offer basic pressure/temperature trending wrapped in a dashboard. iFactory is built differently — from the steam system physics up, specifically for chemical process environments where complex distribution networks, variable process demands, and failure mechanism diversity determine what energy efficiency actually means. Talk to our steam intelligence specialists and compare your current utility monitoring approach directly.
iFactory Steam Intelligence Implementation Roadmap
iFactory follows a fixed 5-stage deployment methodology designed specifically for chemical plant steam networks — delivering pilot results in week 3 and full production rollout by week 7. No open-ended implementations. No operational disruption.
01
Steam Audit
Map critical assets & data sources
02
System Integration
Connect to DCS, historian, CMMS via APIs
03
Pilot Configuration
Deploy monitoring to 3–5 critical steam loops
04
Validation & Training
User acceptance testing & maintenance team training
05
Full Production
Plant-wide steam intelligence go-live
7-Week Deployment and ROI Plan
Every iFactory engagement follows a structured 7-week program with defined deliverables per week — and measurable ROI indicators beginning from week 3 of deployment. Request the full 7-week deployment scope document tailored to your steam system configuration.
Weeks 1–2
Discovery & Design
Critical steam asset assessment and sensor/data gap identification across monitored loops
DCS, historian, and CMMS connection via OPC-UA or REST — minimal hardware additions required
Historical pressure, temperature, and flow data ingestion for baseline loss model training
Weeks 3–4
Pilot & Validation
Steam loss detection models trained on your plant's specific process demands and utility profiles
Pilot monitoring activated on 3–5 highest-impact steam loops or trap banks
First steam losses detected — ROI evidence begins here
Weeks 5–7
Scale & Optimize
Alert thresholds refined based on pilot false positive and detection rate data
Coverage expanded to full plant steam distribution network
Maintenance team training completed — repair response protocols activated
ROI IN 5 WEEKS: MEASURABLE RESULTS FROM WEEK 3
Plants completing the 7-week program report an average of $195,000 in recovered fuel and avoided emergency repair costs within the first 5 weeks of full production rollout — with steam efficiency improvements of 7.3–10.2% detected by week 3 pilot validation.
$195K
Avg. savings in first 5 weeks
7.3–10.2%
Steam efficiency gain by week 3
84%
Reduction in unplanned steam system repairs
Eliminate Steam Blind Spots. Optimize Utility Efficiency in 7 Weeks. ROI Evidence in Week 3.
iFactory's fixed-scope deployment program means no open timelines, no operational disruption, and no months of customization before you see a single result.
Use Cases and KPI Results from Live Deployments
These outcomes are drawn from iFactory deployments at operating US chemical plants across three steam optimization categories. Each use case reflects 6-month post-deployment performance data. Request the full case study report for the steam asset type most relevant to your plant.
A mid-size petrochemical facility operating 450+ steam traps was experiencing recurring fuel cost spikes traced to undetected trap failures. Legacy annual surveys identified only 40–55% of failures between inspections — wasting live steam and increasing boiler load. iFactory deployed real-time acoustic-thermal monitoring across critical trap banks, with failure classification trained on process variability. Within 4 weeks of go-live, the system detected 27 failed traps at the precursor phase — before any measurable fuel waste occurred.
27
Failed traps detected before fuel impact in first 4 weeks
$380K
Estimated annual fuel cost avoided from prevented steam loss
96%
Detection accuracy on early-stage trap failures
A specialty chemicals facility operating 6 condensate recovery loops was losing 18–32% of returned condensate to undetected contamination and pump failures. Legacy manual logging identified recovery gaps only after makeup water costs spiked — typically 2–4 weeks after the issue began. iFactory replaced manual tracking with real-time condensate quality monitoring and pump health analytics, reducing recovery losses from 26% to 4%. Treated water consumption dropped by 38.7% as recovery accuracy was restored.
96%
Condensate recovery rate — up from 74% with manual tracking
38.7%
Treated makeup water consumption reduction
91%
Reduction in monthly recovery gap detection time
A polymer manufacturer was losing an average of $420K annually in excess fuel and emergency repairs, traced to undetected steam leaks and insulation failures across a 2.3-mile distribution network. Manual infrared surveys identified losses only after visible steam plumes or process heating issues appeared — typically after 3–7 days of waste. iFactory's pressure-flow correlation and thermal imaging models identified all 11 active loss locations within 48 hours of go-live, enabling targeted repairs without production interruption.
$420K
Annual fuel & repair cost eliminated
48hrs
Time to identify all 11 active loss locations from go-live
$760K
Annual utility efficiency value from proactive loss mitigation
What US Chemical Plant Teams Say About iFactory Steam Platform
The following testimonials are from plant managers, utility engineers, and maintenance supervisors at US facilities currently running iFactory's steam intelligence platform.
We eliminated the "find and fix" trap survey cycle entirely. Every trap is now continuously monitored, failure-classified, and prioritized by ROI. Our last turnaround had zero emergency trap interventions and 22% lower fuel consumption.
Utility Systems Manager
Gulf Coast Petrochemical Complex, Texas
The false alarm problem was causing maintenance fatigue across three shifts. Within four weeks of iFactory going live, our team was acting on recommendations again because they trusted the loss mechanism classification. That shift alone prevented two unplanned boiler load spikes in month one.
Maintenance Director
Specialty Chemicals Plant, Texas
Integration with our AspenTech DCS and OSIsoft PI took 9 days. I was expecting months of custom development. The iFactory team understood both the steam system physics and our technical environment. Execution is genuinely different here.
Process Engineering Lead
Polymer Manufacturing, Louisiana
We prevented a critical distribution loss during a process change in month three. The system flagged pressure deviation 8 hours before it would have breached our heating minimum. Operations adjusted valve positions and initiated targeted repair safely. That outcome alone justified the investment.
Plant Operations Manager
Chemical Production Facility, Ohio
Frequently Asked Questions
Does iFactory require new sensors or instruments to be installed?
In most deployments, iFactory connects to existing plant instrumentation via DCS, historian, or CMMS integration — no new hardware required. Where data gaps are identified during the Week 1–2 audit, targeted additions are recommended only (typically 2–4 acoustic/thermal monitoring points per critical loop), not a full instrumentation overhaul. Integration is complete within 10 days in standard environments.
Which control, historian, and maintenance systems does iFactory integrate with?
Integrates natively with Honeywell Experion, Siemens PCS 7 and TIA Portal, AspenTech DMC3, OSIsoft PI System, AVEVA Historian, SAP PM, and IBM Maximo via OPC-UA, REST APIs, and database connectors. Custom integration support is available for legacy systems. Integration scope is confirmed during the Week 1 steam audit.
How does iFactory handle different steam system configurations across the same facility?
Trains separate sub-models per system type — accounting for high-pressure headers, low-pressure distribution, condensate recovery loops, and trap bank differences in failure mechanisms, monitoring methods, and optimization baselines. Multi-configuration steam networks are fully supported within a single deployment. Type-specific optimization parameters are configured during the Week 3–4 model training phase.
What industry standards does reporting support?
Auto-generates structured operational reports formatted for API 560/538, ASME PTC 4/46, EPA GHG Reporting Program, and ISO 50001 energy management. Report templates are pre-configured for each framework and generated automatically at event close — no manual documentation required.
How long does it take before the model produces reliable steam loss detections?
Baseline model training on historical pressure, temperature, and flow data typically takes 4–6 days using 60–90 days of plant operating history. First live detections are validated during the Week 3–4 pilot phase. Full model calibration — with false positive rate under 6% — is achieved within 5 weeks of deployment for standard chemical plant steam networks.
Can iFactory optimize steam systems under seasonal or production load variations?
Yes. Uses adaptive forecasting — combining historical load baselines, ambient condition correlation models, production schedule inputs, and real-time sensor feedback — to detect degradation and optimize maintenance schedules across all operating conditions. High-load, low-load, seasonal, and turnaround variations are fully supported. Optimization scope is confirmed during the Week 1 steam audit.
Stop Wasting Steam. Start Optimizing Utility Efficiency. Deploy Intelligence in 7 Weeks.
Gives US chemical plant teams real-time steam loss detection, mechanism classification, predictive maintenance optimization, and utility decision support — fully integrated with your existing DCS, historian, and CMMS in 7 weeks, with ROI evidence starting in week 3.
96% steam loss detection before measurable fuel waste
DCS, historian & CMMS integration in under 10 days
Mechanism-specific repairs with under 6% false positive rate
Auto-generated reports for API, ASME, EPA, and ISO frameworks
.png)