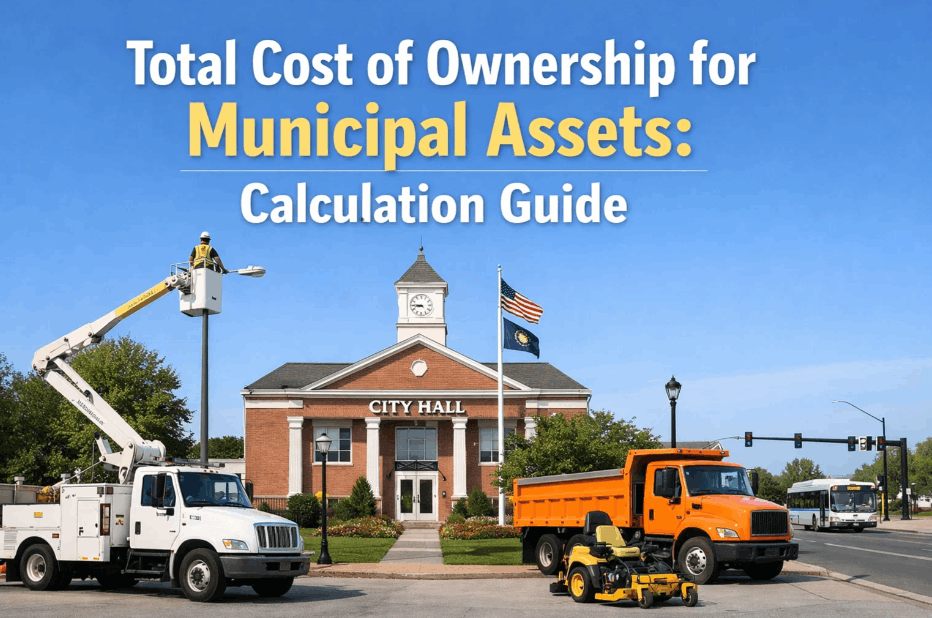
Municipal asset management is evolving from a simple procurement exercise into a lifecycle-long financial strategy. For city managers and public works directors, the initial purchase price of an asset represents only 15-20% of its total economic impact. Understanding the Total Cost of Ownership for government assets—including ongoing energy waste, maintenance cycles, and eventual disposal—is the only way to safeguard municipal budgets from "hidden" long-form fiscal leaks. iFactory’s AI-driven asset intelligence platform automates the calculation of municipal TCO, providing the transparent data needed for defensible investment decisions and sustainable infrastructure growth.
ASSET INTELLIGENCE
·
LIFECYCLE COST ANALYSIS
·
GASB 34 ALIGNMENT
Optimize Your Municipal Asset Lifecycle & TCO Strategy
iFactory tracks acquisition, operational analytics, maintenance overhead, and disposal costs — delivering a 360-degree view of asset ROI for public sector leaders.
The Strategic Value of Municipal TCO Calculation
Traditional public sector budgeting often overemphasizes the "Acquisition" phase because it is the most visible capital outlay. However, the true cost of an asset is buried in its operational years. Without accurate cost analysis for government infrastructure, agencies risk investing in assets that appear "cheap" upfront but consume disproportionate utility and maintenance resources over 10-20 years. Municipal asset cost management requires a unified view of every dollar spent from cradle to grave.
Implementing a TCO calculation for government assets enables smarter procurement, better maintenance scheduling, and data-backed disposal timing. Request a platform demo to see how we vectorize lifecycle data into clear financial signals.
Fiscal Accountability Gaps
Manual tracking often misses "soft costs" like labor for emergency repairs. TCO provides the total transparency required by taxpayers and internal auditors.
Deferred Maintenance Risks
High TCO is often a symptom of deferred maintenance. Our analytics identify the "tipping point" where maintenance costs exceed replacement value.
Procurement Distortions
Low-bid laws can force agencies into high-TCO assets. Data-driven lifecycle cost analysis provides the legal justification for "Best Value" procurement.
Sustainability & Efficiency
Energy-intensive legacy assets drive up TCO. iFactory identifies high-consumption assets that should be prioritized for electrification or modernization.
The Calculation Framework
4 Phases to Defensible Municipal Asset TCO Tracking
iFactory uses an AI-driven framework to move beyond simple spreadsheets into dynamic, real-time TCO calculation for municipal agencies.
01
Asset Inventory & Baseline Acquisition Mapping
Centralizing data on purchase price, installation costs, and vendor support contracts. Establishing the "Day Zero" cost baseline for every asset in the municipal portfolio.
02
Live Operational & Energy Data Ingestion
Using IoT sensors to track real-time electricity, fuel, and water consumption. Every asset is monitored to identify its specific contribution to the municipal utility burden.
Ask about IoT integration.
03
Maintenance & Labor Vectorization
Automatically logging work orders, parts costs, and technician hours. AI analytics categorize these costs into preventive vs. corrective to assess the asset's overall health index.
04
Replacement & Terminal Value Prediction
Predicting the optimal disposal timing based on the intersection of rising maintenance costs and declining trade-in values. Minimizing laggard costs in the final 10% of the lifecycle.
Cost Transparency
Spreadsheet Costing vs. iFactory AI Asset Intelligence
Manual TCO is a "point-in-time" estimate that fails to account for dynamic shifts in energy costs or equipment wear. iFactory provides a live financial pulse. Book a TCO audit today.
Lifecycle Cost Analysis: Manual vs. AI-Driven Automation
Lifecycle Roadmap
The 4 Pillars of TCO: Maximizing Asset Investment Value
Effective lifecycle cost analysis for the public sector requires monitoring four distinct cost buckets. iFactory provides a unified dashboard for each.
1
Acquisition & Initial Commissioning
Includes purchase price, taxes, logistics, commissioning fees, and initial operator training. This is the foundation of the TCO calculation.
Outcome: Transparent CAPEX Baseline
2
Operating & Energy Analytics
Continuous monitoring of utility consumption and operator productivity. AI identifies inefficiencies that drive "Opex inflation" over time.
Outcome: Optimized Recurring Costs
3
Maintenance & Technical Support
Tracking spare parts inventory, outsourced service contracts, and internal labor hours. Differentiating between "value-add" PMs and "reactive" emergency costs.
Outcome: Reduced Emergency Spending
4
Retirement & Disposal Recovery
Evaluating resale value, recycling rebates, and disposal fees. Identifying the exact month where an asset's salvage value justifies a new procurement cycle.
Outcome: Maximized Salvage Value
Economic Impact
ROI of AI-Driven TCO Calculation for Government
By vectorizing hidden assets costs, iFactory allows for the redeployment of capital from "maintenance sinks" into modern infrastructure upgrades. Request a city-wide TCO baseline audit.
Use TCO data to justify purchasing higher-quality, lower-Opex assets. Move from "Lowest Bid" to "Best Lifetime Value" procurement with audit-ready proof.
12–20% Reduction in Total Lifecycle Spend
Isolate assets that are outliers in energy consumption. Correlate age and wear to electrical intensity to prioritize retrofits for the highest impact.
Typical Energy Savings: $15k–$85k per Asset
Direct maintenance crews to assets where intervention will most significantly lower future TCO. Eliminate "wasted PMs" on assets scheduled for imminent disposal.
20% Increase in Labor Efficiency
Strategic Vulnerabilities
The Hidden 'Financial Leaks' in Municipal Portfolios
Calculating TCO is not just about logging bills; it is about uncovering the systemic inefficiencies that drain public funds. iFactory identifies these four high-impact areas using predictive AI.
Infrastructure Inertia
Legacy assets often 'look' functional but operate at 60% mechanical efficiency. We calculate the opportunity cost of continuing to maintain obsolete technology vs. the ROI of a replacement.
Utility Rate Volatility
Energy price spikes can double the Opex of a high-consumption asset in months. Our models stress-test your asset portfolio against future energy price fluctuations to identify risk hotspots.
Maintenance Maturity Gaps
A 'Run-to-Failure' strategy is the fastest way to escalate TCO. We track the 'Preventive-to-Corrective' ratio to ensure your crews are working on the most cost-effective tasks.
End-of-Life Resale Decay
Holding onto a fleet vehicle or pump for one year too long can result in a 40% loss in resale recovery. We pinpoint the exact window to maximize salvage value and lower net TCO.
Decision Matrix
Repair vs. Replace: The Data-Driven Decision Protocol
When a critical municipal asset fails, the decision shouldn't be based on budget availability alone. iFactory uses three machine-verified signals to trigger a replacement cycle.
Economic Decision Matrix: Repair vs. Replace Logic
Public Sector Spotlight
"Before implementing iFactory, our municipal fleet and building TCO was purely anecdotal. We knew certain pump stations were expensive, but we couldn't prove by how much. Now, we have a live 'yield-to-cost' index for every asset. This allowed us to justify a $2.4M electrification upgrade by showing that the higher acquisition cost would be recovered in just 3.8 years through reduced TCO. It’s the highest level of accountability we've ever had."
FAQs
Total Cost of Ownership for Municipal Assets: Common Questions
Does the system handle the complexities of GASB 34 reporting?
Yes. iFactory provides the detailed depreciation, maintenance, and asset condition data required for Government Accounting Standards Board (GASB) Statement No. 34 transparency.
Can we track TCO for a diverse mix of assets (Vessels, HVAC, Fleets)?
Multi-asset support is a core feature. We use specialized algorithms for different asset classes to ensure TCO parameters—like fuel for fleets vs. electricity for HVAC—are modeled correctly.
How does the platform factor in inflation for long-term calculations?
Our financial models include adjustable inflation and escalation factors, allowing for accurate NPV (Net Present Value) calculations over asset lives spanning 15-30 years.
Is it possible to integrate with municipal ERP or financial systems?
Yes. We offer robust API connectors for SAP, Oracle, and municipal-specific ERPs to sync procurement and labor data directly into the TCO intelligence layer.
What is 'Risk-Weighted' TCO for government agencies?
Beyond direct costs, we model 'Risk Costs'—the potential expense of a critical failure. This is essential for public safety assets where downtime has a societal cost.
How quickly can we vectorize legacy asset cost data?
Using AI ingestion for legacy PDFs and work orders, agencies typically have a vectorized TCO baseline for their highest-value assets within 45–60 days.
Does the system help with RFP/Bid evaluation?
Yes. Our TCO simulator lets you plug in bid specs from current vendors to project which asset will be cheapest over 10 years, not just on Day One.
Can this be used for Energy Performance Contracting (EPC) validation?
Yes. The platform provides independent, machine-verified baseline and savings data necessary to validate performance-based energy retrofit contracts.
Master Your Municipal Infrastructure Costs
Transform Passive Asset Management Into Active Lifecycle Intelligence
Stop managing your city’s assets based on acquisition price alone. iFactory provides the real-time TCO intelligence needed to lower operational overhead, justify capital upgrades, and maintain absolute fiscal accountability.
Automated TCO calculation across acquisition and Opex
Real-time IoT integration for precise energy costing
Predictive disposal modeling for maximized salvage
Audit-ready documentation for GASB 34 compliance
Capital spend simulation for "Best Value" procurement
Specialized algorithms for diverse municipal asset classes