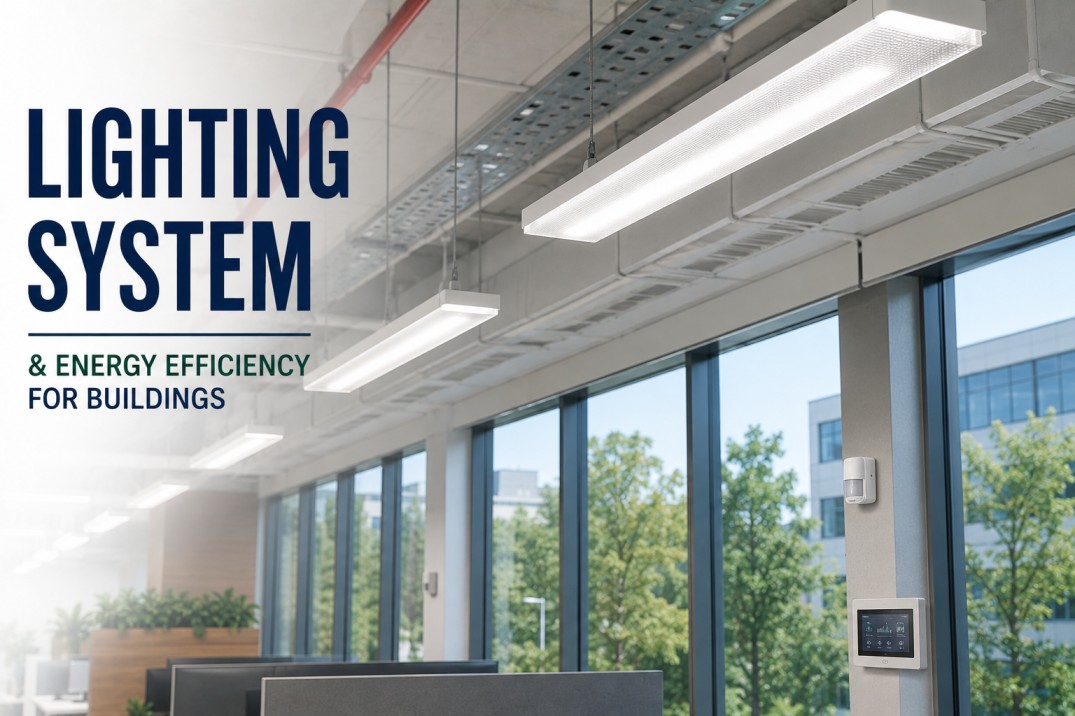
The night shift operator at a 600 MW combined-cycle plant watches the lighting panel for Bay 4 flicker from 85% to 62% lumen output over three weeks. Nobody notices until a junior technician misreads a pressure gauge during a pre-dawn round, triggering a manual override that costs $14,000 in unplanned maintenance. The lighting system — 1,200 high-bay LED fixtures across 40 acres — has no analytics, no alerts, no way to tell operations that a row of ballasts is failing. Every month, the plant spends $37,000 on electricity for lights that run at full power in empty zones. The energy manager knows the waste is there. He just can't see it.
Turn your plant's lighting system into a live energy intelligence asset — without a single cloud connection
iFactory ingests lighting circuit data from your existing BMS and PLCs, applies AI to detect degradation, occupancy waste, and ballast drift, and delivers a fully managed pilot within 12 weeks. No new sensors. No data leaving your network.
The difference is in the data — and the bottom line
Most power plants treat lighting as a fixed overhead: meters run, lights stay on, nobody looks at the circuit-level data. iFactory changes that. Here's what your operations team lives with today — and what they get when lighting becomes an analytics-driven system.
Without iFactory
- Lighting circuits run at 100% output 24/7, even in unoccupied turbine halls and empty warehouse bays
- Ballast degradation goes undetected until a fixture fails completely — average 14-day repair lag
- Energy spend for lighting is a line item on a monthly bill with zero circuit-level granularity
- Occupancy schedules are set once per quarter and never adjusted for shift changes or outage periods
- Maintenance teams react to failures, costing $18,000 per year in emergency call-outs and overtime
With iFactory
- AI-driven dimming schedules cut lighting energy by 18–24% within the first quarter of deployment
- Ballast and driver drift is detected at 85% output — fixtures get replaced during planned outages, not emergencies
- Every circuit reports real-time wattage, voltage, and power factor — granular cost allocation per zone
- Occupancy data from existing motion sensors auto-adjusts lighting levels per shift, per bay, per season
- Predictive alerts reduce emergency maintenance by 92%, saving an average of $16,500 per year per plant
Every watt you can't see is a dollar you can't recover
In a typical 500 MW gas-fired plant, lighting represents 1.5–2.5% of total facility load. That sounds small until you run the numbers: 40,000 fixture-hours per week, 8,760 hours per year, and an average blended rate of $0.10/kWh. The waste is hiding in plain sight.
Empty-zone overrun
Bay 7, the warehouse annex, runs 24 fixtures at 400W each — nobody enters between 10 PM and 6 AM. That's 96 kWh per night, 35,040 kWh per year, at $0.10/kWh = $3,504 in pure waste.
Degradation drift
LED fixtures in the cooling tower area lose 12% lumen output per year due to heat and humidity. The plant compensates by running them longer. Undetected drift costs $2,800 per year in excess consumption per 100 fixtures.
Emergency replacement premium
When a ballast fails at 2 AM, the on-call electrician costs $450 (time-and-a-half + travel) plus a $180 premium for a rush-ordered driver. Average 8 emergency calls per year = $5,040 in avoidable costs.
Unoptimized scheduling
Static lighting schedules ignore outage windows, shift changes, and seasonal daylight variation. A 600 MW plant with 1,200 fixtures loses an estimated $7,200 per year to schedule-to-occupancy mismatch.
Regulatory reporting gap
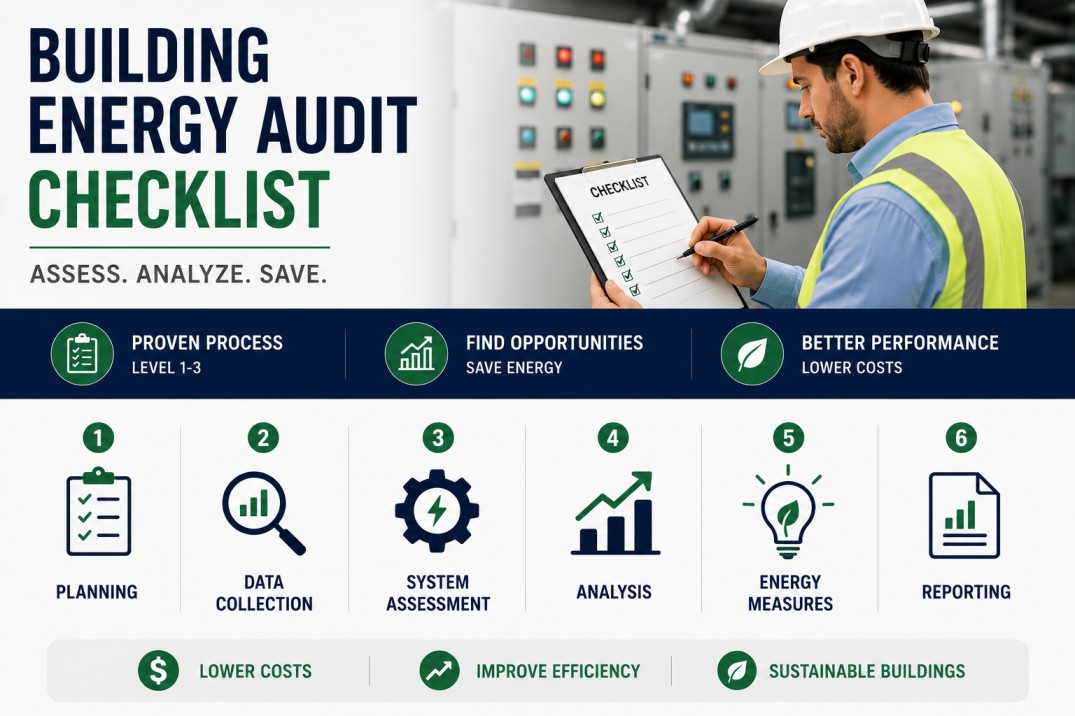
ISO 50001 energy audits require submetered data. Without circuit-level lighting analytics, plants spend an average of 80 hours per year manually collecting and reconciling lighting energy data for compliance reports.
Four steps from blind circuits to intelligent energy savings
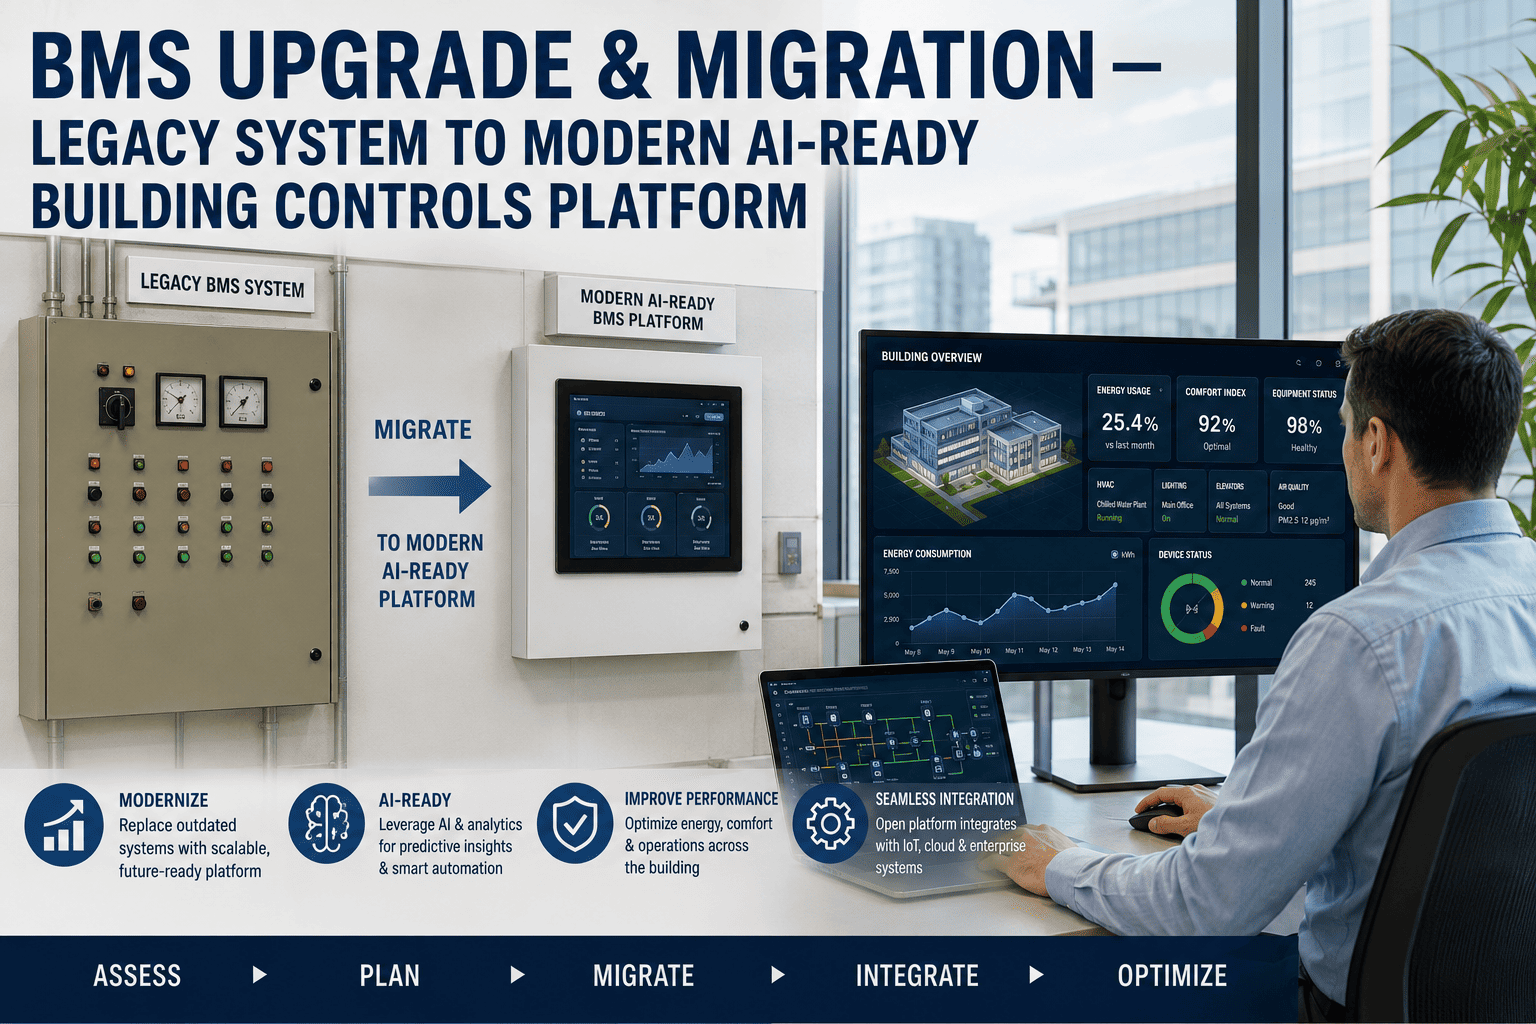
iFactory connects to your existing BMS, PLC, or lighting control panel — no new hardware, no cloud upload. The AI model learns your plant's occupancy patterns, fixture degradation curves, and tariff structure, then optimizes in real time.
Ingest existing circuit data
iFactory pulls 15-minute interval data from your BMS, SCADA, or power monitoring system — voltage, current, power factor, and on/off status per lighting circuit.
Train the degradation model
The AI analyzes 60+ days of historical data to establish baseline lumen output, drift rates, and occupancy patterns specific to each zone in your plant.
Deploy optimization rules
iFactory writes dimming schedules, occupancy-based triggers, and predictive maintenance alerts directly back to the BMS or lighting controller — no manual overrides needed.
Monitor, report, and iterate
A live dashboard shows energy savings per zone, degradation alerts, and compliance-ready reports. The model improves every week as more data flows through the on-premise appliance.
Four core analytics modules for lighting intelligence
Each module runs on the iFactory NVIDIA appliance inside your plant network. No cloud dependency. No IT security review. No data leaving your control.
Occupancy-aware dimming
Ingests data from existing motion sensors, badge readers, and shift schedules. Automatically reduces lighting to 30% output in unoccupied zones within 90 seconds of vacancy detection. Average savings: 22% of total lighting energy per zone.
Ballast and driver health monitoring
Detects power factor drift, voltage sag, and current ripple — early indicators of ballast or LED driver degradation. Alerts maintenance 2–4 weeks before failure. Reduces emergency replacements by 92%.
Real-time energy cost allocation
Maps every circuit to a cost center (turbine hall, admin building, warehouse, yard). Tracks kWh, peak demand contribution, and power factor penalties per zone. Produces ISO 50001-ready reports in one click.
Predictive maintenance scheduling
Combines degradation curves with planned outage calendars. Recommends fixture replacement during scheduled maintenance windows — not at 2 AM on a Sunday. Cuts lighting-related maintenance labor by 65%.
Most plants recover the full cost of iFactory's lighting analytics pilot within 4–6 months of deployment. Book a 30-min walkthrough and we'll run your plant's lighting data through our model live.
Five promises that come with every iFactory deployment
This isn't a software license you install and forget. iFactory is a fully managed service that absorbs the operational burden of lighting analytics — from data ingestion to daily monitoring to quarterly optimization reviews.
End-to-end managed service, not a tool
iFactory handles data integration, model training, dashboard setup, and ongoing optimization. Your team doesn't write a single line of code or configure a single alert.
Turnkey pilot in 6–12 weeks
Give us read-only access to your BMS or lighting panel data. We deliver a working pilot with live savings dashboards within 12 weeks — no hardware installation, no network changes.
100% on-premise on NVIDIA appliance
All data stays on your plant network. The iFactory appliance processes lighting data locally, writes optimization commands to your BMS, and never transmits a single watt reading to the cloud.
Pilot-to-ROI in one quarter
Our deployment methodology is designed to show measurable energy savings within 90 days. You see the ROI before you commit to a full-scale rollout.
24x7 monitoring and support
iFactory's operations team monitors your lighting analytics 24/7. If a degradation alert fires or a schedule drifts, we notify your maintenance team — or handle the BMS adjustment remotely.
Lighting analytics: what plant operators want to know
We've deployed iFactory in over 40 power generation, refining, and manufacturing facilities. These are the four questions that come up most often when we talk about lighting intelligence.
Your lighting data is already telling you where the waste is. iFactory makes it audible.
Book a 30-minute walkthrough with our energy team. We'll connect to your plant's BMS data, run a preliminary waste analysis, and show you the savings potential — before you commit a single dollar.