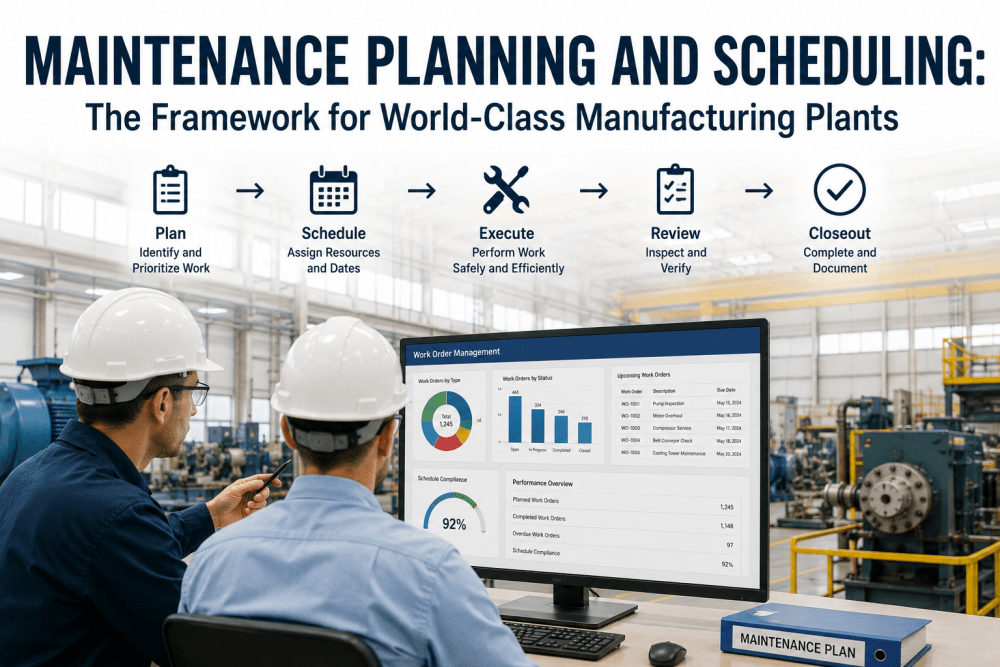
Analytics Planning and Scheduling: The Framework for World-Class Manufacturing Plants
By Daniel Brooks on May 25, 2026
Maintenance planning and scheduling sits at the operational core of every world-class manufacturing plant — and it is the single most under-leveraged lever in plants that consistently struggle with reactive maintenance, runaway backlogs, and missed production targets. The data tells the story plainly: plants operating in a reactive maintenance mode spend roughly three to five times more per maintenance hour than plants with mature planning and scheduling functions, while delivering 30 to 50% less equipment availability. The difference is not effort, headcount, or technology budget — it is the discipline of structured work identification, job planning, weekly scheduling, schedule compliance measurement, and continuous backlog management. Modern analytics-driven planning and scheduling, supported by a properly configured CMMS and AI-augmented decision tools, transforms maintenance from a cost center reacting to failures into a planned operational function that protects asset health, production schedules and labor productivity simultaneously. Facilities running
iFactory's Work Order Management platform
with integrated planning and scheduling analytics report 42% improvement in wrench-time productivity, 68% schedule compliance within six months and an average reduction of 38% in maintenance overtime spend.
Maintenance Management · Work Order Analytics
Analytics Planning and Scheduling: The Framework for World-Class Manufacturing Plants
A structured framework for maintenance planning, weekly scheduling, schedule compliance, and backlog management — engineered for plants that need to convert reactive maintenance into planned execution.
Why Most Plants Stall at Reactive Maintenance — and What World-Class Plants Do Differently
Industry benchmarks across U.S. manufacturing consistently show that fewer than one in five plants achieve a mature planning and scheduling function — and the operational gap between those that do and those that do not is wider than any other single maintenance practice. The differentiators are not the existence of a CMMS, the number of preventive maintenance tasks, or the size of the maintenance team. The differentiators are the four disciplines below, applied consistently week over week.
Structured Work Identification
World-class plants run a disciplined intake funnel — every maintenance need enters as a formal request, is screened against criticality and resource criteria, and either becomes a planned work order or is rejected with documented reasoning. Reactive plants accept verbal walk-up requests, bypass the planner, and execute without job plans — guaranteeing rework, delays, and zero learning across the team.
Discipline: One Intake Funnel, No Bypasses
Detailed Job Planning Before Scheduling
A work order is not ready to schedule until the planner has confirmed scope, parts availability, required crafts, estimated hours, safety requirements, drawings, and procedures. Plants with mature job planning operate at 50 to 65% wrench time. Plants that schedule jobs the planner has not detailed operate at 25 to 35% wrench time — the workforce is on the clock but not turning wrenches.
Discipline: Plan First, Schedule Second
Frozen Weekly Schedule with Compliance Tracking
The weekly schedule is locked by Thursday for the following week, with capacity loaded to 80 to 85% to leave room for emergent work. Schedule compliance — the percentage of scheduled jobs completed during their planned week — is measured weekly and reported. Plants that do not freeze schedules and do not measure compliance drift back into reactive mode within one to two quarters every time.
Discipline: Freeze, Measure, Improve
Backlog Management as a Continuous Function
A healthy backlog runs at three to six weeks of ready-to-schedule work, segmented by craft and priority. Backlogs above six weeks signal capacity shortfalls or planning bottlenecks. Backlogs below two weeks mean the team is firefighting rather than working on prioritized risk reduction. World-class plants review backlog age, composition, and aging weekly and treat backlog as a leading indicator of plant health.
Discipline: Backlog Is a Living Number
The Work Order Lifecycle
Five Stages from Work Identification to Closed Work Order
A mature work order lifecycle has five sequential stages, each with defined entry and exit criteria. The role of analytics-driven planning and scheduling is to make every stage measurable — so that bottlenecks, escapes, and quality losses are visible in real time rather than discovered at year-end through anecdote.
Action: Load capacity to 80–85%. Hold the freeze. Track compliance every Monday morning.
Stage 5
Close & Learn
Owner: Technician / Planner
InputsActual hours, parts used, findings, failure codes
OutputClosed work order with searchable history
Target CycleClosed within 5 business days of completion
KPIClose-out quality, repeat job rate
Action: Failure codes and findings feed the next planning cycle. Skip this and the loop never closes.
The Weekly Operating Rhythm
How iFactory Automates the Planning and Scheduling Cycle
World-class plants run on a fixed weekly cadence — the same meetings, the same artifacts, the same KPIs, week after week. The role of the iFactory Work Order Management platform is to remove the administrative burden from that cadence so that planners and schedulers focus on planning and scheduling rather than data entry. Book a demo to walk through the full cycle on your data.
01
Monday — Schedule Compliance Review and Plan-the-Plan
The week opens with a 30-minute schedule compliance review against last week's frozen schedule. iFactory generates the compliance report automatically — completed on schedule, completed late, completed early, not completed, and reason codes for each variance. The planner uses this data to plan the planning workload for the coming week, focusing first on jobs that fell off last week's schedule and need re-planning.
Compliance percentage trended week-over-week with variance reason codes
02
Tuesday–Wednesday — Job Planning and Backlog Conditioning
The planner works the planning queue, transforming approved work orders into ready-to-schedule jobs. iFactory auto-populates parts kitting lists from BOM history, suggests craft mix from similar historical jobs, flags any work order missing required permits or procedures, and confirms parts availability against stockroom inventory in real time. Job plans accumulate into the ready backlog, which iFactory ages and segments by craft and priority on a live dashboard.
Ready backlog visible by craft, priority, and aging — no spreadsheets
03
Thursday — Schedule Build and Production Coordination
The scheduler builds next week's schedule from the ready backlog, loading craft capacity to the 80 to 85% target. iFactory's scheduling assistant proposes an optimized sequence that respects production windows, parts availability, craft dependencies, and asset criticality. The production coordination meeting reviews the proposed schedule with operations — any conflicts are resolved before the schedule is frozen by end of day Thursday.
Frozen schedule published to technicians by Thursday 5 PM
04
Daily Execution — Mobile Work Orders and Real-Time Status
Technicians receive their daily work assignments on mobile devices, with full job plans, drawings, parts lists, safety requirements, and procedures attached. Time and parts capture happens at the job site, not at end of shift. iFactory tracks job status in real time — supervisors see progress against schedule throughout the day and can rebalance crews when emergent work disrupts the plan, rather than discovering schedule slip the next morning.
Real-time schedule progress — no end-of-shift surprises
05
Friday — Close-Out, Failure Coding, and Feedback to the Planner
Completed work orders are closed with actual hours, parts used, failure codes, and findings. iFactory enforces close-out completeness — work orders missing required failure codes or actual hours are flagged before being marked complete. The planner reviews each closed job against the original plan, capturing planning variance data that feeds back into more accurate job plans on the next iteration of similar work.
Closed-loop learning — planning accuracy improves quarter over quarter
For Plant Managers and Maintenance Leaders
See Your Planning and Scheduling Maturity Scored on Your Own Data
iFactory's team runs a structured assessment using a sample of your recent work order history — scoring your current planning accuracy, schedule compliance, backlog health, and wrench time. The output is a maturity gap analysis with the three highest-ROI interventions specific to your plant.
Reactive vs. Planned Maintenance: The Operating Reality
The differences between reactive maintenance plants and planned maintenance plants are measurable across every dimension that matters to plant economics. The table below summarizes the operating reality across U.S. manufacturing benchmarks.
Maintenance Operating Mode Comparison
Metric
Reactive Plant
Improving Plant
World-Class Plant (iFactory-Enabled)
Planned Work Percentage
Below 35%
50–65%
Above 80%
Schedule Compliance
Not measured or below 40%
50–65%
75–90%
Wrench Time
25–35%
40–50%
55–65%
Average Cost per Maintenance Hour
$260–$420 (fully loaded reactive)
$150–$220
$85–$120 (fully loaded planned)
Backlog Health (weeks of work)
Unknown or above 12 weeks aged
6–10 weeks, partial aging visibility
3–6 weeks, fully aged and segmented
Overtime as % of Maintenance Hours
18–30%
10–16%
5–9%
First-Time-Fix Rate
55–70%
75–82%
Above 88%
Equipment Availability
78–86%
88–92%
94–98%
Measured Outcomes Across iFactory Deployments
The results below reflect verified outcomes from U.S. manufacturing plants that adopted iFactory Work Order Management with structured planning and scheduling within the first 12 months of full deployment.
42%
Improvement in wrench-time productivity within 6 months
68%
Schedule compliance achieved within 6 months of go-live
38%
Reduction in maintenance overtime spend
55%
Reduction in emergency work order volume year-over-year
Book a demo to see how iFactory's planning and scheduling analytics measure these same KPIs on your current work order data — most plants identify their biggest leakage point within the first review session.
Expert Perspective
After implementing planning and scheduling functions across more than 80 U.S. manufacturing plants over 18 years — pulp and paper, food and beverage, automotive parts, chemicals, and heavy industrial — the implementation patterns that produce sustainable results follow a clear set of priorities. Two non-negotiables separate plants that hit world-class metrics in 12 months from plants that spend three years in implementation purgatory.
Separate the planner role from the supervisor role — and protect the planner from emergent work. The single most common failure mode in planning and scheduling rollouts is asking the maintenance supervisor to also plan. The supervisor's day is consumed by today's emergent work, and planning — which requires three to ten days of look-ahead thinking — never gets done. The planner must be a dedicated role, accountable to the maintenance manager rather than the supervisor, and the planner must not be pulled into today's firefighting. Plants that respect this separation hit 60% planned work within six months; plants that do not still be at 35% planned work three years later.
Measure schedule compliance from week one — even when the number is embarrassing. The instinct to delay compliance measurement until the team is ready to look good is the instinct that prevents the team from ever looking good. Schedule compliance must be reported weekly from the first frozen schedule, with the actual number — 22%, 35%, whatever it is. The measurement is what drives the behavior change. Plants that report compliance from week one move from 30% to 65% within six months. Plants that delay measurement until they think they are ready to be measured never get above 45%.
Senior Reliability and Maintenance Strategy Consultant18 Years, 80+ Planning & Scheduling Implementations — CMRP Certified
Work Order Management · iFactory AI Platform
From Reactive to World-Class — Planning and Scheduling Analytics That Move the Numbers
iFactory's Work Order Management platform delivers the planning and scheduling analytics that turn a reactive maintenance organization into a world-class planned operation — with measurable improvements in schedule compliance, wrench time, planning accuracy, and backlog health from the first quarter of deployment.
Automated planning workflows with parts kitting and craft suggestion
Frozen weekly scheduling with live compliance tracking
Backlog aging, segmentation, and health analytics by craft
Mobile work execution with real-time time and parts capture
Maintenance planning answers the question of what work needs to be done, how it should be done, what resources it requires, and what conditions must be met before it can be executed. The planner is concerned with scope, parts, crafts, drawings, procedures, safety requirements, and estimated hours — building a fully ready work order before any scheduling occurs. Maintenance scheduling answers the question of when the planned work will be executed and by whom — building a weekly schedule from the ready backlog against craft capacity, production windows, and asset criticality. Planning is a job-level discipline; scheduling is a portfolio-level discipline. The two functions are sequential and complementary, and most failures in maintenance organizations come from blurring the two roles or skipping the planning step entirely.
Schedule compliance is the percentage of work orders on the frozen weekly schedule that are completed during that week, calculated as completed jobs divided by scheduled jobs. The denominator is fixed at the moment the schedule is frozen — adding jobs mid-week does not change the compliance calculation. A plant new to formal scheduling typically starts at 30 to 45% compliance and improves to 60 to 70% within six months of disciplined weekly cadence. World-class plants run sustained compliance of 80 to 90%. Compliance above 95% usually indicates the schedule is being padded with easy work or capacity is loaded too low — leaving productivity on the table. Compliance below 50% indicates either the schedule freeze is not being respected or emergent work is consuming the team. Both extremes are signals for management attention, not just measurement.
A healthy ready-to-schedule backlog runs at three to six weeks of work for each craft, with the bulk of jobs aged under 60 days. Backlogs below two weeks indicate the planning function is under-supplying the scheduling function — the team is forced to schedule jobs that have not been fully planned, degrading wrench time and first-time-fix rate. Backlogs above six weeks indicate either a capacity shortfall the plant needs to address through contractors or hiring, or a planning bottleneck where work orders are being approved faster than the planner can ready them. Aging is as important as size — a backlog with significant aged work above 180 days usually contains low-priority items that should be archived or canceled rather than continually re-evaluated. iFactory's backlog dashboard tracks both size and aging by craft and priority, surfacing aging clusters that need management decisions.
With disciplined leadership, a dedicated planner role, and a properly configured CMMS with planning and scheduling analytics, a plant can move from reactive to a 60% planned, 65% schedule-compliant operating state within six to nine months. World-class targets of 80% planned work and 85% compliance typically take 18 to 24 months because they require behavioral change across operations, maintenance, stores, and engineering simultaneously. The most common mistakes that extend the timeline are not assigning a dedicated planner, allowing supervisors to bypass the planning function for jobs they consider urgent, failing to freeze the weekly schedule against emergent pressure, and delaying compliance measurement until the team is ready to look good. iFactory's deployment methodology includes a structured 90-day stabilization phase focused on building the weekly cadence and compliance measurement habit before optimization work begins.
AI analytics adds four capabilities that traditional CMMS-based planning and scheduling cannot deliver. First, planning accuracy improves through historical pattern recognition — iFactory suggests job hours, parts, and craft mix based on previous executions of similar work, rather than the planner estimating from memory. Second, scheduling optimization considers more variables simultaneously than a human scheduler can — production windows, parts availability, craft dependencies, asset criticality, and emergent work probability are balanced in seconds rather than hours. Third, predictive integration feeds the planning queue directly from condition monitoring and PdM alerts, so condition-based work enters the planning funnel automatically with severity scoring rather than waiting for a manual request. Fourth, compliance variance analysis identifies systemic causes of schedule slip — same crew, same job type, same time of day — that human review would miss in the noise. iFactory's analytics layer is what converts a CMMS from a record-keeping tool into a planning and scheduling decision engine.
Conclusion
Analytics-driven planning and scheduling is the operational discipline that separates plants delivering world-class results from plants stuck in reactive maintenance regardless of headcount, budget, or technology investment. The framework is not complex — structured work identification, detailed job planning before scheduling, a frozen weekly schedule with compliance measurement, and continuous backlog management. The challenge is consistency: the same disciplines applied week over week, supported by analytics that make every stage of the work order lifecycle measurable in real time.
iFactory's Work Order Management platform delivers the analytics infrastructure that makes this consistency achievable — automated planning workflows, frozen weekly scheduling with live compliance tracking, backlog health dashboards, and closed-loop learning from every completed work order. The plants that adopt this framework see schedule compliance double, wrench time improve by 40% or more, and overtime drop by a third within the first year. Book a demo to see what the framework looks like applied to your specific plant.