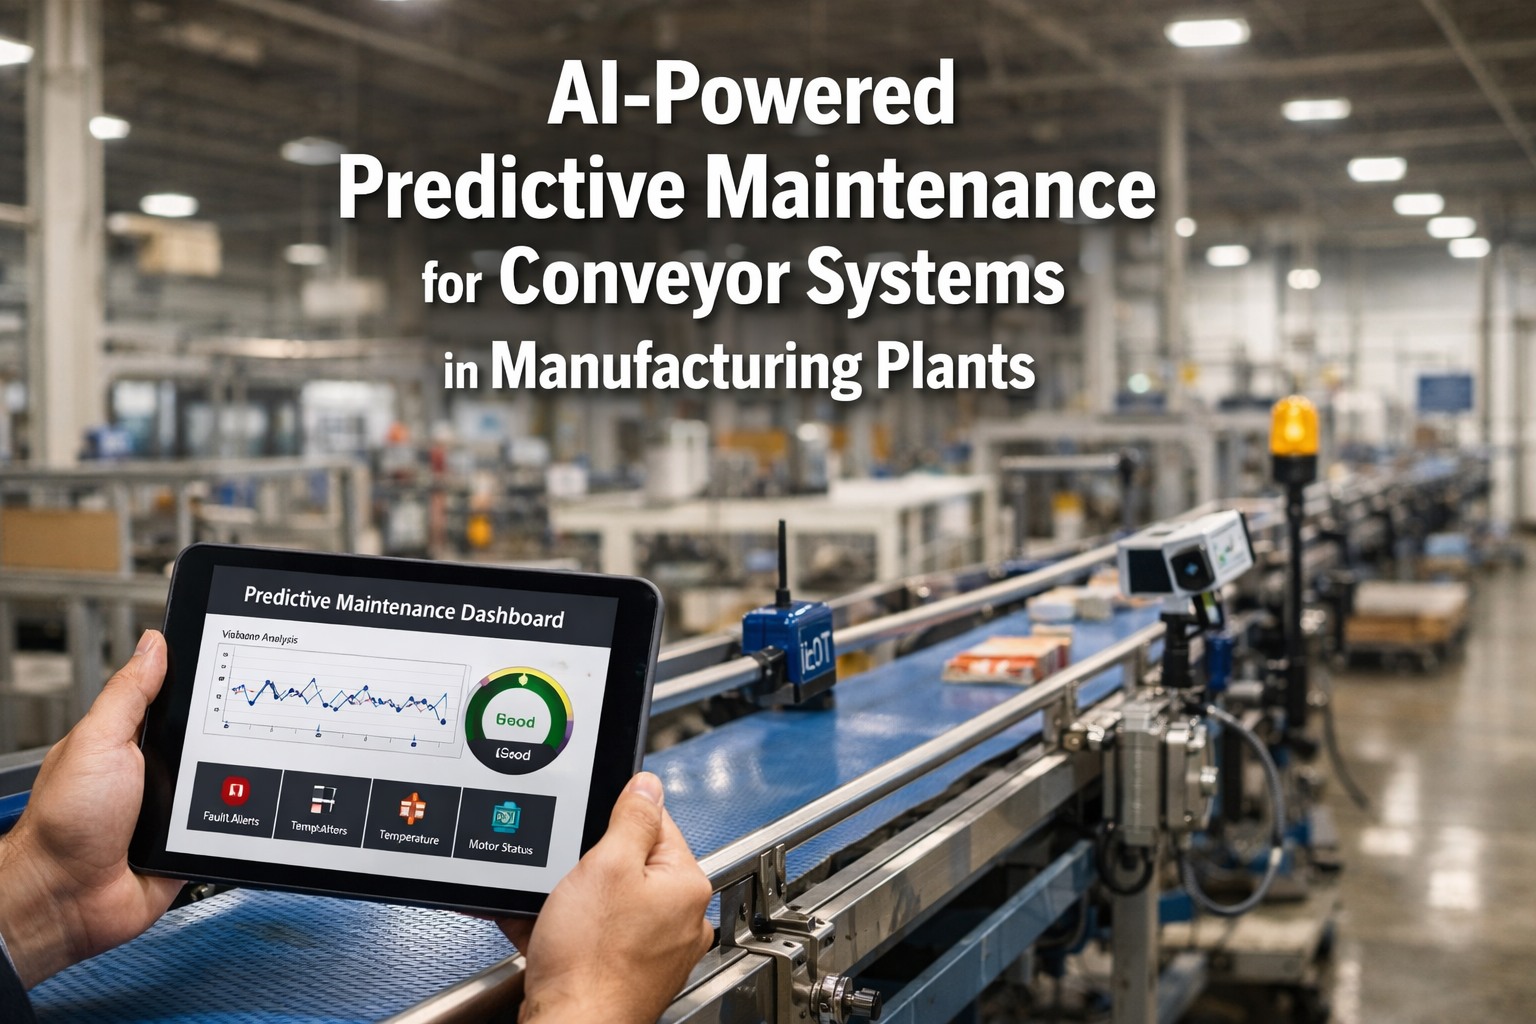
Factory Floor Equipment Management: Maintenance and Optimization
By oxmaint on March 10, 2026
Every manufacturing plant depends on its machines. When a CNC spindle jams, a conveyor belt misaligns, or a hydraulic press loses pressure, production does not just slow down—it stops. The financial damage starts immediately and compounds with every idle minute. Across industries, manufacturers lose between 5% and 20% of productive capacity to equipment-related failures that could have been prevented. This guide breaks down the strategies, technologies, and frameworks that keep factory floor equipment running at peak performance—turning maintenance from an unpredictable cost into a measurable competitive advantage. Connect with iFactory support to explore how your plant can start reducing equipment failures today.
How Unplanned Equipment Downtime Destroys Manufacturing Margins
Downtime is not just a production problem—it is a financial crisis that compounds in ways most plant managers underestimate. When a critical machine goes down without warning, the direct repair cost is often the smallest part of the bill. Lost throughput, idle labor, spoiled materials, rushed overtime, missed shipments, and penalty clauses pile up within hours.
$260K
Average hourly cost of unplanned downtime across manufacturing in 2025
82%
Of manufacturers have experienced at least one unplanned downtime event in the past three years
34%
Of all OEE losses come from unplanned downtime alone—the single largest efficiency drain
$4-$10
Saved for every $1 invested in preventive maintenance—proven ROI across plant sizes
The cascade effect makes downtime exponentially expensive. First-run quality after restart drops, requiring rework. Just-in-time delivery commitments trigger SLA penalties. Maintenance teams scramble at overtime rates. And the root cause often traces back to a failure that proper monitoring would have caught weeks earlier. Speak with our equipment management specialists to identify your plant's biggest downtime risk factors.
Stop losing revenue to preventable breakdowns. See how iFactory helps plants cut unplanned downtime by centralizing equipment health data and automating maintenance workflows.
Preventive vs. Predictive vs. Condition-Based Maintenance: Which Strategy Fits Your Equipment?
No single maintenance strategy works for every machine. The smartest plants use a blended approach—matching the right strategy to each asset based on its criticality, failure behavior, and the cost of downtime. Understanding the strengths and trade-offs of each approach is the first step toward optimizing your maintenance spend.
Time-Based
Preventive Maintenance
Maintenance performed at fixed calendar intervals or usage milestones—regardless of actual equipment condition. Follows OEM schedules and internal SOPs.
Maintenance triggered by real-time sensor readings—vibration, temperature, oil quality, or power draw—when values exceed established thresholds.
Best For
Rotating machinery, hydraulic systems, electric motors, gearboxes—assets where degradation produces measurable physical signals
Maintains based on actual needRequires sensor infrastructure
AI-Powered
Predictive Maintenance
AI and machine learning models analyze sensor data, historical failures, and operational context to forecast exactly when a component will fail—weeks in advance.
Best For
High-value CNC machines, robotic arms, critical production bottlenecks—assets where a single failure halts the entire line
Prevents failures before symptoms appearHighest upfront investment
Plants that blend all three strategies typically achieve 25-30% lower total maintenance costs while simultaneously increasing equipment availability. The key is matching strategy to asset criticality—predictive for your most critical machines, preventive for supporting equipment, and run-to-failure only for easily replaceable, non-critical items.
How to Build an Equipment Criticality Matrix for Your Plant
Not all machines are equal. A criticality matrix ranks every asset on your factory floor by the business impact of its failure, guiding where you invest in advanced monitoring versus basic scheduled maintenance. Without this framework, maintenance budgets get spread evenly—which means critical machines are under-protected and non-critical machines are over-maintained.
Equipment Criticality Assessment Framework
Assessment Factor
Score 1 (Low)
Score 3 (Medium)
Score 5 (High)
Production Impact
Failure affects one workstation only
Failure slows an entire production line
Failure halts all plant output
Safety Risk
No personnel exposure during failure
Moderate risk requiring area evacuation
Immediate danger to operators or environment
Repair Complexity
In-house team can fix within 1 shift
Requires specialist skills or OEM parts (2-5 days)
Extended downtime, overseas parts, or custom fabrication
Redundancy
Backup equipment available on-site
Partial backup or manual workaround exists
No redundancy—single point of failure
Downstream Effect
No customer or delivery impact
Delays to some orders or internal deadlines
Direct SLA breaches, penalty clauses, customer loss
Score each asset across all five factors. Totals of 20-25 = Critical (predictive maintenance). 12-19 = High (condition-based + preventive). Below 12 = Standard (preventive or run-to-failure).
Build Your Equipment Criticality Matrix with Expert Guidance
iFactory helps manufacturing teams assess, rank, and protect every machine on the floor—from CNC centers to conveyor drives. Automate maintenance scheduling, track real-time equipment health, and focus resources where they deliver the highest return.
Real-Time Machine Health Monitoring: Sensors, Data, and Early Warnings
The difference between a $500 bearing replacement and a $200,000 production shutdown often comes down to one thing—early detection. Modern monitoring technologies catch degradation signals weeks before a failure would be visible to the human eye or ear. Here is the technology stack that high-performing plants deploy across their factory floor equipment.
Vibration Analysis
Detects imbalance, misalignment, bearing wear, and looseness in rotating equipment. Tri-axial accelerometers capture data at frequencies up to 20kHz, revealing faults invisible to touch or sound. Most effective on motors, pumps, fans, gearboxes, and spindles.
Infrared Thermography
Thermal cameras and fixed sensors identify hot spots in electrical panels, overheating bearings, insulation breakdown, and steam leaks. Temperature trend analysis reveals degradation patterns 3-6 weeks before component failure in most industrial applications.
Oil and Fluid Analysis
Particle counting, spectrometric analysis, and viscosity testing of lubricants reveal internal wear, contamination, and fluid degradation. Results correlate directly with remaining useful life for gearboxes, hydraulic systems, and large diesel engines.
Ultrasonic Leak Detection
High-frequency acoustic sensors locate compressed air leaks, steam trap failures, and electrical arcing in switchgear. A single plant-wide compressed air leak survey typically recovers $10,000-$50,000 in annual wasted energy costs.
Motor Current Signature Analysis
Monitors electrical current draw patterns to detect winding degradation, rotor bar defects, and mechanical loading anomalies without any physical contact with the motor. Ideal for hard-to-access or enclosed drive systems.
AI Pattern Recognition
Machine learning models trained on your equipment's unique operating data detect subtle multi-variable drift that no single sensor threshold would catch. Models adapt automatically to production changes, seasonal variation, and normal equipment aging.
See real-time machine health dashboards in action. Walk through live condition monitoring alerts and predictive failure warnings configured for your equipment types.
Overall Equipment Effectiveness is the gold standard for measuring how well your factory floor equipment performs. Most manufacturing plants operate between 60% and 75% OEE—meaning up to 40% of capacity is being lost to downtime, slow cycles, and quality defects. Moving from 60% to 85% OEE on the same equipment effectively adds 25% more capacity without buying a single new machine.
1
Automate Data Collection from Every Machine
Manual logs miss 30-50% of micro-stops and speed losses. Connect PLCs, sensors, and machine interfaces to a centralized platform that captures machine states, cycle counts, and downtime reasons automatically. Accurate measurement is the non-negotiable foundation—you cannot improve what you do not measure.
2
Run Pareto Analysis on Your Top Downtime Causes
Export your downtime data and sort it by total lost minutes per cause. Typically, 3-5 recurring issues account for 60-80% of all lost time. Apply 5-Why root cause analysis to each. Most plants find that fixing one recurring breakdown or one slow changeover alone delivers 5-8% OEE improvement.
3
Shift from Calendar-Based to Condition-Based PM
Replace fixed-interval maintenance with sensor-driven triggers—vibration thresholds, thermal limits, and oil quality benchmarks. This eliminates both premature servicing (wasted labor and parts) and late intervention (unexpected failures). Availability scores typically rise 15-25% within the first year.
4
Optimize Changeover with SMED Methodology
Setup and changeover time accounts for nearly 29% of OEE losses in make-to-order environments. Apply Single-Minute Exchange of Die principles: separate internal tasks (machine stopped) from external tasks (done while running), standardize tooling, and pre-stage materials. Target 50% changeover reduction.
5
Deploy Real-Time OEE Dashboards for Operators
Give floor teams live visibility into their shift's availability, performance, and quality scores. Real-time feedback empowers operators to self-correct speed losses and flag issues immediately rather than discovering them in end-of-shift reports. Plants with operator-facing dashboards consistently outperform those relying on management-only reporting. Reach out to iFactory support to explore how real-time OEE tracking works across your production lines.
Common Equipment Failure Patterns and How to Prevent Them
Equipment does not fail randomly. Most machines follow predictable degradation curves, and the failure mode determines which maintenance strategy will be most effective. Understanding these patterns helps your team invest in the right prevention measures for each asset category.
Discharge temperature rise, energy consumption increase, vibration change
Thermal monitoring + energy benchmarking + vibration analysis
Electric Motors
Winding insulation breakdown, rotor bar cracks
Current imbalance, overheating, unusual harmonic content
Motor current signature analysis + infrared thermography
Match your maintenance investment to failure consequences. Equipment scoring 20+ on the criticality matrix warrants continuous monitoring; lower-scoring assets can be managed with structured preventive schedules.
Not sure which monitoring approach fits your equipment mix? Our team will assess your plant's asset profile and recommend the optimal combination of monitoring technologies for maximum ROI.
Turn Your Factory Floor into a Predictable, Optimized Operation
Spreadsheets cannot detect a spindle bearing degrading at 0.2mm per week or a hydraulic pump losing 3% efficiency every month. iFactory connects maintenance data, sensor feeds, and production context into one intelligent platform—so your team spends less time chasing breakdowns and more time driving OEE toward world-class performance.
What is Overall Equipment Effectiveness and why does it matter for factory floor equipment?
OEE multiplies three factors—Availability, Performance, and Quality—into a single percentage that shows how much of your planned production time is truly productive. A score of 85% is considered world-class, while most plants operate between 60% and 75%. Every percentage point of OEE improvement translates directly into increased throughput on existing equipment without additional capital spending. Contact iFactory support to learn how automated OEE tracking works for your production setup.
How quickly does predictive maintenance pay for itself?
Most plants identify their first major prevented failure within 30-60 days of deploying condition monitoring on critical assets. Quick wins from catching deferred maintenance issues often recover the initial investment within 6-9 months. Over 12-18 months, predictive models continuously improve accuracy—typically reaching 85-95% reliability—and the ROI compounds as more assets are brought into the program.
Can older factory equipment benefit from modern monitoring technology?
Absolutely. Retrofit sensors for vibration, temperature, current, and ultrasonic monitoring can be installed on virtually any machine regardless of age or manufacturer. Older equipment often benefits the most because it lacks built-in diagnostics and has longer failure histories that AI models can learn from. A phased sensor rollout starting with your highest-criticality assets delivers measurable value from day one.
What is the difference between a CMMS and a manual maintenance tracking system?
Manual tracking with spreadsheets and paper logs cannot scale beyond a handful of assets without data falling through the cracks. A CMMS automates scheduling, captures digital work order sign-offs, manages spare parts inventory, tracks maintenance costs per asset, and generates compliance reports. Plants using a CMMS typically reduce administrative overhead by 60% while improving PM completion rates above 90%. Reach out to our team to see how iFactory's CMMS capabilities streamline your entire maintenance operation.
How do I decide which maintenance strategy to use for each machine?
Start with a criticality assessment—score each asset on production impact, safety risk, repair complexity, redundancy, and downstream effect. Critical assets (scores 20-25) warrant predictive maintenance with continuous sensor monitoring. High-importance assets (12-19) benefit from condition-based maintenance with periodic sensor checks. Standard assets (below 12) can be managed with basic preventive schedules or even run-to-failure if replacement is fast and inexpensive.