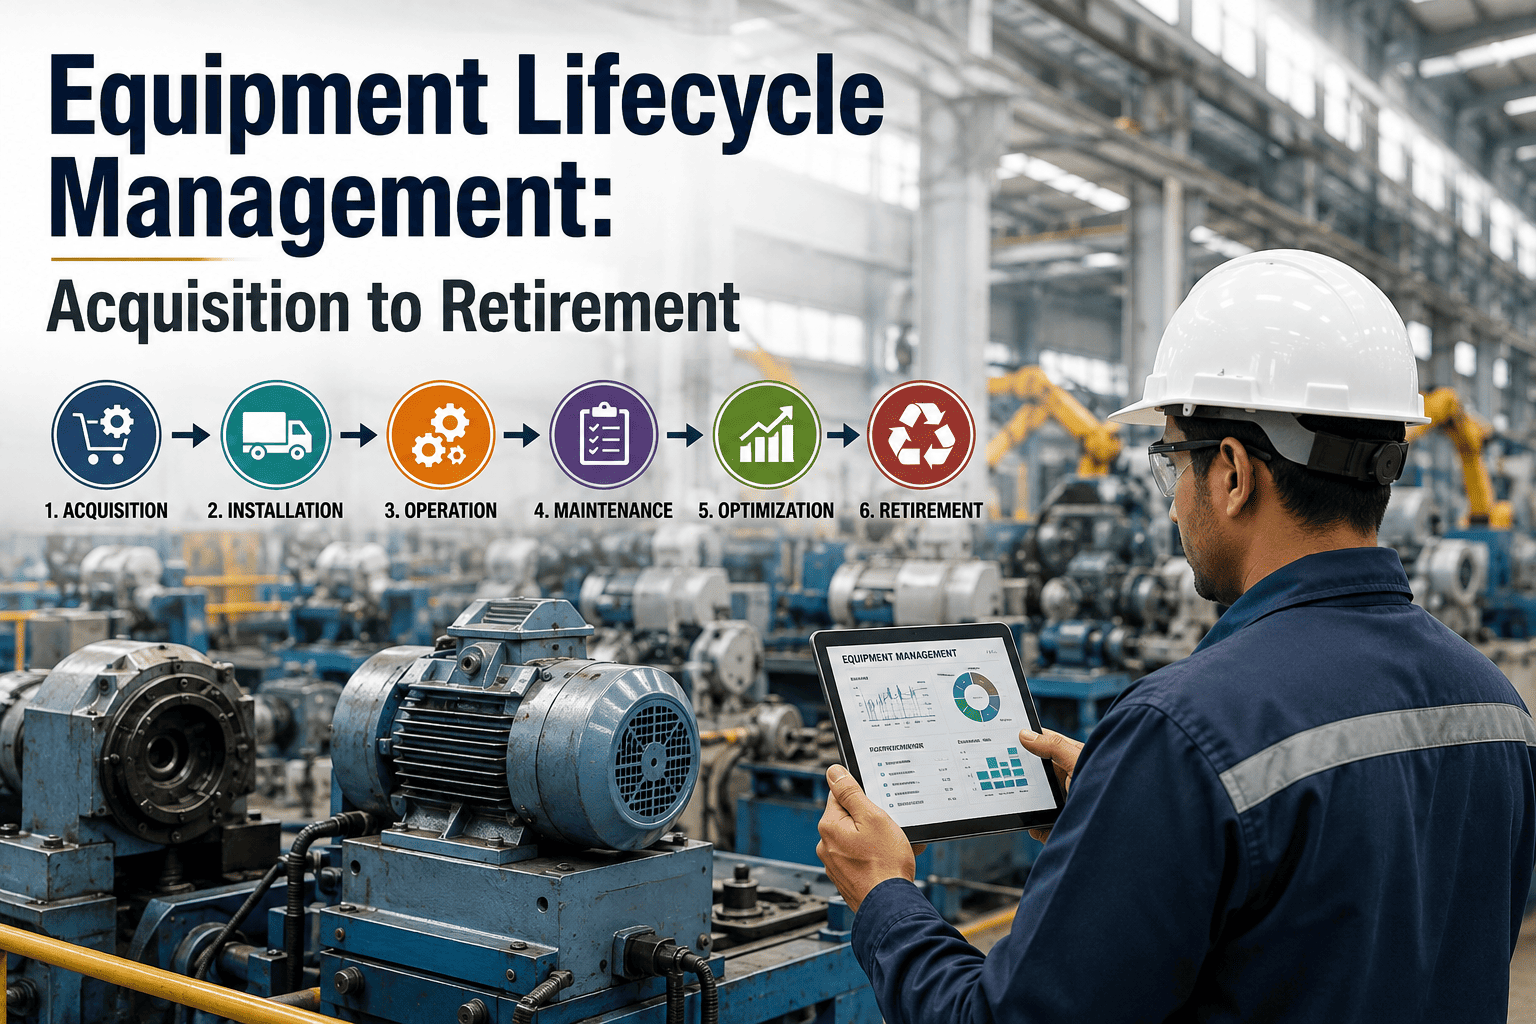
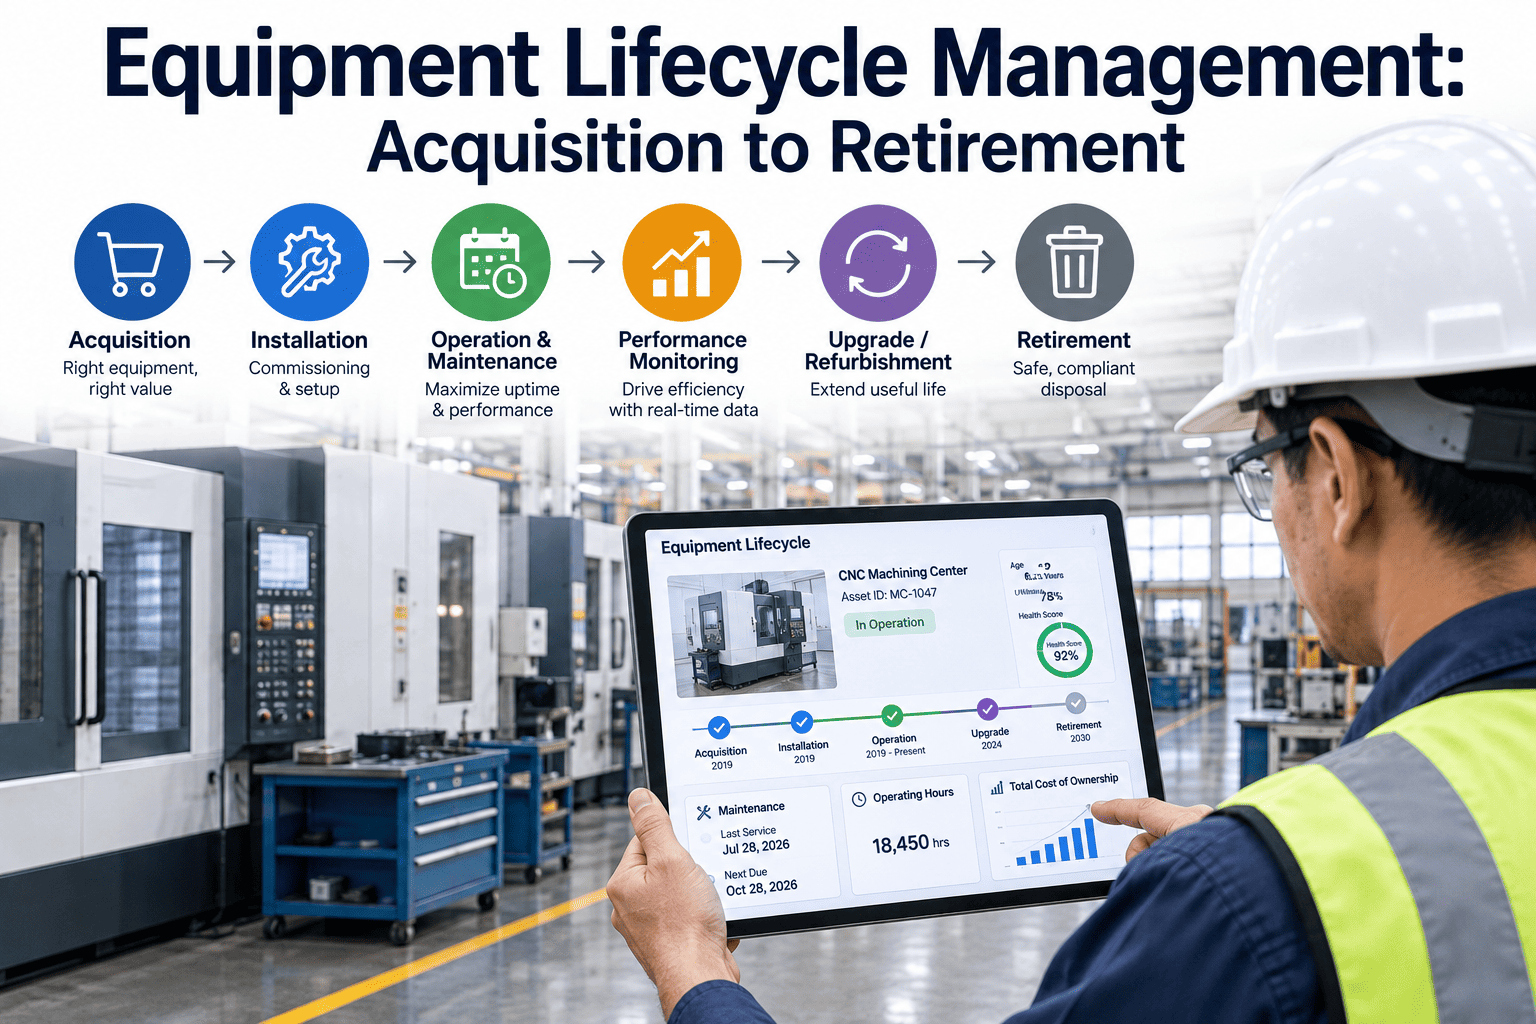
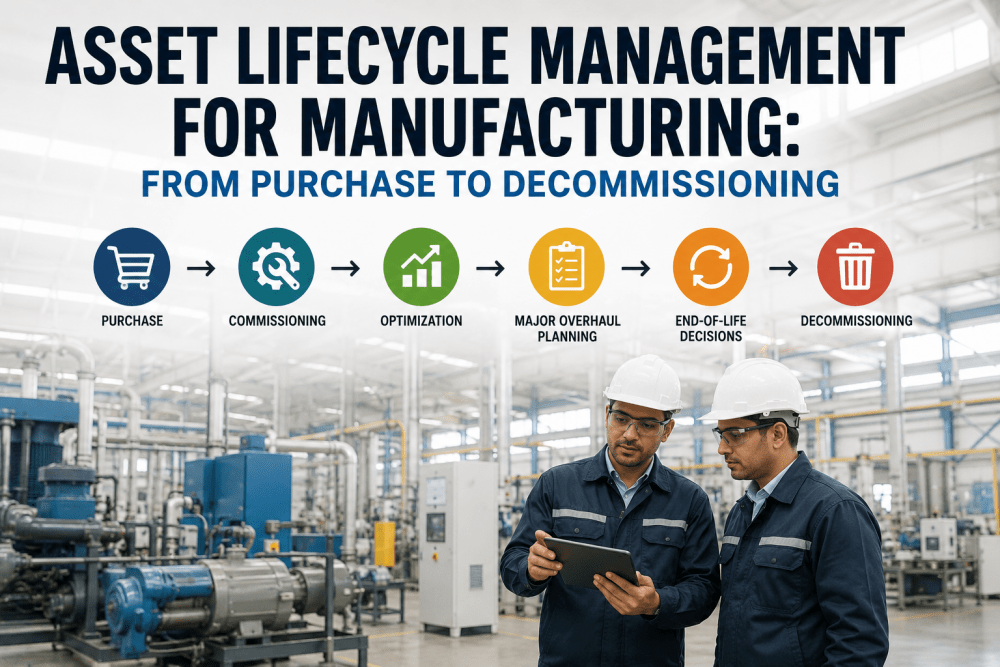
A piece of production equipment usually gets more attention on the day it is installed than at any other point in its working life. The specification gets debated for months, the installation gets its own project plan and startup checklist, and then the asset disappears into the maintenance backlog for the next ten or fifteen years until it fails often enough that someone finally asks whether it should be replaced. In between, almost nobody is tracking whether the equipment is still delivering the value it was purchased to deliver, what it actually costs to keep running each year, or the point at which those numbers quietly flip in favor of retirement. Equipment lifecycle management closes that gap by treating specification, procurement, operation, maintenance, and retirement as one connected decision instead of five separate ones handled by different people at different times. iFactory's AI-powered platform tracks equipment performance and cost across its entire working life, and you can book a demo to see how it applies to your own asset base.
OPERATIONS MANAGEMENT · EQUIPMENT LIFECYCLE · ASSET STRATEGY · TCO
Every Asset Moves Through Six Stages. Most Plants Actively Manage Two.
Specification and procurement get scrutinized once, installation gets documented, and then operation, ongoing maintenance economics, and the retirement decision are left to whoever happens to notice the asset is struggling. Equipment lifecycle management puts a single, continuous view across all six stages, so decisions made at purchase are still visible and usable a decade later when the retirement question finally comes up.
Specification
Rarely Revisited
Procurement
Price-Led Only
Installation
One-Time Record
Maintenance
Actively Tracked
THE COST OF ISOLATED STAGES
What Gets Lost When Nobody Owns the Full Asset Lifecycle
When specification, procurement, operation, and retirement are each handled by different people at different times with no shared record, the plant loses the ability to see an asset's true cost until long after the decisions that shaped it were made. A purchasing team optimizing for the lowest bid has no visibility into the maintenance bills that decision will generate five years later, and a maintenance team fighting recurring failures often has no access to the original specification that may explain why the equipment was undersized from day one. The figures below reflect patterns commonly seen across manufacturing plants without a connected lifecycle view.
60-70%
Of Total Lifecycle Cost Occurs After the Original Purchase Price
2-3x
Higher Repair Spend Common in the Final Years Before Replacement
15-20%
Of Assets Typically Kept in Service Well Past Their Optimal Retirement Point
Unknown
Is the Honest Answer Most Plants Give for True Cost Per Asset
TOTAL COST OF OWNERSHIP
What Lifecycle Cost Actually Includes Beyond the Purchase Price
The number on a purchase order is only the starting point of what an asset will actually cost over its working life. Total cost of ownership pulls together every category below into a single figure that makes it possible to compare two very different pieces of equipment fairly, instead of defaulting to whichever quote looked smallest at the time of purchase. Plants that formalize this comparison during procurement consistently make different, and cheaper, purchasing decisions than those that evaluate on price alone.
1
Purchase Price and Financing or Depreciation Terms
2
Installation, Commissioning, and Operator Training Cost
3
Energy, Consumables, and Routine Operating Cost
4
Planned Maintenance and Unplanned Repair Spend
5
Downtime Cost From Failures and Planned Outages
6
Disposal Cost Offset by Residual or Resale Value
THE FULL LIFECYCLE
Six Stages Every Piece of Equipment Passes Through
Each stage of an asset's life shapes the cost and performance of every stage that follows it, which is exactly why treating them as disconnected events leads to decisions that look reasonable in isolation but expensive in hindsight. The breakdown below covers what each stage actually involves and what most plants tend to miss.
1
Specification
Requirements should be defined against actual production needs, current and projected throughput, and integration with existing equipment, not simply matched to whatever the outgoing asset could do. This is also the point where expected duty cycle, environmental conditions, and future capacity headroom should be documented, since those assumptions will shape every maintenance and performance decision made for the rest of the asset's life.
Often overlooked: specifying to replace like-for-like instead of to the process requirement, which locks in the wrong capacity for years.
2
Procurement
A sound procurement decision weighs total cost of ownership, including expected maintenance spend, spare parts availability, and vendor support response time, alongside the upfront purchase price. Bringing the maintenance team into the procurement conversation, rather than presenting them with equipment after the decision is already final, is one of the simplest ways to catch a poor total-cost decision before it becomes a ten-year problem.
Often overlooked: choosing the lowest quoted price without modeling the maintenance and downtime cost that price difference will create over ten years.
3
Installation and Commissioning
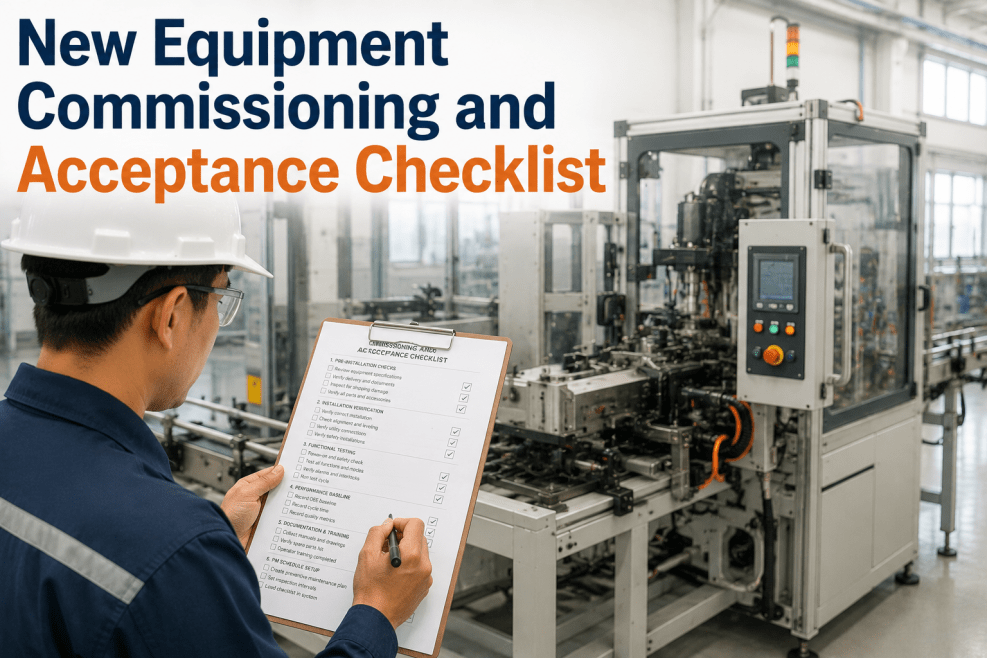
A clean installation establishes the performance baseline every future maintenance and performance decision will be measured against, along with the documentation the asset will carry for its entire life. This baseline record, captured once at commissioning, is what makes it possible years later to say with confidence whether a machine has actually degraded or is still running within its original design envelope.
Often overlooked: commissioning data gets filed away and never connected to later maintenance records, so there is no baseline to compare against.
4
Operation
Ongoing operation should be tracked against the original design specification, utilization rate, and output quality, so a slow decline in performance is caught early instead of discovered at a failure. Comparing current throughput and cycle time against the commissioning baseline on a regular cadence, rather than only when something feels wrong, is what turns this stage from passive monitoring into an early warning system.
Often overlooked: equipment running well below its designed capacity for years without anyone questioning why, since it is still technically "working."
5
Maintenance
Maintenance strategy should shift over an asset's life, typically moving from reactive repair in early years toward predictive intervention as failure patterns and wear data accumulate. This evolution only happens naturally when someone is actually reviewing the accumulated history on a regular basis, rather than treating each work order as an isolated event.
Often overlooked: the same maintenance strategy is applied for the asset's entire life instead of evolving as more condition data becomes available.
6
Retirement
Retirement planning should be a data-driven comparison of continued repair cost against replacement cost, ideally started well before the asset becomes an emergency, with disposal and write-off handled cleanly.
Often overlooked: the retirement decision only gets made after an unplanned failure forces it, at the worst possible moment for negotiating a replacement.
Stop Managing Six Lifecycle Stages With Six Different Spreadsheets
iFactory's platform connects specification, procurement, operation, maintenance, and retirement data into a single record per asset, so lifecycle decisions are based on complete history instead of whoever happens to remember. Book a demo to see it applied to your equipment list.
SHARED OWNERSHIP
Who Should Own Each Stage, and Why the Handoffs Usually Break
Part of why equipment lifecycle data fragments in the first place is that no single department owns the whole picture, and that is normal since no one role has visibility into specification, purchasing, daily operation, maintenance, and financial write-off all at once. The problem isn't that different teams are involved, it's that the record doesn't travel with the asset from one team to the next, so knowledge that engineering had at specification time is effectively invisible to whoever is fighting a repeat failure eight years later. Mapping ownership by stage, and making sure each handoff includes the data the next stage will need, is the first step toward making sure that record actually travels.
Engineering Owns Specification
Process and reliability engineering define the performance requirement the asset must meet, ideally documented in enough detail that it can be checked against actual operating data years later.
Procurement Owns Total Cost Evaluation
Purchasing evaluates vendor quotes against the full total cost of ownership picture, not just the headline price, and should have visibility into what similar assets have historically cost to maintain.
Operations Owns Performance Tracking
Production teams are best positioned to notice a gradual decline in output, speed, or quality long before it shows up as a formal maintenance complaint or failure event.
Maintenance and Finance Own the Retirement Call
Maintenance supplies the repair cost and failure trend data, while finance translates that trend into a replace-versus-repair recommendation grounded in actual dollars rather than instinct.
HEAD TO HEAD
Reactive Asset Tracking vs Full Equipment Lifecycle Management
The comparison below covers the dimensions that most directly determine whether an asset's true cost and condition are visible in time to act on, or only visible after the fact. Plants operating in the left-hand column usually describe their asset strategy as "we fix things when they break," while plants in the right-hand column can typically name their next five equipment replacements before any of them fail.
THE RETIREMENT DECISION
Four Signals That Repair Has Stopped Making Financial Sense
The hardest lifecycle decision is usually the last one: knowing when an asset has crossed from "still worth fixing" to "worth replacing." Waiting for a single dramatic failure to force the decision almost always means negotiating a replacement under time pressure, with limited options and no room to plan the transition properly. These four signals, tracked together rather than in isolation, tend to give the clearest picture of when that line has actually been crossed.
Rising Repair Frequency and Cost
When repair events start occurring more often and each one costs more than the last, the asset is typically past the point where maintenance alone can hold its reliability steady, and the repair spend trend line is usually a clearer signal than any single invoice.
Declining Output or Quality
Equipment that no longer holds tolerance, speed, or output consistency it once did is quietly costing the plant in scrap, rework, and missed throughput even while it stays technically operational.
Parts Availability and Obsolescence
Spare parts that are increasingly hard to source, discontinued by the manufacturer, or only available through costly custom fabrication are a strong signal that continued repair is becoming unsustainable, regardless of how the equipment is otherwise performing.
Safety and Compliance Risk
Aging equipment can drift out of step with current safety standards or emissions requirements, turning a maintenance decision into a compliance and liability decision as well.
MEASURED OUTCOMES
Results From Equipment Lifecycle Management Deployments
These figures reflect manufacturing plants where a connected lifecycle view was implemented across their equipment base and tracked over a minimum twelve-month period. The gains come less from any single tool and more from simply having one place where specification, cost, and performance data all live together, which makes the replace-versus-repair math visible instead of buried across departments.
18%
Lower Lifecycle Cost
Per Asset From Better Retirement Timing
27%
Fewer Emergency Replacements
From Planning Retirement Ahead of Failure
1.6x
Longer Useful Life
On Assets With a Well-Tuned Maintenance Strategy
$310K
Annual Savings
From Reduced Unplanned Downtime and Repair Spend
FREQUENTLY ASKED QUESTIONS
Questions From Plant Managers and Asset Owners
How is equipment lifecycle management different from a standard CMMS or maintenance log?
A maintenance log typically starts recording data from the first work order and stops at maintenance activity, while lifecycle management connects specification and procurement decisions, commissioning baselines, ongoing performance, maintenance history, and the eventual retirement decision into one continuous record per asset. The goal is to answer not just "what maintenance has this asset had" but "is this asset still worth keeping," which a maintenance log alone cannot answer.
Book a demo to see how this connected view is built for your equipment.
Can we start lifecycle management on equipment we already own, or only on new purchases?
Existing equipment can absolutely be brought into a lifecycle management approach, though the historical picture will naturally be less complete than for an asset tracked from day one. Most plants start by building a current-state baseline for existing critical equipment using available maintenance and performance records, then apply the full specification-through-retirement discipline to every future purchase going forward. Over time, even partially reconstructed history is far more useful for spotting cost trends than no shared record at all.
How do we objectively decide between repairing an aging machine again or replacing it now?
The clearest approach compares the trend in cumulative repair cost against the cost of replacement, factored against expected remaining useful life, output performance, and parts availability, rather than looking at any single repair invoice in isolation. When repair cost trend lines are climbing while output and reliability are declining, that combination is usually a stronger signal than either factor alone, and it gives you a defensible number to bring into a capital budgeting conversation rather than a gut feeling.
Contact our support team to talk through how this comparison gets modeled for a specific asset.
Does this apply equally to every type of equipment, or mainly to large capital assets?
Lifecycle management delivers the largest financial impact on high-cost, high-criticality assets such as presses, furnaces, compressors, and large rotating equipment, but the same principles apply at smaller scale to any asset whose failure disrupts production, including material handling equipment, pumps, and process instrumentation. Most plants prioritize their critical asset list first, since that is where the cost of an uninformed decision is highest, and expand coverage to secondary equipment from there.
What data do we need to have in place before starting a lifecycle management program?
A useful starting point is an accurate equipment list with installation dates, along with whatever maintenance and repair history already exists in work orders or spreadsheets, even if incomplete. iFactory's platform is designed to work with the data you already have and improve completeness over time rather than requiring a perfect historical record before it can add value, so imperfect data is not a reason to delay getting started.
Book a demo to see what a realistic starting data set looks like.
See Your Equipment's True Cost, From Purchase to Retirement
iFactory's platform connects every stage of the equipment lifecycle into one record per asset, so replacement decisions are based on data instead of whoever happens to notice a machine is struggling. Book a demo to see it applied to your own equipment list.