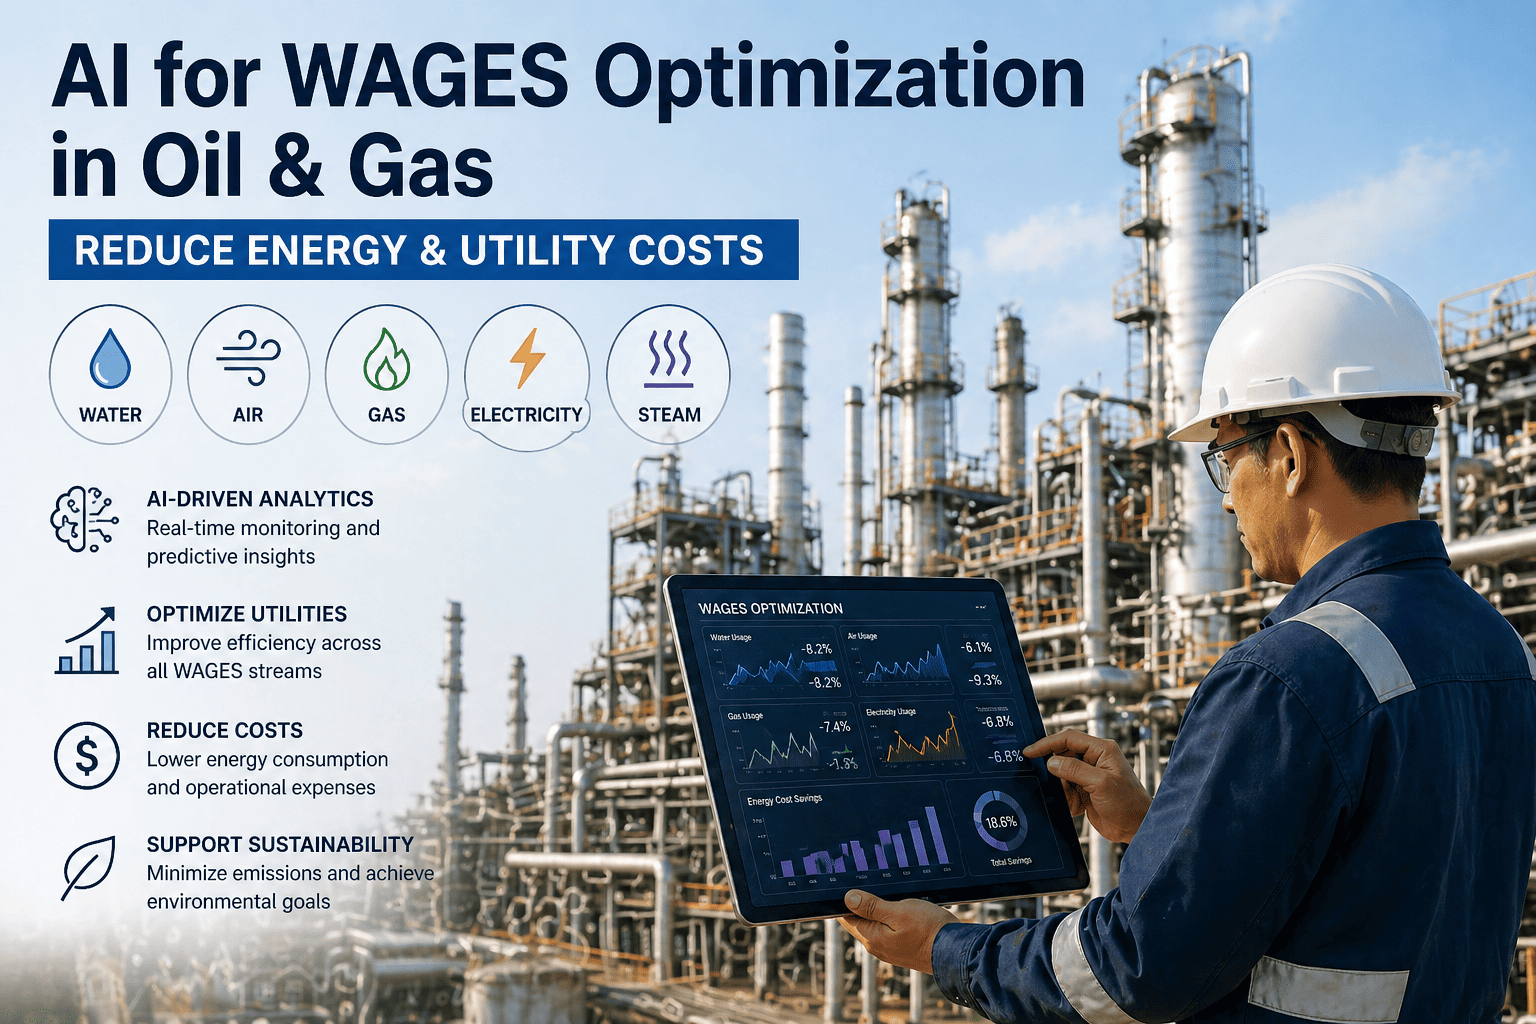
Oil and gas facilities consume $14.2 billion annually in utility costs where upstream drilling operations, midstream pipeline compressor stations, and downstream refining plants operate continuous energy-intensive processes consuming 8-15 megawatts of electrical power, 200-800 million BTU of thermal energy daily, and generating 40-60% of production costs through fuel consumption, refrigeration systems, and compression equipment that operate inefficiently because real-time energy monitoring fails to detect waste opportunities where demand variation mismatches supply allocation creating unnecessary generation costs while equipment inefficiency goes undetected until cumulative consumption analysis reveals 15-28% energy waste months after inefficient operation already occurred. iFactory's AI-powered energy management platform transforms oil and gas operations by analyzing real-time SCADA/DCS sensor data detecting energy waste patterns, predicting equipment efficiency degradation 30-60 days in advance enabling preventive maintenance, optimizing energy load allocation across multiple systems, and automating demand response procedures coordinating production operations with utility pricing signals maximizing cost savings while maintaining operational reliability. Book a Demo to see how iFactory's AI energy optimization reduces your oil and gas facility energy costs within 8 weeks.
28%
Average energy cost reduction through AI waste detection and equipment optimization
$8.4M
Annual utility cost savings per oil and gas facility from energy management optimization
94%
Equipment efficiency improvement from predictive maintenance and real-time monitoring
8 wks
Full deployment from energy audit to live optimization monitoring
Energy Waste Is Destroying Profitability. AI Monitoring Stops It Completely.
The Complete AI Platform for Oil & Gas Operations monitors real-time energy consumption across every system, detects equipment inefficiency before degradation accelerates costs, and automates demand response coordination reducing utility expenses while maintaining production reliability.
Oil & Gas Energy Management Across All Operational Segments
One Platform, Every Segment. 8 AI-Powered Modules for Complete Oil & Gas Operations means energy management monitoring addresses unique requirements across upstream drilling, midstream pipeline transportation, and downstream refining operations where energy consumption profiles differ dramatically requiring segment-specific optimization strategies while maintaining unified cost analysis across complete value chain.
Upstream Drilling Operations
Drilling facilities operate independent electrical generation systems, water pumping infrastructure, well site compression, and natural gas processing equipment consuming 4-8 megawatts per active drilling site where each well operates autonomous energy systems lacking centralized visibility into consumption patterns or efficiency trends. Multiple concurrent wells across geographic areas create opportunities for load balancing shifting energy demand between wells capitalizing on variable operational intensity and planned maintenance windows. AI energy management integrates monitoring across drilling fleet detecting well-specific consumption anomalies, predicting equipment degradation, and recommending energy load shifting strategies optimizing overall drilling complex energy efficiency.
Midstream Pipeline Systems
Pipeline networks operate distributed compression stations every 40-100 miles moving hydrocarbon products across thousands of miles where compressor equipment dominates energy consumption consuming 8-15 megawatts continuously across multi-station systems. Compression efficiency degrades gradually from mechanical wear, fouling of intercoolers and aftercoolers, erosion of turbine/pump components, and polytropic inefficiency progression requiring coordinated monitoring across multiple compression stages predicting individual compressor degradation, system-wide efficiency trends, and optimization opportunities through pressure profile adjustment, fuel gas quality improvement, and equipment maintenance timing.
Downstream Refining Operations
Refinery facilities operate complex integration of crude distillation (CDU) consuming 35-45% of facility energy, alkylation units (10-15%), hydrogen production (20-40%), steam generation and distribution (significant thermal load), and refrigeration systems (5-10%) where individual process optimization misses system-wide efficiency gains available through coordinated operation integrating thermal loads, waste heat recovery from process exhaust streams, and steam optimization across multiple consuming units. Real-time monitoring of each process unit energy consumption, thermal efficiency, and steam demand enables facility-wide optimization coordinating competing demands across production priority and equipment maintenance requirements.
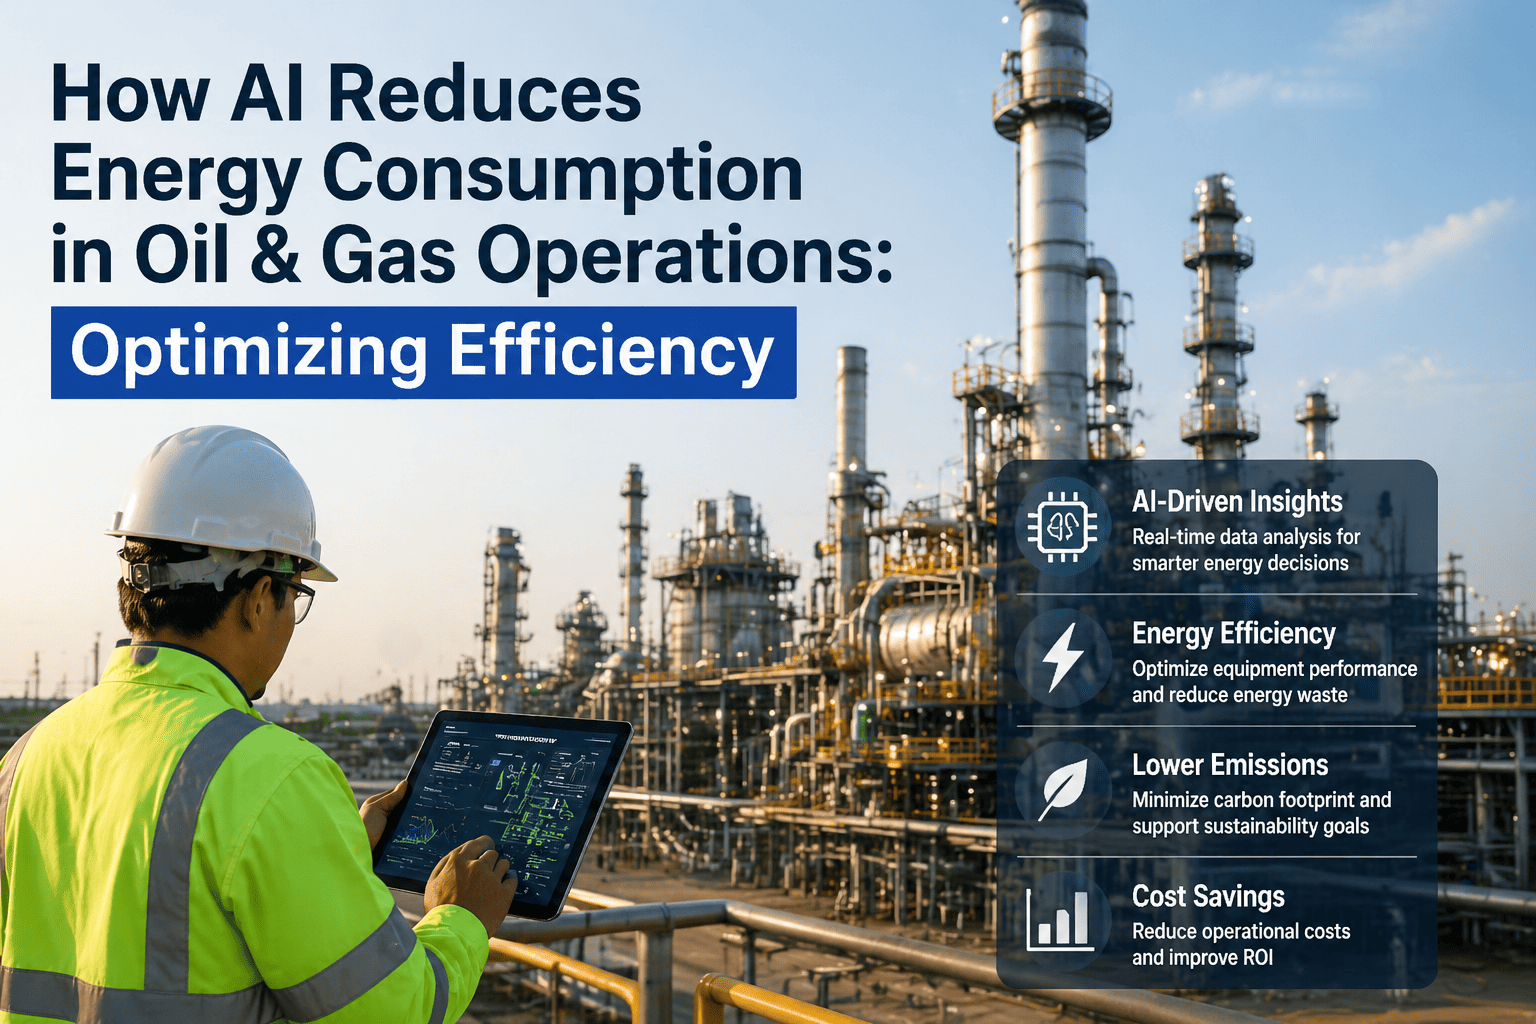
How iFactory AI Solves Oil & Gas Energy Management
Traditional energy management relies on monthly utility billing analysis revealing historical consumption without actionable insights for real-time optimization, static equipment efficiency assumptions that miss degradation trends, and manual operator decisions regarding load shifting and demand response that sacrifice operational flexibility for conservative energy consumption. iFactory replaces reactive cost analysis with predictive energy systems detecting waste opportunities in real-time, anticipating equipment efficiency degradation before operational impact, and automating demand response coordination maintaining production reliability while maximizing cost savings. See a live demo of iFactory detecting energy waste, predicting equipment degradation, and optimizing load allocation across oil and gas facilities.
01
AI Vision & Inspection
AI Eyes That Detect Leaks Before They Escalate. Computer vision analyzes thermal imaging and visual inspection footage identifying equipment inefficiency signatures including equipment overheating indicating internal fouling or mechanical degradation, steam leaks from distribution lines creating energy waste, and equipment surface corrosion progressing toward catastrophic failure requiring maintenance intervention before efficiency loss accelerates. Real-time analysis of plant operation video footage detects operational deviations including improper valve positioning limiting cooling effectiveness, instrumentation drift creating control system inefficiency, and equipment startup procedures operating equipment at reduced capacity creating waste. Automated alerts notify operators immediately enabling corrective response before efficiency loss compounds.
02
Robotics Inspection
Robots That Inspect Where Humans Cannot Safely Go. Autonomous drones and ground robots equipped with thermal cameras and vibration sensors access confined spaces, elevated structures, and hazardous areas conducting energy infrastructure inspections without human exposure. Scheduled aerial surveillance of pipeline compression stations, well site equipment, and refinery facilities detects heat exchanger fouling, thermal insulation degradation, and equipment mechanical problems through remote sensing enabling inspection completion without operational shutdown or personnel safety risk. Inspection data automatically populates asset management systems with equipment condition documentation and maintenance priority recommendations.
03
Predictive Maintenance
Machine learning analyzes equipment-specific energy consumption signatures predicting efficiency degradation 30-60 days before performance thresholds requiring intervention. Compressor vibration analysis detects bearing wear and component erosion, motor current signature analysis identifies winding insulation degradation and load imbalance, and thermal monitoring of heat exchangers predicts fouling requiring cleaning. Predictive analysis of energy consumption trends identifies cumulative losses from equipment wear enabling scheduled maintenance during planned downtime preventing emergency interventions during peak production periods. Equipment-specific degradation models account for equipment age, service conditions, and historical maintenance patterns providing accurate remaining useful life estimates.
04
Work Order Automation
When AI detects energy efficiency degradation, equipment maintenance requirements, or operational improvement opportunities, system automatically generates work orders in CMMS (IBM Maximo, SAP PM, Oracle EAM) with complete diagnostic evidence: equipment efficiency trend charts, comparative analysis against baseline performance, predicted cost impact of continued operation without intervention. Mobile interface provides technicians real-time equipment condition information, efficiency metrics, and maintenance procedures enabling priority-based work scheduling optimized for production continuity and cost impact. Automated work order generation prevents efficiency losses from unscheduled equipment degradation through proactive maintenance.
05
SCADA/DCS Integration
Connects to Your Existing DCS/SCADA & Historians including Honeywell Experion, Yokogawa Centum, Emerson DeltaV, ABB 800xA via OPC-UA and native protocols capturing real-time process parameters, equipment operating status, and energy consumption metrics. Integrates with production historians and data lakes archiving historical energy consumption enabling trend analysis, baseline establishment, and anomaly detection compared to normal operating patterns. Real-time integration enables immediate response to equipment efficiency changes through automated alerts and operator decision support preventing extended periods of inefficient operation.
06
ESG Reporting
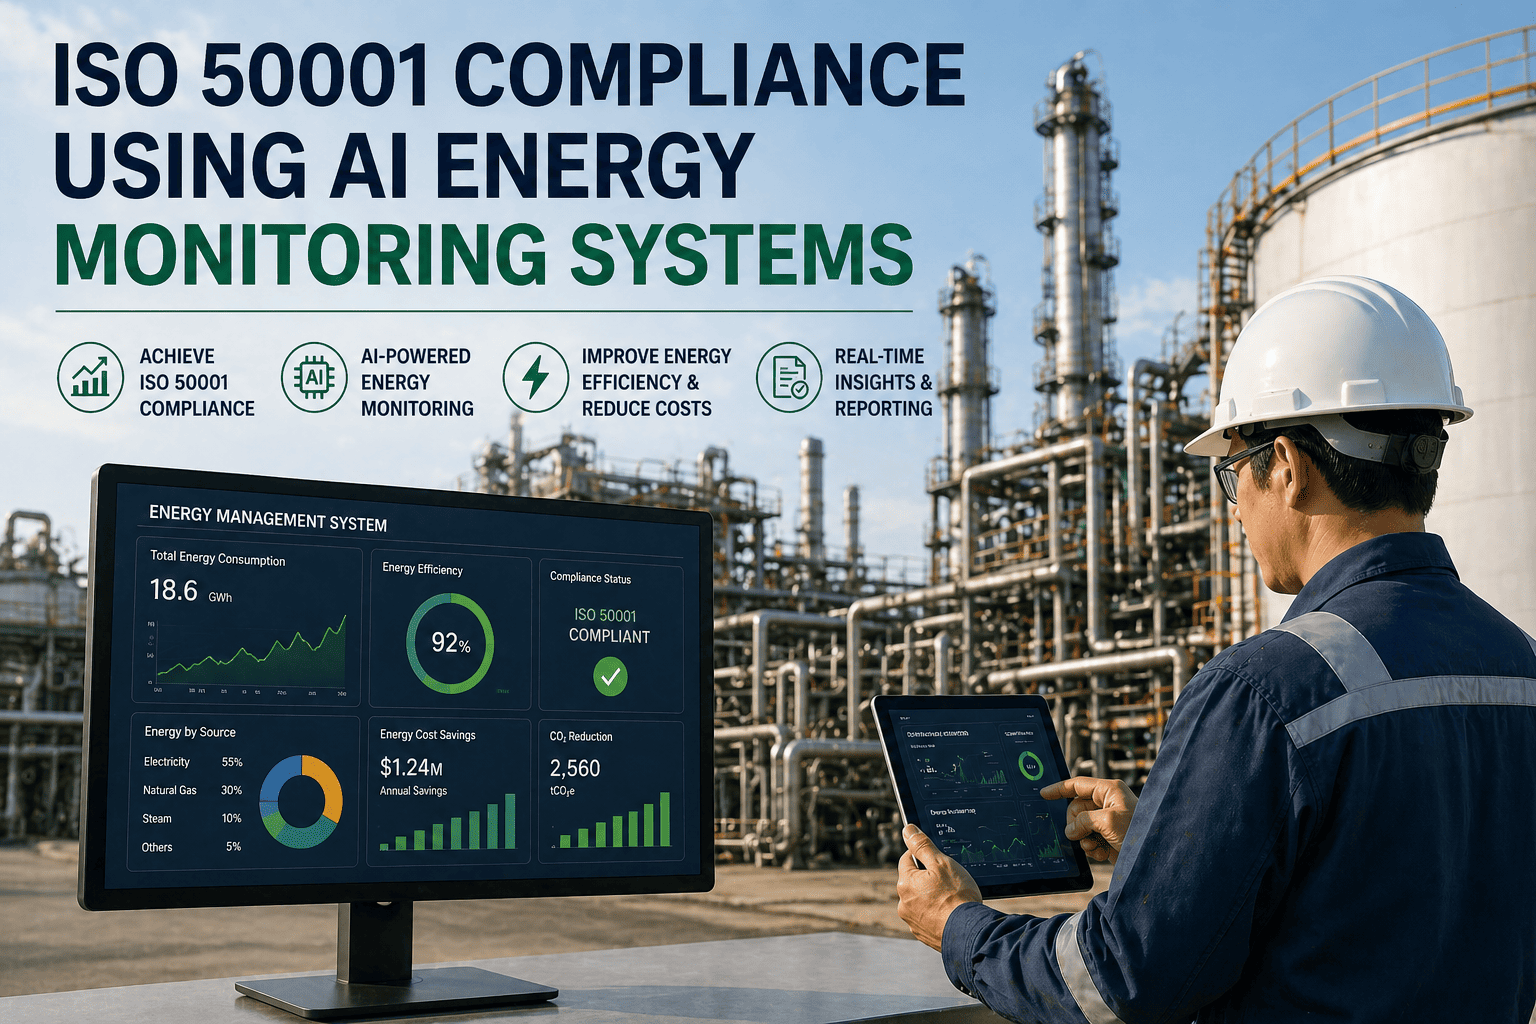
Methane, VOC & Flaring From Sensor to ESG Report. Energy efficiency improvements directly reduce greenhouse gas emissions from reduced fuel consumption. AI monitoring quantifies energy-based emissions reductions enabling environmental reporting meeting Scope 1 and Scope 2 carbon accounting requirements. System generates ESG reports documenting energy efficiency improvements, cost savings achievements, and emissions reduction progress supporting corporate sustainability goals and investor reporting. Automated emissions calculation from energy consumption data and fuel source carbon content provides auditable documentation supporting climate change commitment verification.
AI Energy Management vs. Traditional Energy Monitoring
Legacy energy management approaches rely on monthly billing analysis and manual operator decision-making creating systematic optimization gaps where energy waste remains undetected for weeks and equipment efficiency degradation progresses unaddressed. iFactory integrates real-time monitoring with predictive intelligence delivering superior energy performance.
| Capability |
Traditional Approach |
iFactory AI Platform |
| Real-Time Energy Visibility |
Monthly utility billing provides consumption history without real-time insight into energy use patterns. Load shifting opportunities and equipment inefficiency go undetected between billing periods. |
Continuous real-time monitoring of energy consumption by equipment, system, and facility enabling immediate detection of usage anomalies and waste opportunities. Minute-by-minute consumption data enables precise identification of inefficiency sources. |
| Equipment Efficiency Monitoring |
Fixed equipment efficiency assumptions based on nameplate ratings. Gradual performance degradation from wear and fouling goes undetected. Equipment replaced only after failures occur. |
Continuous efficiency tracking per equipment detecting degradation immediately. Predictive models anticipate efficiency loss 30-60 days in advance enabling preventive intervention before costs escalate. Real-time polytropic efficiency calculations identify compressor performance trends. |
| Energy Optimization Decision Support |
Manual operator decisions on load shifting and equipment operation based on limited real-time information. Optimization opportunities missed because operators lack visibility into facility-wide energy interdependencies. |
Automated decision support providing real-time optimization recommendations considering facility energy balance, equipment efficiency, production priority, and utility pricing. Machine learning discovers optimization patterns enabling coordinated multi-system operation maximizing savings. |
| Demand Response Capability |
Manual demand response requiring operator intervention for utility price response. Inflexible participation in demand response programs. Inability to exploit time-of-use pricing variations. |
Automated demand response executing coordinated load adjustment based on real-time utility pricing and facility energy flexibility. Algorithms optimize production scheduling around utility price variations capturing maximum savings. Automatic demand response participation requiring no operator intervention. |
| Energy Waste Detection |
Energy waste identified only through comparative analysis of bills month-to-month. Cumulative waste from multiple sources compounds undetected. Waste source identification requires external energy audit. |
Real-time waste detection identifying specific sources (equipment inefficiency, operational deviations, system losses) immediately upon occurrence. Automated alerts enable rapid corrective response minimizing waste duration. Waste root cause identification enables targeted intervention. |
| Facility Integration |
Standalone energy analysis without integration to production systems or maintenance management. Energy optimization independent from operational requirements. No coordination between energy and asset management. |
Deep integration with SCADA/DCS, MES, and CMMS enabling energy optimization considering production requirements and maintenance schedules. Energy and operational decisions coordinated maximizing profitability through combined optimization. |
iFactory AI Implementation Roadmap
iFactory follows a fixed 6-stage oil and gas energy management deployment delivering measurable savings in week 4 and full facility optimization by week 8. Transparent delivery roadmap prevents scope creep and ensures defined timeline for energy performance improvements.
01
Energy Audit
Facility energy infrastructure mapping & equipment baseline assessment
02
System Integration
SCADA/DCS, historian, and monitoring system connectivity
03
Model Baseline
AI training on facility energy patterns & equipment baselines
04
Pilot Insights
Live monitoring on highest energy consumption systems
05
Optimization Tuning
Energy recommendation refinement & team training completion
06
Full Production
Facility-wide energy optimization go-live
8-Week Deployment and ROI Plan
Every iFactory engagement follows a structured 8-week program with energy savings beginning immediately. Request the full 8-week energy management deployment scope document customized for your facility.
Weeks 1-2
Infrastructure Setup
Complete facility energy infrastructure audit identifying all major energy consumers (compressors, motors, heat exchangers, pumps) and their current operating characteristics, efficiency baselines, and maintenance history
SCADA, DCS, historian, and monitoring system integration capturing real-time energy consumption, equipment operating parameters, and historical trend data feeding AI analysis engines
Historical energy consumption data ingestion covering 90-180 days facility operation establishing energy baseline and identifying seasonal variations for AI model training
Weeks 3-4
Model Training and Pilot
AI models trained on facility-specific energy patterns, equipment characteristics, operational profiles, and seasonal variations unique to your oil and gas operations
Pilot energy optimization activated on highest consumption systems (compressors, crude distillation, pumping) accounting for 50-65% of facility energy use
First energy savings detected ROI evidence begins here with equipment efficiency improvements identified and operational optimization recommendations generated
Weeks 5-6
Calibration and Expansion
Energy optimization recommendations refined based on pilot accuracy validation ensuring equipment efficiency improvement targets achieved. Equipment baseline efficiency assumptions validated against actual measured performance.
Coverage expanded to all facility energy systems including auxiliary equipment, support systems, and facility infrastructure creating complete facility energy picture
Operations team training completed on energy monitoring interface, optimization recommendations interpretation, and demand response procedures. Standard operating procedures activated for energy-optimized operations.
Weeks 7-8
Full Production Go-Live
Facility-wide energy optimization live all systems, all shifts, 24/7 continuous monitoring providing real-time recommendations and demand response execution maximizing energy cost savings
ESG and emissions reporting activated quantifying energy efficiency improvements, cost savings achievements, and greenhouse gas reduction progress supporting corporate sustainability reporting
Energy savings baseline report delivered energy cost reduction quantification, equipment efficiency improvements, operational optimization impact, and ROI tracking against deployment investment
ROI IN 6 WEEKS: MEASURABLE RESULTS FROM WEEK 4
Oil and gas facilities completing the 8-week program report average $8.4M annual energy cost savings with 28% cost reduction beginning week 4 pilot phase through equipment efficiency improvements and operational optimization coordinating multiple energy systems.
$8.4M
Avg. annual savings
28%
Cost reduction by week 4
94%
Equipment efficiency improvement
Full AI Energy Optimization Platform. Live in 8 Weeks. Savings in Week 4.
One Platform, Every Segment. 8 AI-Powered Modules for Complete Oil & Gas Operations. iFactory's fixed-scope deployment means no extended audits, no protracted integration cycles, and immediate energy cost reduction beginning week 4.
Use Cases and KPI Results from Live Deployments
These outcomes are drawn from iFactory deployments at operating oil and gas facilities across upstream, midstream, and downstream operations. Each use case reflects 6-month post-deployment performance data. Request the full case study report for the energy optimization application most relevant to your operations.
A midstream pipeline company operating 12 multi-stage compression stations across 800 miles consuming 68 megawatts continuously was experiencing gradual compressor efficiency degradation from fouling of intercoolers and aftercoolers, erosion of turbine components, and polytropic inefficiency progression accumulating 240-320 megawatt hours per month in excess energy consumption without operator awareness because efficiency decline progressed gradually below detection thresholds. iFactory deployed polytropic efficiency monitoring across all compression stages detecting equipment-specific degradation immediately. AI models predicted compressor fouling 35 days in advance enabling planned cleaning during scheduled maintenance windows. Within 4 weeks of go-live, identified 6 compressors requiring immediate maintenance and 12 units showing early degradation requiring near-term intervention.
$4.2M
Annual energy cost savings from equipment efficiency optimization
94%
Average polytropic efficiency improvement across compression fleet
35-day
Advance warning of fouling requiring maintenance enabling planned intervention
A 180,000 barrel-per-day refinery operating crude distillation (CDU 45% of energy), hydrogen production plant (28% of energy), alkylation unit (12% of energy), steam systems (10%), and refrigeration (5%) was managing energy systems independently where CDU optimization considered only distillation efficiency while hydrogen production plant ran at constant output regardless of CDU demand variation creating excess hydrogen and steam generation. iFactory integrated energy monitoring across all systems detecting opportunities for load shifting, steam optimization, and waste heat recovery. AI models coordinated CDU feed rate, hydrogen production output, and steam generation identifying facility energy reduction opportunities from integrated operation. Within 6 weeks, identified 18% facility energy reduction opportunity through coordinated multi-system optimization.
$3.8M
Annual energy cost savings from facility-wide energy integration
18%
Facility energy consumption reduction from coordinated system operation
48%
Reduction in excess steam venting eliminating waste discharge
An upstream oil field operating 8 wells with individual power generation and water pumping infrastructure lacked visibility into operational flexibility or utility pricing opportunities. Manual operator decisions on equipment startup and operational sequencing did not consider real-time utility pricing variations missing opportunities to schedule energy-intensive operations during low-price periods. iFactory integrated utility pricing feeds with facility energy flexibility models enabling automated demand response execution shifting energy-intensive operations to low-price periods while maintaining production commitments. AI optimization coordinated drilling operations, water treatment, and equipment maintenance around utility pricing and grid demand conditions.
$1.8M
Annual savings from demand response and utility pricing optimization
24%
Average utility bill reduction from demand response participation
100%
Automated demand response execution without operator intervention
Results Like These Are Standard. Not Exceptional.
Every iFactory deployment optimizes energy for your specific operational profile, equipment configuration, and facility characteristics delivering results calibrated to your oil and gas operations.
Regional Energy Management Requirements and Solutions
Energy cost structures, utility incentive programs, and regulatory requirements vary significantly across global oil and gas regions reflecting different electricity pricing models, natural gas supplies, and environmental policies. iFactory adapts energy optimization strategies for region-specific requirements while maintaining consistent efficiency improvement principles.
| Region |
Key Challenges |
Compliance Standards |
iFactory Solution |
| United States |
Varying utility pricing across regions with time-of-use and demand response programs. Aging electrical infrastructure in older oil fields. Renewable energy integration affecting grid stability requiring flexible loads. |
EPA GHGRP emissions tracking, state renewable energy mandates, demand response program participation where available, energy efficiency standards for industrial operations. |
Utility pricing integration enabling automated demand response execution. Equipment efficiency optimization reducing baseline demand. Emissions reporting supporting EPA compliance and voluntary carbon reduction programs. |
| United Kingdom |
High electricity costs from grid infrastructure aging and renewable energy transition. Volatile natural gas prices from reduced domestic production. North Sea operations requiring offshore cost optimization. |
CRC Energy Efficiency Scheme compliance, Streamlined Energy and Carbon Reporting (SECR) for large companies, offshore safety and environmental regulations. |
Advanced equipment efficiency monitoring reducing energy baseline. Utility cost reduction through demand optimization. Automated SECR reporting for regulatory compliance and carbon reporting. |
| UAE and Middle East |
High ambient temperatures affecting cooling system loads and equipment efficiency. Water scarcity requiring energy-efficient desalination operations. Government targets for renewable energy adoption and carbon reduction. |
Local environmental regulations, UAE Vision 2030 sustainability commitments, renewable energy integration targets, water conservation requirements affecting energy planning. |
Temperature-adjusted efficiency models accounting for extreme heat conditions. Coordinated optimization of energy and water systems. Renewable energy integration support enabling solar and wind utilization. ESG reporting supporting government sustainability commitments. |
| Canada |
Cold climate operations affecting heating loads and equipment efficiency at low temperatures. Varied electricity pricing across provinces from different generation sources. Carbon pricing and emissions reduction requirements. |
Canadian carbon pricing, provincial electricity regulations varying by region, natural gas pricing volatility, environmental assessment requirements for new operations. |
Cold climate equipment efficiency models accounting for low-temperature operation. Provincial utility pricing optimization. Automated carbon pricing calculations and emissions reporting supporting federal compliance. |
| Europe |
EU Energy Efficiency Directive compliance with mandatory audits and reduction targets. Complex electricity markets with green tariff premiums. Methane reduction requirements from EU regulations. Winter heating demands creating seasonal optimization challenges. |
EU Energy Efficiency Directive (2012/27/EU and amendments), Methane Regulation (EU) 2023/850, Corporate Sustainability Reporting Directive, national carbon pricing schemes varying by country. |
EU EED compliant energy audits and monitoring. Methane emissions quantification and reduction verification. Multi-country reporting supporting EU sustainability directives. Seasonal optimization accounting for winter heating peaks and summer cooling loads. |
Energy Management Platform Competitive Comparison
Leading energy management platforms vary significantly in oil and gas specialization, real-time optimization capability, and equipment integration depth. iFactory delivers superior energy performance through industry-focused design and predictive intelligence competitors cannot match.
| Capability |
QAD Redzone |
Evocon |
Mingo |
L2L |
iFactory |
| AI Capability |
Rule-based energy optimization. No machine learning. Limited predictive capability. |
Basic ML for demand forecasting. Limited real-time optimization or efficiency prediction. |
Emerging ML capabilities. No equipment-specific efficiency modeling. Limited oil & gas specialization. |
Standard algorithms. Generic industrial energy templates. No oil and gas focus. |
Advanced ML predicting equipment degradation 30-60 days in advance. Real-time efficiency anomaly detection. Multi-system energy integration optimization unique to oil and gas. |
| Predictive Maintenance |
Fixed maintenance schedules. No equipment efficiency prediction. Reactive intervention only. |
Basic wear tracking. No energy-based degradation prediction. Limited forecast capability. |
Supply planning focus. No equipment-specific efficiency monitoring. Missing energy context. |
Condition-based triggers. Limited predictive remaining useful life modeling. No energy integration. |
Comprehensive equipment-specific efficiency prediction. Polytropic efficiency monitoring for compressors. Thermal trend analysis detecting fouling 35+ days advance. Energy-based maintenance prioritization. |
| SCADA Integration |
Partial SCADA connectivity. Limited real-time data integration. Batch data processing only. |
Basic process data access. Manual data configuration required. Limited historian integration. |
Standard system integration. No specialized oil & gas protocol support. Manual data mapping. |
Generic SCADA connection. No native oil and gas system support. Limited real-time capability. |
Deep integration with Honeywell, Yokogawa, Emerson, ABB DCS/SCADA. Native OPC-UA and Modbus support. Real-time streaming data enabling immediate optimization response. |
| Deployment Speed |
8-16 weeks. Significant customization required. Complex SCADA integration delays. |
6-10 weeks. Standard templates accelerate but limited customization flexibility. |
4-8 weeks. Faster deployment but generic energy platform without oil & gas depth. |
6-12 weeks. Integration complexity extends timeline. Limited energy-focused pre-built components. |
8 weeks fixed. Pre-built oil and gas energy templates. Proven rapid SCADA integration methodology. No timeline extension or scope creep. |
| Industry Fit |
Generic maintenance platform. No oil & gas-specific features. Missing upstream/midstream/downstream specialization. |
Industrial operations focus. Limited oil and gas expertise. No segment-specific optimization models. |
Supply planning specialization. Missing energy optimization or equipment efficiency focus. No oil & gas design. |
Procurement platform. No energy management specialization. Limited industrial operations knowledge. |
Oil and gas-first design addressing upstream drilling, midstream compression, downstream refining complexity. Segment-specific optimization strategies. Compressor efficiency monitoring. Facility energy integration. ESG emissions tracking. Multi-region compliance support unique to global oil and gas. |
Frequently Asked Questions
Does iFactory replace existing SCADA/DCS systems or integrate with them?
iFactory integrates with existing SCADA/DCS infrastructure via OPC-UA, Modbus, and native protocols without replacement. iFactory layer sits on top of existing systems providing energy optimization and predictive insights. Integration completed within 2 weeks.
Book a demo to see integration approach for your systems.
Which oil and gas equipment does iFactory monitor for energy efficiency?
iFactory monitors all major energy consumers: reciprocating and centrifugal compressors, electric motors, pumps, gas turbines, heat exchangers, steam systems, refrigeration units, crude distillation units, and fuel gas systems. Equipment-specific efficiency models account for design characteristics and operating conditions enabling precise degradation prediction.
How does iFactory handle multi-facility energy optimization for regional operations?
iFactory supports multi-facility deployments with centralized energy visibility across all locations while accommodating facility-specific energy profiles and optimization opportunities. Energy and equipment learning transfers between similar facilities accelerating deployment. Enterprise dashboards provide system-wide trending and best practice identification.
What ESG and emissions reporting does iFactory generate for corporate sustainability goals?
iFactory generates Scope 1 and Scope 2 emissions reports, energy efficiency improvement documentation, carbon reduction quantification, and greenhouse gas accounting supporting ESG reporting and corporate sustainability commitments. Automated calculations from energy consumption and fuel source carbon content provide auditable documentation.
How far in advance does iFactory predict equipment efficiency degradation enabling preventive maintenance?
iFactory detects equipment efficiency trends immediately and predicts degradation requiring maintenance 30-60 days in advance from polytropic efficiency trends, thermal signatures, and vibration patterns enabling scheduled maintenance during planned downtime. Advance warning prevents emergency interventions affecting production.
Can iFactory automate demand response execution or does it require manual operator approval?
iFactory can automate demand response execution based on utility pricing and grid demand signals optimizing operations for cost savings without operator intervention. System maintains production commitments while capturing maximum pricing optimization. Manual override always available for operational priorities.
Optimize Oil & Gas Energy Consumption. Deploy AI in 8 Weeks.
iFactory gives oil and gas operations teams The Complete AI Platform for Oil & Gas Operations enabling 28% energy cost reduction, equipment efficiency improvements, demand response automation, and ESG emissions tracking across upstream, midstream, and downstream operations within 8 weeks of deployment.
28% energy cost reduction through equipment efficiency and waste elimination
SCADA/DCS integration in under 2 weeks providing real-time optimization
30-60 day advance warning of equipment degradation enabling preventive maintenance
Automated demand response execution capturing utility pricing optimization