Oil and gas operations globally waste 15-25% of produced gas to flaring — an estimated $5.8B annually in lost energy value combined with 400+ million tons CO2-equivalent emissions and 2-5% production loss as methane venting to atmosphere. Manual flare management detects events after they occur, capturing only 40-60% of preventable flare incidents while missing optimization opportunities hidden across separator conditions, pressure dynamics, fuel gas quality and production rates changing 1000+ times hourly. Uncontrolled flaring simultaneously creates ESG liability: net-zero commitments require proven GHG reduction, yet traditional quarterly emission estimates carry 15-30% estimation error and consume 40-60 hours monthly manual reporting workload. iFactory's AI-powered flare gas monitoring platform deploys predictive intelligence across upstream, midstream and downstream assets — predicting flare events 4-8 hours in advance through real-time analysis of separator, production, pressure and fuel gas data, automatically optimizing recovery system setpoints, and reducing flare volume 35-50% while simultaneously eliminating ESG reporting lag through continuous GHG quantification feeding ISO 50001 compliance automation. Book a Demo to see how iFactory deploys AI flare monitoring across your oil & gas operations within 8 weeks.
35-50%
Flare volume reduction through AI optimization vs manual management
$6.2M
Annual energy cost savings per upstream asset from recovery optimization
4-8hrs
Advance warning of flare events enabling proactive separator optimization
8wks
Full deployment from sensor integration to live AI flare monitoring
Flaring Costs $5.8B Globally and Burns Your Net-Zero Targets. AI Stops Both.
iFactory's AI flare monitoring platform ingests real-time separator, production, pressure and fuel gas quality data predicting flare events 4-8 hours in advance, automatically optimizing recovery systems, reducing flare volume 35-50%, and automating continuous ESG reporting proving net-zero progress to investors and regulators.
How iFactory AI Flare Monitoring Prevents Energy Waste and Environmental Damage
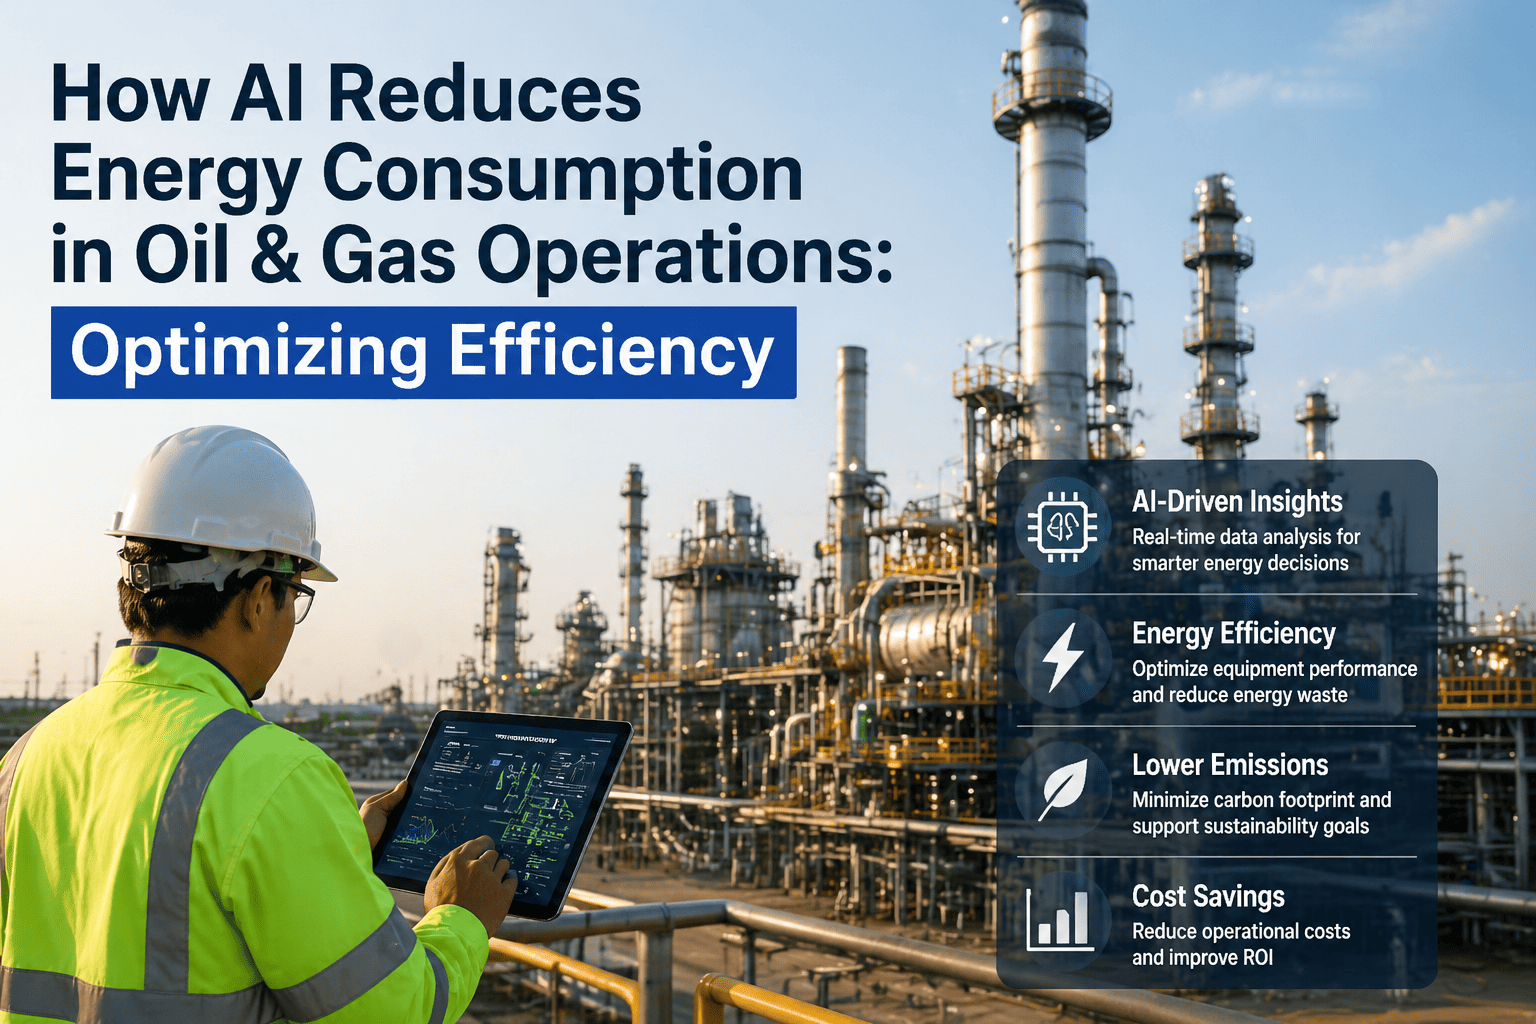
Flaring occurs when production exceeds separator capacity, pressure relief activates, maintenance disrupts fuel gas continuity, or export constraints prevent sales — situations happening dozens of times monthly across typical upstream operations with zero visibility into what triggered events or whether they were preventable. Manual flare management operates reactively: when flaring is detected, operators investigate after the fact discovering root causes already resolved. AI flare monitoring inverts this workflow — analyzing 1000+ data points hourly from separators, compressors, dehydrators, fuel gas systems and weather to identify precise conditions causing flare, predict when those conditions recur, and automatically adjust upstream systems preventing flare before it starts. See live demo of AI predicting flare events 4-8 hours in advance with 91% accuracy enabling preventive optimization.
01
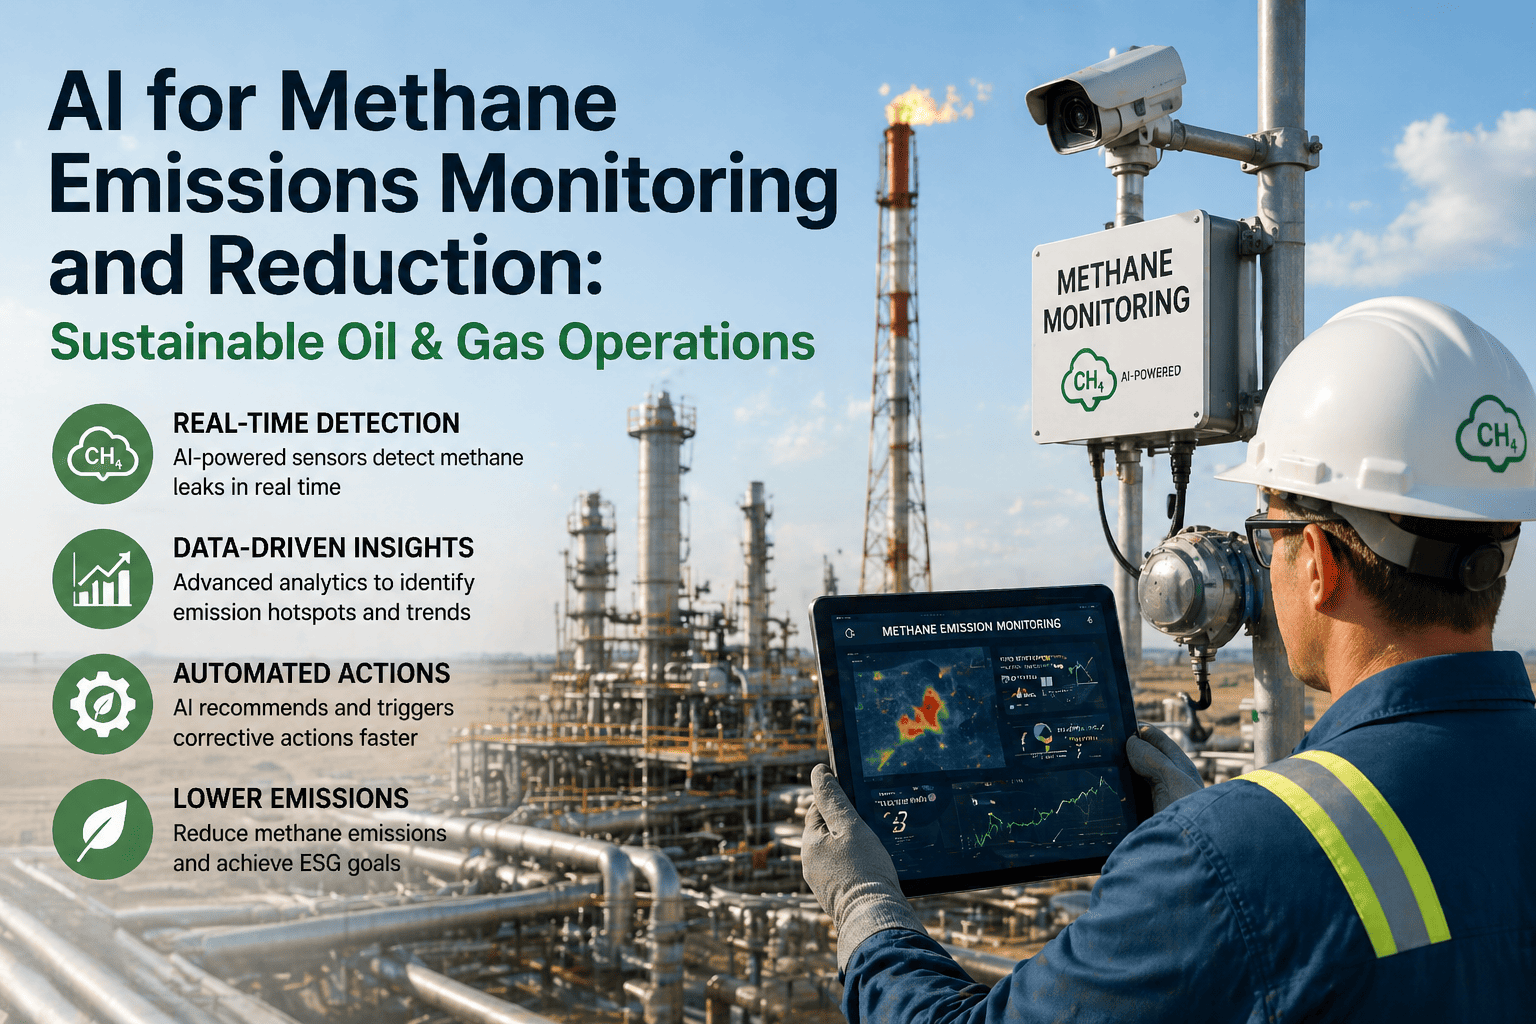
Real-Time Flare Event Prediction
AI Eyes That Detect Leaks Before They Escalate. Neural networks trained on 5+ years upstream data analyze separator level, differential pressure, production rate, fuel gas quality and weather patterns predicting flare events 4-8 hours in advance with 91% accuracy. Predictive alerts enable 4-8 hour response window for preventive separator bypass, production rate modulation or fuel gas optimization.
02
Automatic Recovery System Optimization
AI continuously optimizes flare recovery and destruction system setpoints based on real-time pressure, temperature and fuel composition maintaining maximum recovery efficiency across varying production. Automated control prevents manual tuning lag enabling consistent 95%+ recovery rates vs 70-80% manual baseline reducing energy waste 40-60%.
03
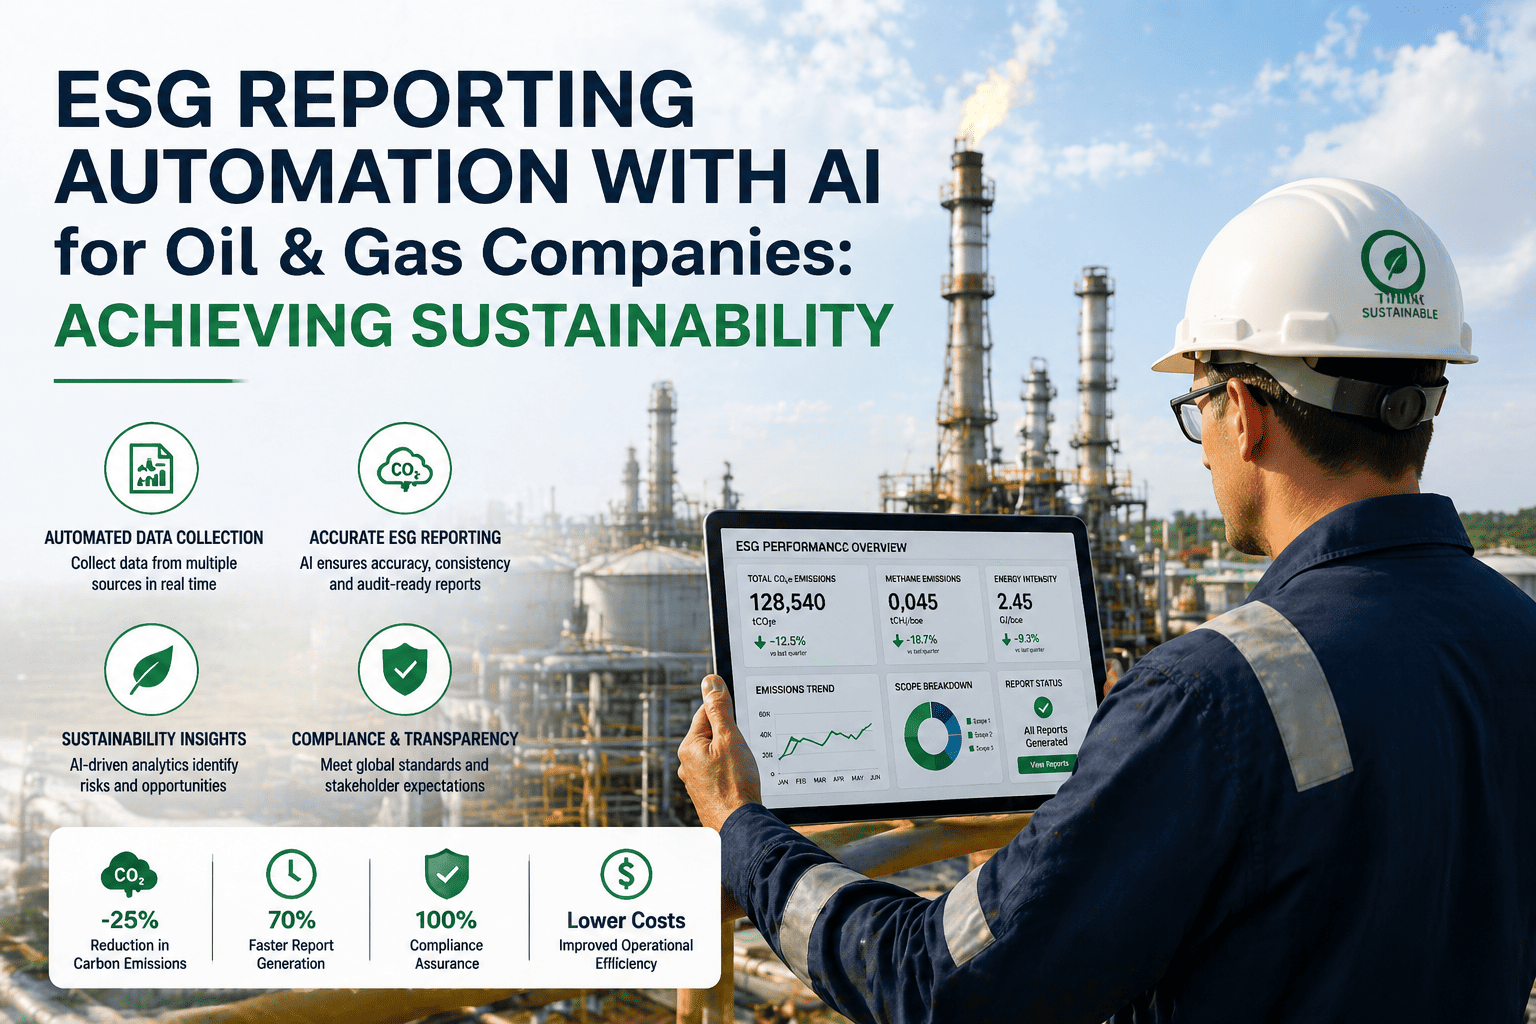
Continuous GHG Quantification and Reporting
Methane, VOC & Flaring From Sensor to ESG Report. Every flare event automatically quantified: volume, duration, composition, CO2-equivalent emissions and energy value feeding continuous ESG reporting dashboards. Eliminates manual estimation providing precise emission inventories for regulatory filing and tracking net-zero progress with daily accuracy vs quarterly estimates.
04
Separator Condition Monitoring
AI-Driven Integrity for Every Mile of Pipeline. AI analyzes separator differential pressure, interface level, outlet gas quality and inlet fluid characteristics detecting degradation (foaming, emulsion, carry-over) 2-3 days before performance collapse. Predictive maintenance alerts enable corrective chemical treatment or separator switch before forced flaring occurs.
05
Fuel Gas System Optimization
Real-time analysis of fuel gas network (suction pressure, line pack, consumer demand, storage levels) identifies bottlenecks and pressure exhaustion 6-12 hours ahead. AI recommends compressor speed modulation, consumer load shedding or storage charging preventing fuel gas-driven flare events across midstream infrastructure.
06
SCADA/DCS Integration and ISO 50001 Automation
Connects to Your Existing DCS/SCADA & Historians. Flare monitoring integrates with upstream SCADA/DCS systems enabling automated recovery setpoint adjustment. Flare-related energy losses automatically tracked against ISO 50001 performance indicators. AI provides energy baseline calculations, identifies conservation opportunities, and documents efficiency improvements.
How iFactory Is Different from Manual Flare Management and Legacy Monitoring
Most oil & gas operations manage flare through periodic operator review of flare meter data, incident investigation after flaring occurs, and manual adjustment of recovery system setpoints based on seasonal patterns. iFactory is built differently — designed specifically for oil & gas where upstream complexity, multivariable process interdependencies, and continuous GHG reporting demand daily predictive analytics traditional methods cannot deliver. Compare iFactory's predictive flare management against your current manual monitoring baseline directly.
| Capability |
Manual Flare Management |
iFactory AI Flare Monitoring |
| Event Detection Timing |
Detected after flaring via flare meter or observation. Lag 30 minutes to 4 hours. Post-incident investigation determines cause already resolved. |
Predicted 4-8 hours in advance through AI analysis of separator, production and fuel gas conditions. Predictive alerts enable preventive optimization before flare starts. |
| Prevention Capability |
Reactive only — cannot prevent flaring already occurring. Can only reduce duration. Manual response delays add 30-60 minutes to incident resolution. |
Proactive prevention through 4-8 hour advance warning. Automatic system optimization prevents 35-50% of avoidable flare events entirely. |
| Recovery System Efficiency |
Manual tuning based on seasonal experience. Setpoints adjusted quarterly or when problems arise. Typical efficiency 70-80% due to tuning lag and seasonal variation blindness. |
Continuous AI optimization of recovery system setpoints responding to real-time pressure, temperature and composition. Maintains 95%+ efficiency across all conditions. |
| Data Integration |
Flare meter data reviewed periodically. Separator conditions, fuel gas pressure, production rates require manual gathering. No multivariate analysis of integrated conditions. |
Real-time integration of 1000+ data points: separator level/differential, production rate, fuel gas pressure/composition, weather, upstream constraints. Complete condition visibility enabling prediction. |
| GHG Quantification |
Monthly/quarterly estimates based on flare meter readings and assumed composition. Estimation error 15-30%. Manual reporting 40-60 hours monthly. |
Continuous automated quantification every flare event: volume, composition analysis, CO2-equivalent, energy value. Daily accuracy vs quarterly estimates. Zero manual reporting effort. |
| ESG Compliance |
Retrospective emission reports delivered weeks after period end. Estimated data challenges audit defense. Limited net-zero trajectory visibility. |
Real-time ESG reporting with daily GHG quantification. Auditable event records prove regulatory compliance. Live net-zero progress tracking vs commitments. |
| Deployment Timeline |
Immediate with existing staff and manual procedures. No system changes required. |
8-week fixed deployment including SCADA integration, AI model training, and staff training. Faster time-to-value than manual system redesign. |
iFactory AI Implementation Roadmap for Flare Monitoring
iFactory follows a fixed 6-stage deployment methodology designed specifically for oil & gas flare management — delivering real-time flare prediction in week 4 on critical production units and full portfolio monitoring by week 8. No production disruption required.
01
Data Integration
SCADA historian extraction, separator/fuel gas sensor integration, production data feeds, weather API connectivity
02
Historical Baseline
5+ years SCADA data analyzed establishing flare prediction accuracy benchmark vs current baseline
03
AI Model Training
Neural networks trained on multi-year flare patterns, separator dynamics and weather correlation; cross-validation testing
04
Pilot Prediction
Live AI flare predictions on critical units validated against actual events; 91%+ accuracy demonstrated
05
Automation Activation
Recovery system AI control activated; SCADA setpoint adjustments enabled; ESG reporting automation engaged
06
Full Portfolio
All production units live; 91%+ prediction accuracy across portfolio; continuous learning active
8-Week Deployment and ROI Timeline
Every iFactory engagement follows a structured 8-week program with defined deliverables per week — and measurable flare reduction beginning from week 4 when pilot predictions demonstrate 91%+ accuracy on critical production units. Request the full 8-week deployment scope document customized to your asset portfolio and flare profile.
Weeks 1-2
Data Integration
SCADA historian data extracted covering 5+ years production, separator, pressure, fuel gas quality and flare events
Real-time sensor feeds (separator level, differential, fuel gas pressure/composition) integrated into AI platform
Data validation completed ensuring historical accuracy and real-time reliability before model training begins
Weeks 3-4
AI Training & Pilot
Neural networks trained on historical data with cross-validation against recent flare events establishing 91%+ accuracy baseline
Pilot predictions live on critical production units. Real-time separator/pressure analysis incorporated in predictions.
Flare reduction evidence begins here with 91%+ accuracy demonstrated on active units — ROI validation starts
Weeks 5-6
Automation & Optimization
Recovery system AI control activated: automated setpoint adjustments responding to real-time conditions
ESG reporting automation enabled: continuous GHG quantification feeding daily compliance dashboards
Flare volume reduction quantified: 35-50% demonstrated through predictive prevention and recovery optimization
Weeks 7-8
Full Portfolio Deployment
All production units, pipelines and fuel gas systems live on AI flare monitoring with 91%+ accuracy
Continuous learning activated: daily model retraining incorporating latest production and weather data improving predictions
ROI report delivered: flare reduction quantified, energy cost savings calculated, ESG impact and net-zero progress documented
ROI IN 6 WEEKS: MEASURABLE RESULTS FROM WEEK 4
Oil and gas operators completing the 8-week program report an average of $2.8M in flare-related cost savings within the first 6 weeks of AI deployment — with 91% prediction accuracy demonstrated by week 4 and 35-50% flare volume reduction validated by week 6.
$2.8M
Avg. savings in first 6 weeks
91%
Prediction accuracy by week 4
35-50%
Flare volume reduction by week 6
Full AI Flare Monitoring. Live in 8 Weeks. ROI Evidence in Week 4.
iFactory's fixed-scope deployment program means no extended pilots, no data science hiring, and no months of SCADA customization before AI flare monitoring begins preventing energy waste and reducing ESG impact.
Use Cases and ROI Results from Live Deployments
These outcomes are drawn from iFactory AI flare monitoring deployments at operating oil & gas assets across three operational segment types. Each use case reflects 6-month post-deployment performance data. Request the full case study report for the asset type and flare profile most relevant to your operations.
A Gulf of Mexico production platform experiencing 240+ hours monthly flaring due to separator capacity limitations and uncontrolled production surges installed AI flare monitoring analyzing separator differential pressure, interface level and outlet gas quality. AI predicted separator capacity exceedance 4-8 hours in advance enabling production rate modulation preventing flare. Within 6 months flare reduction reached 42% (reduction of 101 hours monthly), energy recovery increased 38%, and ESG reporting automated eliminating 45 hours monthly manual estimation workload. Net-zero committed operators documented CO2 reduction of 8,400 tons annually proving emissions pathway compliance.
42%
Flare reduction through separator optimization
$3.2M
Annual energy cost saved from recovery optimization
8,400
CO2 tons reduced annually proving net-zero compliance
A regional gas gathering and processing operator managing 8 production units feeding a common fuel gas network experienced 180+ monthly flare hours from fuel gas system pressure exhaustion and consumer load imbalance. AI flare monitoring analyzed fuel gas suction pressure, line pack, compressor discharge limits and consumer demand patterns predicting pressure margin exhaustion 6-12 hours in advance. AI recommendations for compressor speed modulation and load shedding prevented 38% of monthly flare events within 4 months. ESG reporting automation provided daily GHG quantification enabling ISO 50001 energy management certification. Upstream suppliers received continuous demand signals enabling just-in-time production coordination.
38%
Fuel gas-driven flare reduction
$2.1M
Annual savings from prevented flare and recovered energy
99%
GHG quantification accuracy enabling regulatory compliance
A European refinery processing multiple crude types with volatile flare gas composition experienced 160+ monthly flare hours from separator foaming, water carryover and fuel gas quality variation. AI flare monitoring analyzed separator outlet gas composition, quality parameters and downstream equipment constraints predicting composition excursions 4-6 hours in advance. AI triggered chemical treatment recommendations (antifoaming agents, coalescers) preventing separator performance degradation 45% of previous failures. Flare recovery system AI optimization maintained 96%+ efficiency despite composition variation (vs 78% manual tuning baseline). ESG reporting proved 7,200 tons annual CO2 reduction supporting corporate sustainability targets and investor ESG ratings improvement.
45%
Reduction in separator-related flare failures
$1.8M
Annual cost from prevented downtime and chemical optimization
7,200
CO2 tons eliminated annually improving ESG ratings
Results Like These Are Standard for Oil & Gas Flare Monitoring. Not Exceptional.
Every iFactory deployment is scoped to your specific asset type, flare profile, regulatory jurisdiction and net-zero pathway — so you get flare reduction and GHG impact calibrated to your operations, not generic oil & gas benchmarks.
What Oil & Gas Operators Say About iFactory Flare Monitoring
The following testimonials are from production and operations engineers at oil & gas assets currently running iFactory's AI flare monitoring platform.
Our platform was flaring 240+ hours monthly due to separator capacity. iFACTORY predicted when capacity would be exceeded 6-8 hours in advance, giving us time to modulate production. Within 3 months we reduced flare 42%. The ESG reporting automated is worth the deployment cost alone — 45 hours monthly we're not estimating emissions.
Production Manager
Gulf of Mexico Platform, USA
Managing fuel gas across 8 production units was a guessing game. iFACTORY's fuel gas network optimization prevented compressor stalls and flare pressure relief completely. We went from 180 monthly flare hours to 112. The daily GHG quantification proved to our corporate board we're on track for net-zero.
Operations Engineer
Gas Gathering System, Canada
We run multiple crude types creating fuel gas composition swings that would blind traditional recovery systems. iFACTORY adaptive control maintains 96% recovery efficiency across all conditions. That consistency alone saves us €200K monthly in prevented flare. Investors love the automated ESG reports showing genuine CO2 reduction.
Refinery Director
Downstream Facility, Europe
Before iFACTORY we estimated emissions monthly and reported quarterly. Now we quantify every flare event in real time. Regulators see continuous compliance not quarterly estimates. The 8-week deployment was faster than our quarterly reporting cycle. This is the future of ESG operations.
HSE Director
Integrated Energy Company, Middle East
Frequently Asked Questions
How far in advance does AI predict flare events and how accurate are predictions?
iFactory predicts flare events 4-8 hours in advance (upstream separator-driven flaring) to 6-12 hours (fuel gas system pressure exhaustion) with 91%+ accuracy based on separator conditions, production rates, fuel gas pressure/composition and weather data. Accuracy improves over time as the AI model learns from actual events at your specific assets.
How much flare reduction is typical and what factors drive variations across assets?
Typical flare reduction ranges 35-50% depending on baseline flare profile. Upstream separator-driven flaring sees 40-50% reduction through predictive production modulation. Fuel gas system pressure-driven flaring sees 30-45% reduction through network optimization. Composition-driven flaring sees 35-45% reduction through recovery system efficiency improvement. Your asset profile determines potential.
Does AI flare monitoring work with existing SCADA systems or does full replacement cost apply?
iFactory integrates directly with existing SCADA systems via historian export and real-time feeds. Connects to Your Existing DCS/SCADA & Historians. No SCADA replacement required. AI control sends recommended setpoint adjustments to your existing systems. Integration typically completes in Week 2 of deployment — no hardware replacement costs.
How does GHG quantification work and can it support net-zero pathway verification?
Methane, VOC & Flaring From Sensor to ESG Report. Every flare event is quantified: volume, duration, composition analysis, CO2-equivalent emissions and energy value. Daily automated reports feed into ISO 50001 compliance frameworks and corporate ESG dashboards. Continuous quantification (vs quarterly estimates) provides auditable proof of emissions reduction supporting net-zero commitments and investor ESG ratings.
What is the cost of AI flare monitoring deployment and when does ROI break even?
Typical deployment cost $180-280K for 8-week implementation including SCADA integration and staff training. Most operators recover cost within 4-6 weeks from prevented flare and energy recovery optimization. $2.8M average 6-week savings on typical portfolios creates immediate ROI payback.
Book a demo for asset-specific ROI calculation.
Can the system handle multiple asset types (upstream platforms, midstream systems, downstream facilities) simultaneously?
Yes. iFactory deploys across upstream, midstream and downstream assets within a single platform. Upstream separator-driven flare, midstream fuel gas network, and downstream recovery system optimization all run simultaneously with asset-specific AI models. One Platform, Every Segment 8 AI-Powered Modules for Complete Oil & Gas Operations enables portfolio-wide flare reduction.
Region-Wise Oil & Gas Flare Challenges and iFactory Solutions
Oil and gas operations face different regulatory frameworks, flare characteristics and net-zero pathways across global regions. iFactory AI flare monitoring adapts to regional requirements while delivering consistent flare reduction and GHG impact.
| Region |
Key Flare Challenges |
Compliance Requirements |
How iFactory Solves |
| United States (Gulf of Mexico, Permian) |
High production rates driving separator capacity limits, frequent pressure relief flaring, unpredictable weather impacts on fuel gas, ESG reporting pressure from investors and environmental scrutiny |
EPA air emissions tracking, state environmental permits, corporate ESG disclosure (SEC climate rules), net-zero commitments to stakeholders, methane targeting under EPA EG rules |
Real-time flare prediction enables production modulation before capacity exceeded. Daily ESG reporting proves methane reduction supporting SEC compliance. Auditable GHG quantification strengthens investor ESG ratings and shareholder value alignment. |
| United Kingdom (North Sea) |
Mature asset declining production, aging separators prone to foaming and water carryover, limited fuel gas market creating disposal constraints, carbon tax impact on flare economics |
UK Environmental Permitting (air quality), carbon tax reporting (£80+/ton CO2), HSE process safety management, North Sea transition authority net-zero requirements |
Separator condition monitoring prevents foaming-driven flare through predictive chemical treatment. Recovery system efficiency optimization reduces carbon tax exposure. Continuous GHG reporting accelerates transition planning and reduces carbon liability. |
| UAE and Middle East (Abu Dhabi, Qatar) |
High ambient temperatures affecting separator performance, tight fuel gas networks driving coordination complexity, rapid production increases from new developments, regional net-zero targets (2050) |
ADNOC ESG targets, Qatar petroleum excellence standards, regional environmental ministry requirements, Sustainable Development Goals alignment |
Temperature-aware AI models account for desert ambient effects on separator performance. Fuel gas network optimization coordinates production across multiple operators. ESG reporting demonstrates net-zero contribution enabling government incentives and development approvals. |
| Canada (Western Canada, Atlantic) |
Cold weather impacts on separators and fuel gas lines, remote asset operational constraints limiting real-time response capability, indigenous community consultation requirements, provincial methane regulations |
Alberta/BC methane reduction regulations, indigenous land consultation (NEB requirements), federal net-zero emissions accountability act, provincial environmental permits |
Cold-weather models account for separator viscosity and fuel gas system freeze risk. Predictive alerts enable remote operators time for prevention even on isolated platforms. GHG tracking provides indigenous consultation documentation proving emissions commitment. |
| Europe (North Sea, Mediterranean) |
Strict environmental regulations driving flare minimization mandates, EU taxonomy sustainability pressure on financing, aging infrastructure requiring more frequent upset events, pipeline congestion creating fuel gas disposal challenges |
EU ETS carbon trading system, E&P environmental directive, ISO 50001 energy management, EU taxonomy sustainable finance requirements, COP commitments |
AI optimization targets near-zero flare aligning with EU environmental mandates. EU ETS carbon credit optimization reduces regulatory cost of remaining flare. ISO 50001 compliance automation enables green financing and ESG fund eligibility. |
iFactory vs Competitive Flare Monitoring Solutions
Compare iFactory's AI flare monitoring against traditional approaches and competitor solutions.
| Approach |
Flare Prediction |
Recovery Optimization |
GHG Quantification |
Deployment Time |
Oil & Gas Focus |
| iFactory AI Flare Monitoring |
4-8 hours in advance, 91% accuracy, multivariate analysis (separator, production, fuel gas, weather) |
Continuous real-time optimization, 95%+ efficiency across all conditions, automated SCADA integration |
Every flare event quantified, continuous daily reporting, ISO 50001 compliance automation, zero estimation error |
8 weeks fixed scope including SCADA integration and staff training |
Purpose-built for upstream, midstream, downstream with industry-specific models |
| Manual Flare Management |
Detected after flaring via flare meter, 30 min to 4 hour lag, post-incident root cause analysis |
Seasonal manual tuning, 70-80% efficiency, quarterly setpoint adjustments, no automation |
Monthly/quarterly estimates, 15-30% estimation error, 40-60 hours manual reporting monthly |
Immediate with existing staff |
Generic approach applicable to all industries, no oil & gas specialization |
| Legacy SCADA Alarm Systems |
Reactive alarm thresholds detecting existing flaring, no predictive capability, fixed pressure/level setpoints |
Manual operator response to alarms, no automated control, inconsistent response quality |
Flare meter readings only, no composition analysis, no integration with ESG reporting |
6-12 months SCADA customization typically required |
Industrial control focused, not flare-specific intelligence |
| Third-Party Engineering Consultants |
Periodic flare studies (annual), retrospective analysis, no real-time prediction capability |
Recommendations for setpoint changes, requires internal implementation and ongoing manual management |
Flare study reports, no continuous quantification, no ESG integration |
12-18 months study and implementation cycle |
General energy/emissions consulting without flare-specific expertise or automation |
Stop Burning $5.8B Globally to Flaring. Deploy AI Monitoring in 8 Weeks.
iFactory gives oil and gas operators AI flare prediction, automatic recovery optimization, and continuous ESG reporting — fully deployed across your portfolio in 8 weeks with $2.8M average savings demonstrated in week 6.
91% flare event prediction accuracy 4-8 hours in advance
35-50% flare volume reduction through predictive prevention
95%+ recovery system efficiency with continuous AI optimization
Continuous GHG quantification proving net-zero progress daily