Every hour your MRI sits idle costs your hospital $10,827. Every unplanned CT failure bleeds $6,200 from your operating margin. Equipment downtime is not a maintenance problem—it is a silent revenue hemorrhage that most CFOs only measure in hindsight, long after the damage is done. This guide quantifies the true financial exposure and shows how iFactory's Analytics Dashboard transforms reactive loss into proactive, protected revenue.
Is Equipment Downtime Draining Your Operating Margin?
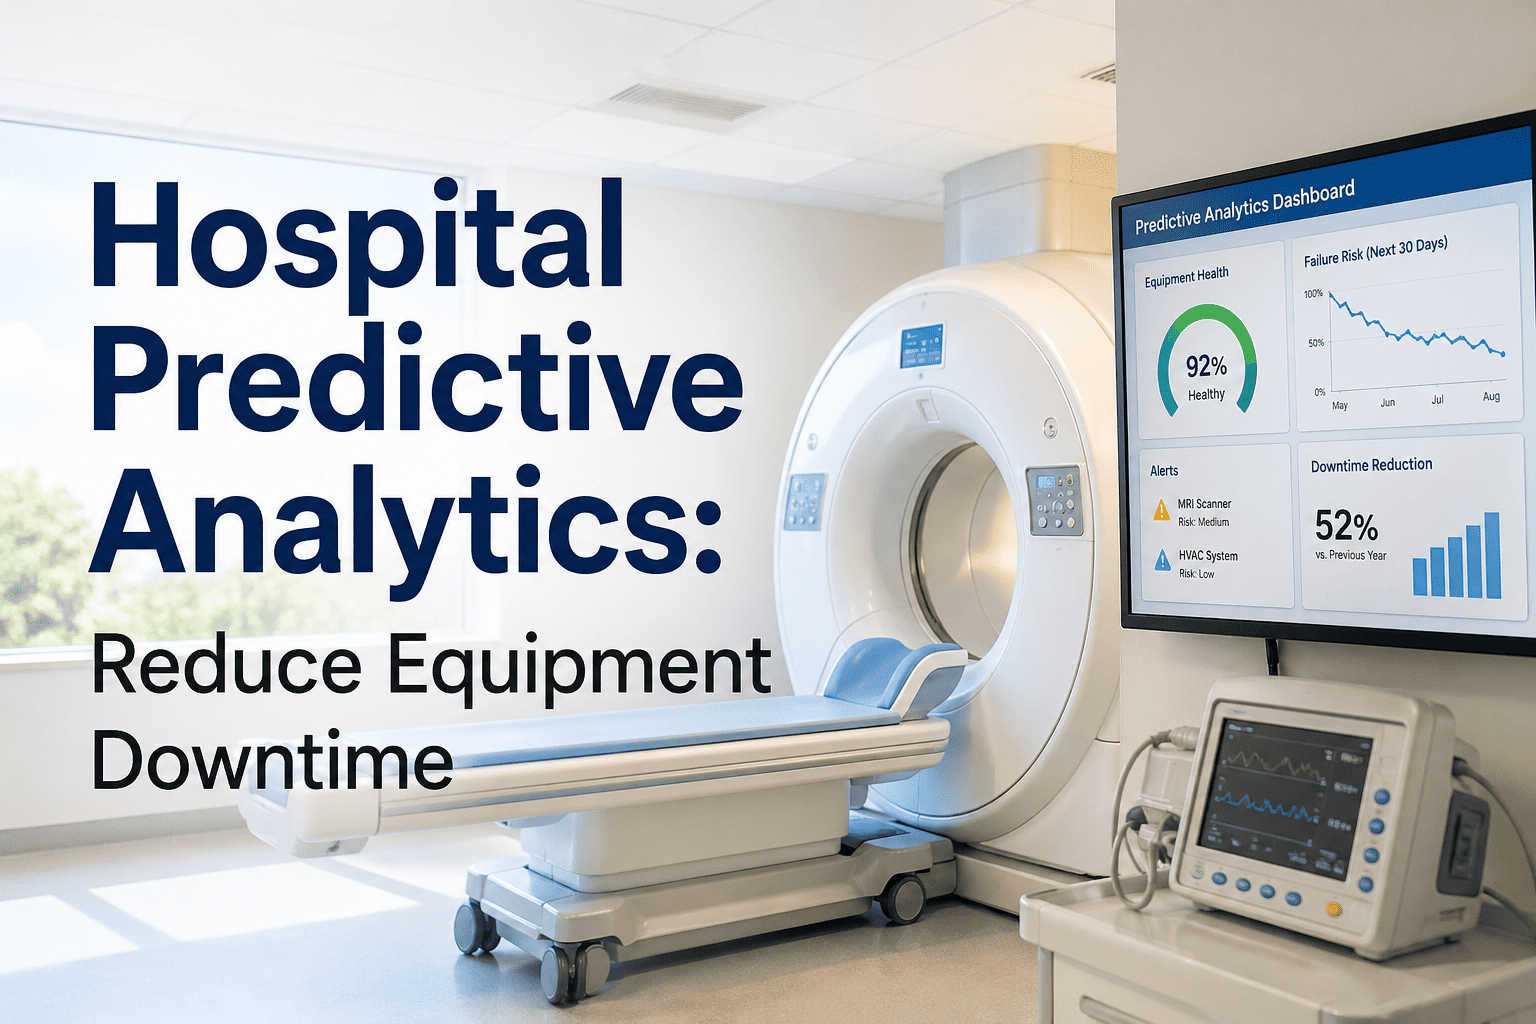
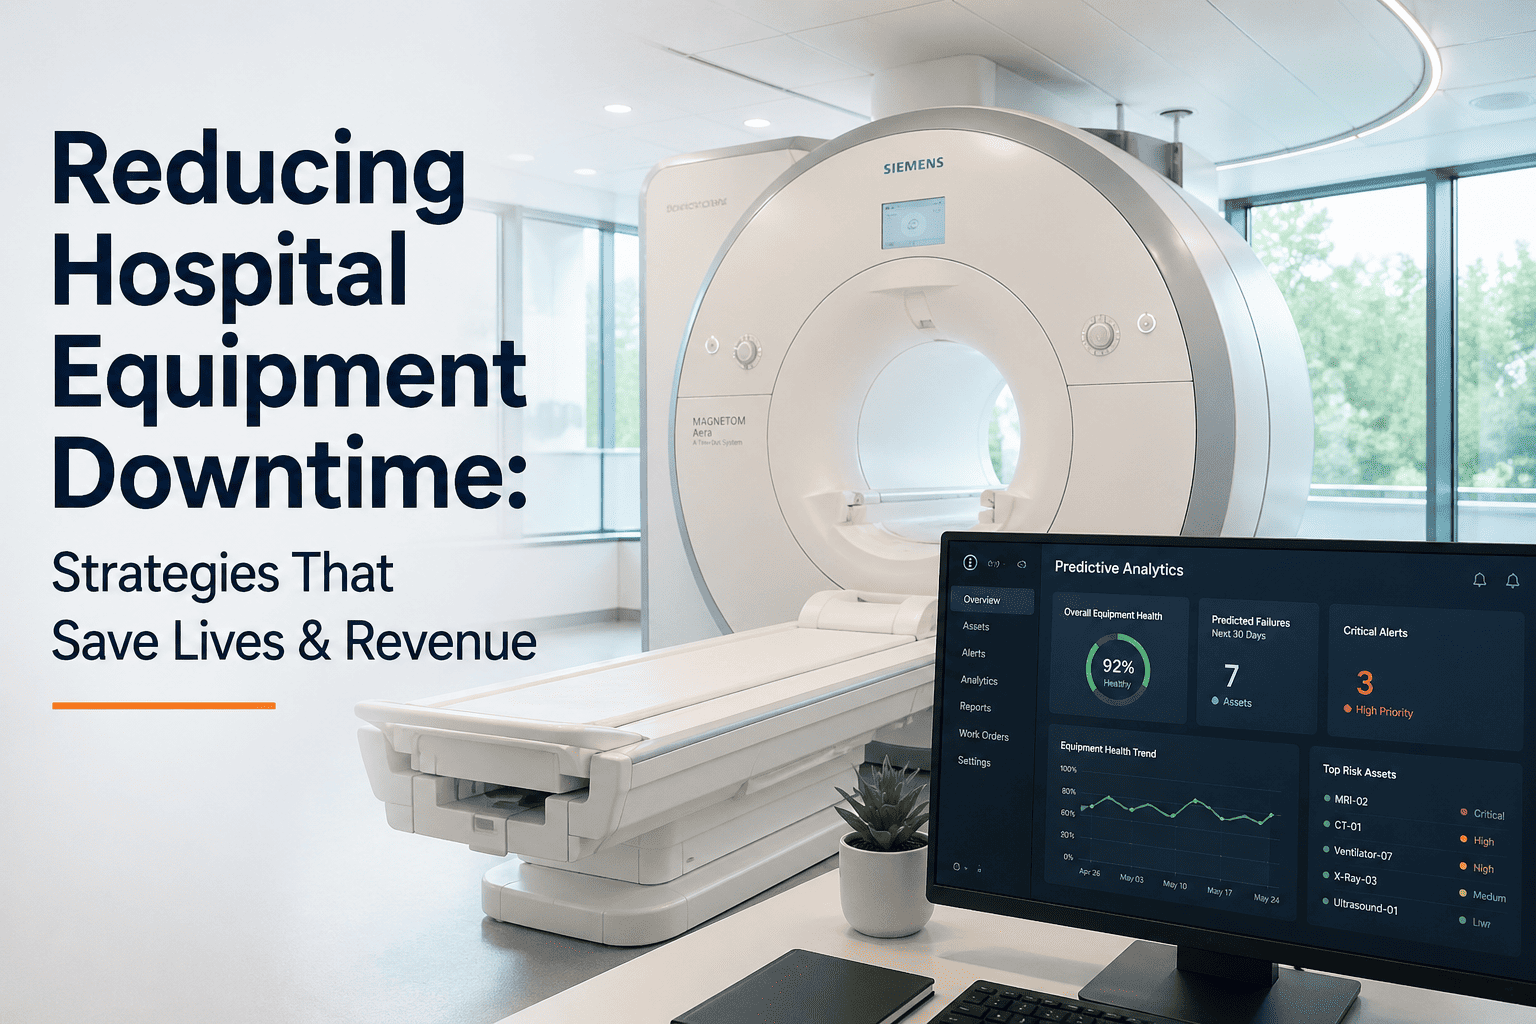
iFactory's Analytics Dashboard gives CFOs real-time visibility into equipment performance, revenue impact, and maintenance ROI—before the next failure hits.
The Revenue Numbers Every Healthcare CFO Must Know
Unplanned equipment downtime is among the most financially destructive—and preventable—events in clinical operations. The data is unambiguous:
Where the Revenue Is Actually Leaking
Equipment downtime creates a multi-layered financial cascade that extends far beyond the obvious lost-scan revenue. CFOs who only measure direct loss are underestimating true exposure by 40–60%.
Direct Revenue Loss
- Cancelled or rescheduled procedures
- Unrealized imaging and diagnostic revenue
- Surgical case postponements tied to equipment
- Downstream specialist referral revenue lost
Operational Cost Surge
- Emergency service call premiums (2–4× standard rates)
- Unplanned parts procurement at spot pricing
- Overtime staffing during recovery windows
- Expedited vendor SLA escalations
Reputational & Patient Risk
- Patient diversion to competing facilities
- Delayed diagnoses with liability exposure
- CMS quality metric degradation
- Physician satisfaction erosion and attrition
The Operational Gap: Where You Are vs. Where You Must Be
Most hospitals are still operating on reactive maintenance models designed for a prior era. The table below maps the financial and operational gap between legacy friction and iFactory-optimized performance.
| Dimension | Legacy Friction | iFactory Optimized Excellence | CFO Impact |
|---|---|---|---|
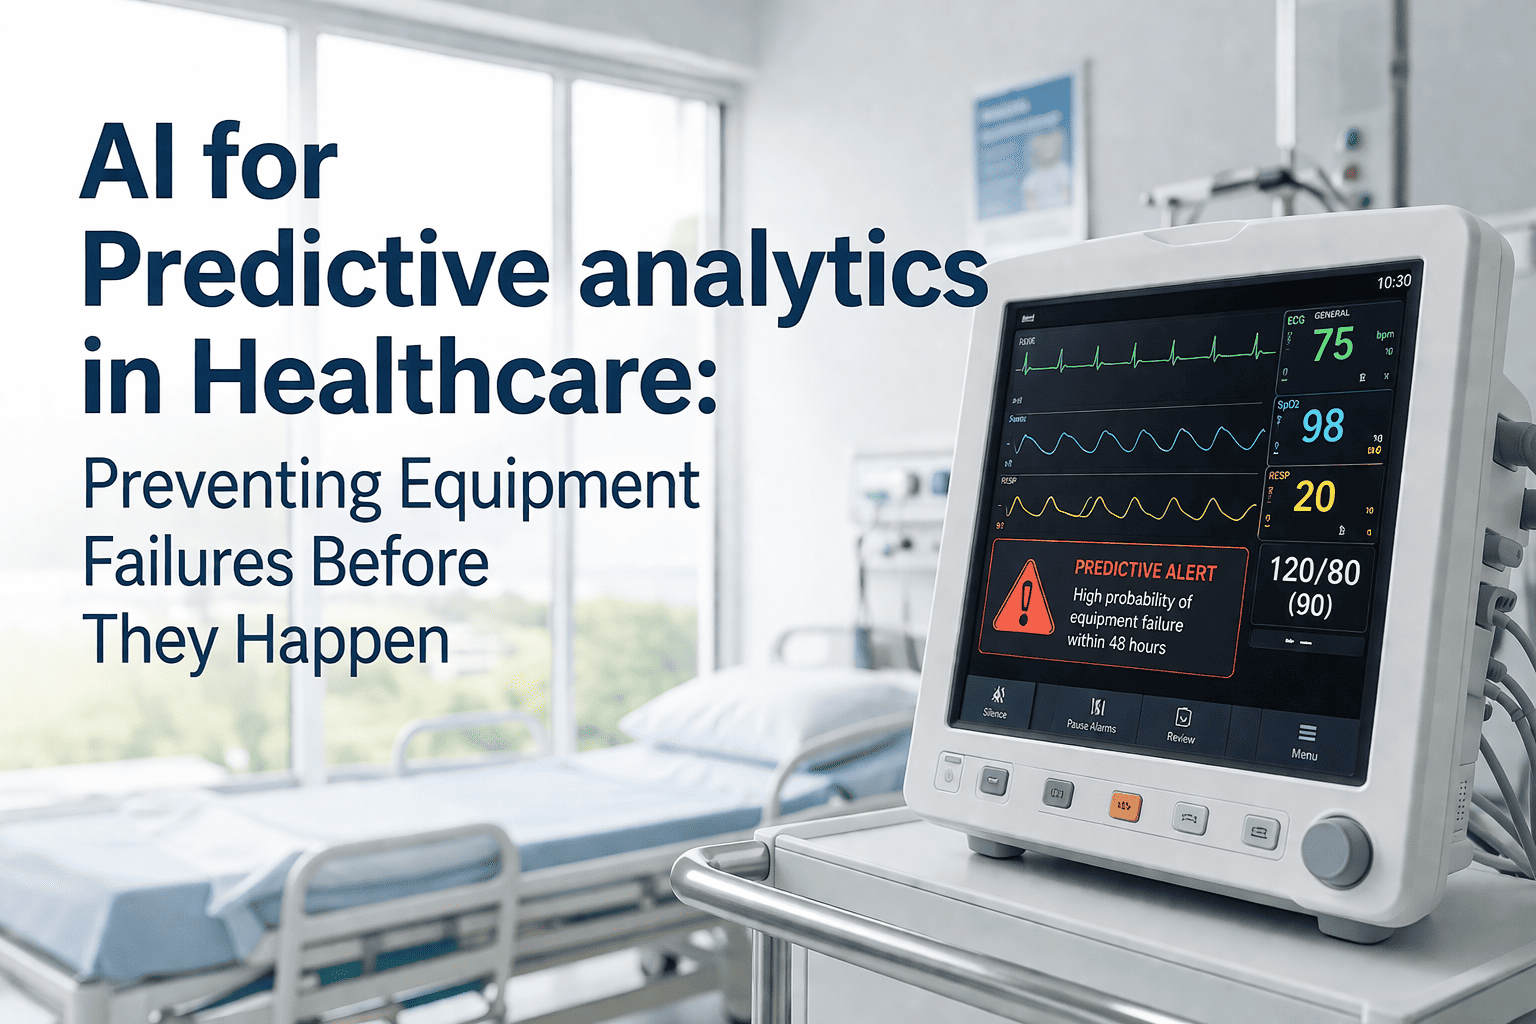
| Failure Detection | Post-failure discovery by clinical staff | AI anomaly alerts 72+ hours in advance | Eliminate emergency repair premiums |
| Downtime Visibility | Manual spreadsheets, delayed reporting | Real-time dashboard with revenue-impact mapping | Instant CFO-ready financial data |
| Maintenance Scheduling | Fixed calendar intervals, regardless of usage | Usage-based, predictive PM scheduling | Reduce over-maintenance costs by 28% |
| Parts Management | Reactive procurement at premium pricing | AI-driven inventory with pre-positioned parts | Cut parts cost variance by 35% |
| ROI Reporting | Annual capex reviews without utilization data | Continuous equipment ROI scoring per asset | Data-driven replacement decisions |
| Staff Workflow | Technicians reactive, high-pressure, burned out | Proactive task queues with priority scoring | Reduce overtime and staff turnover costs |
How iFactory Protects Revenue at the Clinical Level
Financial outcomes are the result of clinical operational excellence. iFactory's Analytics Dashboard directly addresses the three core drivers of downtime-related revenue loss.
Staff Burnout Reduction
- Automated work order generation eliminates manual triage
- Priority-scored task queues reduce decision fatigue
- Mobile-first technician interface cuts documentation time by 60%
- Proactive schedules replace reactive fire-fighting
Patient Throughput Gains
- Equipment uptime targets exceed 98.5% across monitored fleets
- Procedure scheduling aligned to real-time equipment availability
- Zero unplanned same-day cancellations due to equipment failure
- Faster patient cycle times improve satisfaction scores
CFO Revenue Assurance
- Per-asset revenue-at-risk scores updated in real time
- Downtime cost automatically calculated and escalated
- Board-ready reporting with ROI benchmarking by department
- Capital replacement forecasts with utilization-weighted scoring
Stop Measuring Downtime. Start Preventing It.
iFactory's Analytics Dashboard gives healthcare CFOs the real-time intelligence to protect revenue, reduce risk, and make data-driven capital decisions across every clinical asset.
How to Present Equipment Investment to Your Board
CFOs face a persistent challenge: justifying preventive technology investment against a board that only sees capital expenditure, not the invisible cost of inaction. iFactory reframes this conversation with quantified data.
- Calculate current annual downtime hours by asset class
- Apply revenue-per-hour benchmark to each device category
- Add emergency maintenance premium costs (2–4× base rate)
- Include staff overtime and patient diversion costs
- Most facilities achieve full payback within 8–14 months
- Year 1: Emergency repair cost elimination drives immediate savings
- Year 2: Predictive scheduling optimizes capital replacement cycles
- Year 3+: Portfolio-wide uptime gains compound annual margin
- Regulatory compliance audit trails reduce liability exposure
- Joint Commission readiness maintained continuously, not episodically
- Patient safety incidents tied to equipment failure are eliminated
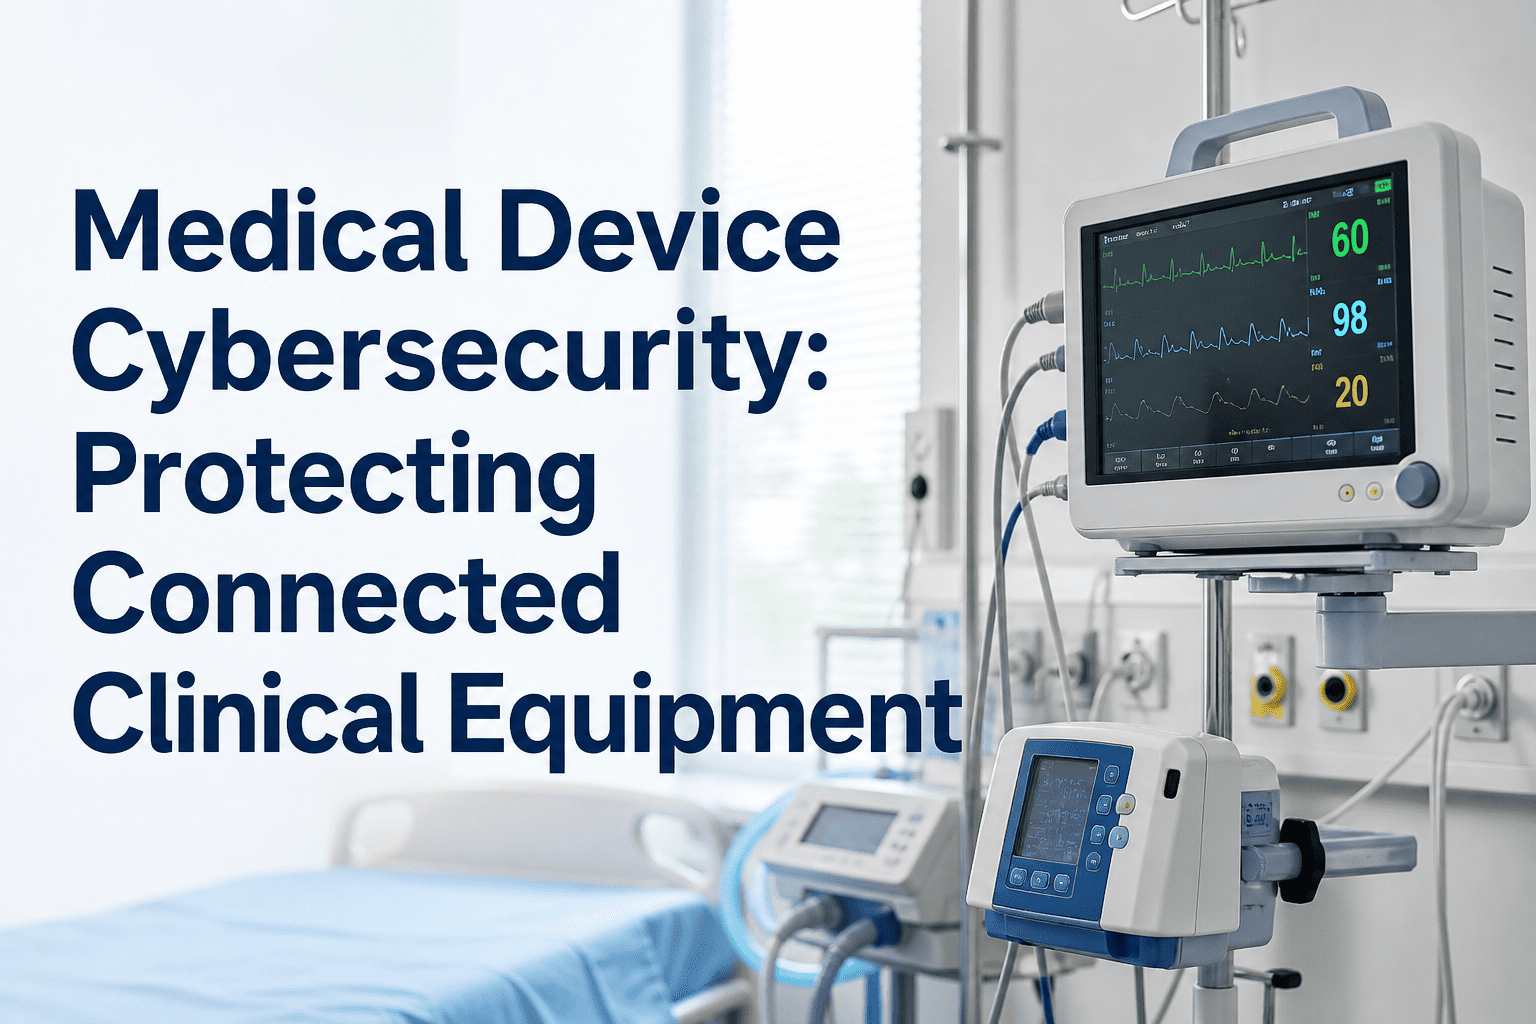
- Cybersecurity for connected medical devices monitored 24/7
CFO Questions on Equipment Downtime & ROI
How quickly can we quantify our current downtime revenue loss?
iFactory's Operational Gap Audit delivers a facility-specific revenue loss report within 10 business days, using your actual equipment data and procedure volumes—no estimates or industry averages.
Does the Analytics Dashboard integrate with our existing CMMS and EHR systems?
Yes. The platform uses vendor-neutral APIs to connect with leading CMMS platforms, Epic, Cerner, and Meditech environments. No rip-and-replace—your existing data becomes more powerful.
What is the typical implementation timeline?
Core dashboard functionality is live within 30 days. Predictive AI models reach full accuracy after 60–90 days of equipment data ingestion, aligning with most Q1 or Q3 budget cycles.
How is patient data and equipment telemetry secured?
All data is stored in HIPAA-compliant, AES-256 encrypted environments. Every system interaction creates an immutable audit log, meeting Joint Commission and CMS documentation standards. Book a Demo to review our security architecture.
Book a Demo or Request Your Operational Gap Audit
Discover exactly how much equipment downtime is costing your facility—and build a board-ready case for the investment that stops it.

.png)