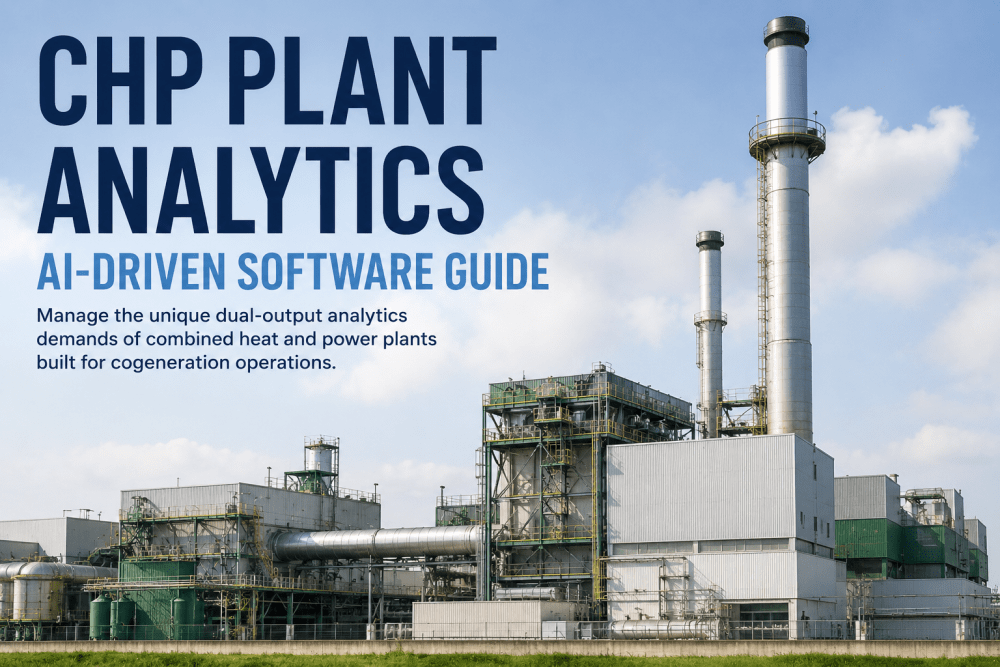
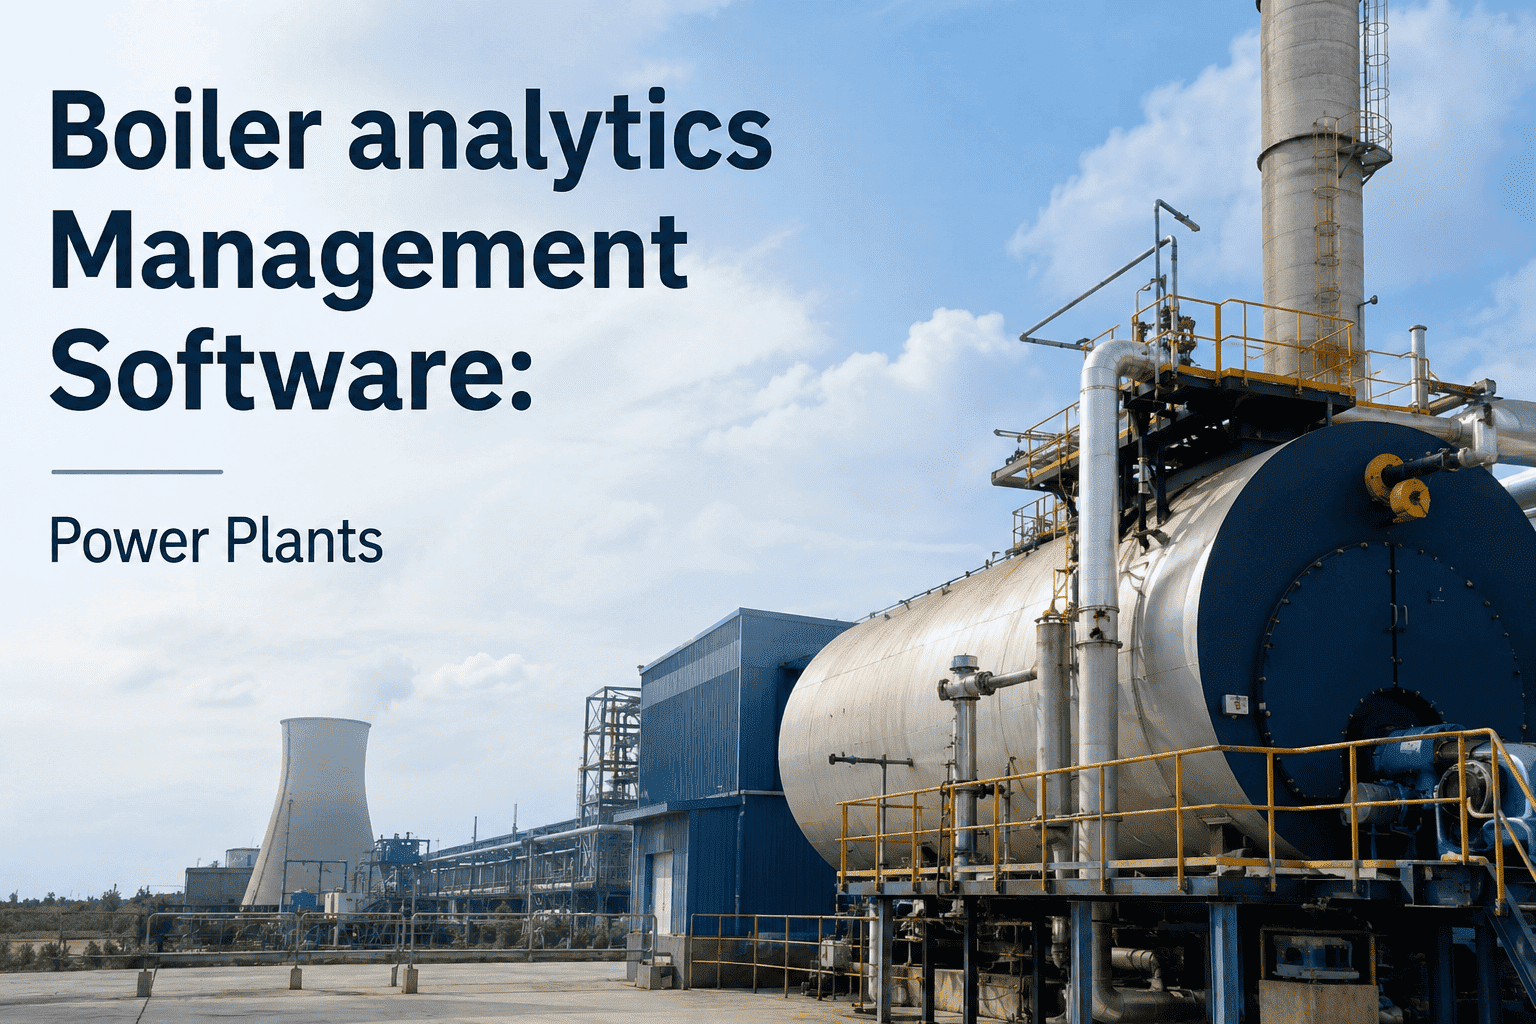
Combined heat and power plants operate under a performance logic that standard power generation analytics software was never designed to handle. A conventional CMMS tracks assets. A conventional energy management system tracks output. But a CHP facility generates value simultaneously from two output streams — electrical power and recovered thermal energy — and the analytics program that manages it needs to track asset health, performance ratios, and reliability metrics across both streams at same time. When an absorption chiller underperforms, it affects heat recovery efficiency, which affects the heat-to-power ratio, which affects the economic dispatch decision for the prime mover, which affects overall plant utilization factor. These are not independent events. They are interconnected performance variables that require an AI-driven analytics layer capable of tracking the dual-output thermal-electric performance relationship continuously — not just recording individual asset failures after they occur. iFactory's AI-driven analytics platform delivers that layer: an analytics environment purpose-configured for cogeneration operations that tracks prime mover health alongside heat recovery system condition, monitors heat rate and power-to-heat ratio trends simultaneously, and connects performance degradation signals to maintenance work orders before they affect either output stream's availability. For a CHP analytics configuration assessment, Book a demo .
AI-driven · CHP Analytics · Cogeneration Management
CHP Plant Analytics AI-Driven: Track Dual-Output Performance Across Both Heat Recovery and Power Generation Assets.
iFactory's AI-driven analytics platform manages the unique dual-output analytics demands of combined heat and power plants — tracking both thermal and electrical assets, monitoring combined efficiency ratios, and connecting performance degradation to maintenance work orders before either output stream is affected.
80–90%
Fuel utilization efficiency achievable at well-maintained CHP plants vs. 33–45% at separate generation
$1.2M
Average annual fuel savings at a 5 MW CHP facility operating with optimized heat recovery efficiency
3–8%
Heat rate degradation from untracked prime mover fouling — invisible without continuous performance trending
40%
Reduction in CHP forced outage events with AI-driven condition monitoring across dual output systems
The CHP Analytics Gap
Four Reasons Standard Analytics Software Fails CHP Operations
CHP plants are not power plants with a heat exchanger bolted on. They are integrated thermal-electric systems whose performance metrics are interdependent — and the analytics program must be configured to reflect that interdependency.
Single-Stream
Analytics Built for Power-Only
Standard power plant CMMS tracks electrical KPIs — availability factor, heat rate, forced outage rate. None of these metrics capture heat recovery system performance, HRSG efficiency, or absorption chiller operation that determine CHP economics.
Siloed
Thermal and Electrical Data Disconnected
Heat recovery data lives in the building automation system. Power generation data lives in the SCADA historian. Neither system sees the combined efficiency ratio — the primary metric that determines whether the CHP plant is delivering its economic justification.
Lagging
Performance Reporting Weeks Behind
Monthly efficiency reports assembled manually from multiple data sources reveal CHP performance gaps 3–6 weeks after they develop. By then, the fuel consumption overage and maintenance window have already compounded into a significant cost variance.
Reactive
Maintenance Triggered by Failure
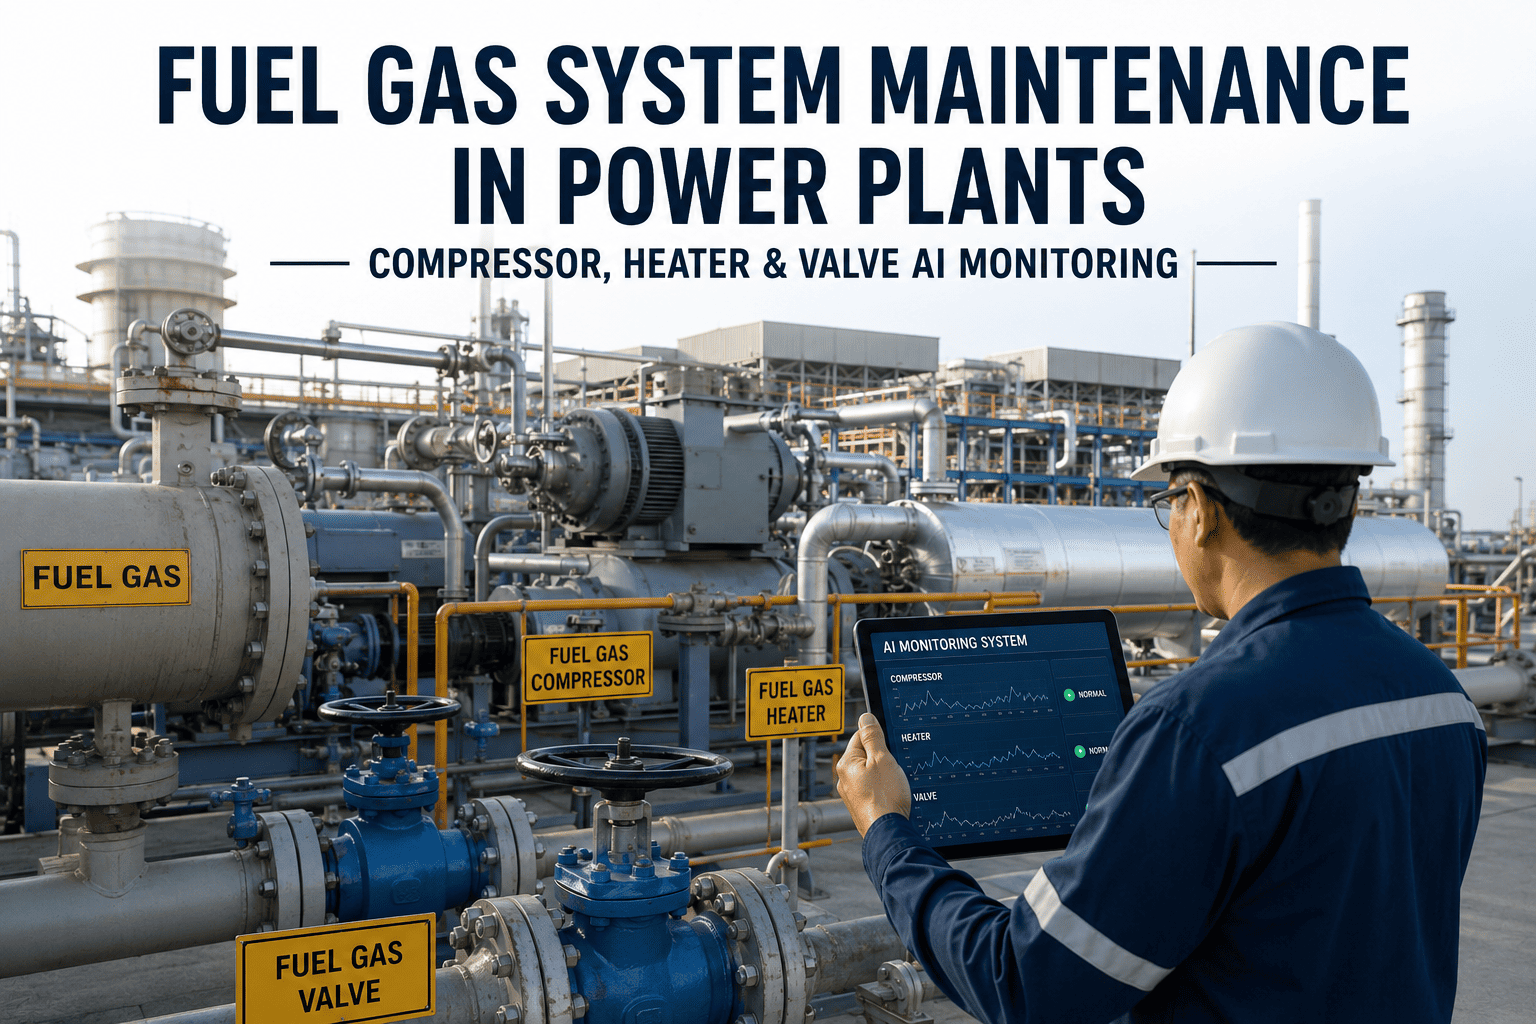
Prime mover fouling, HRSG tube fouling, absorption chiller performance decline, and cooling tower efficiency degradation all produce detectable signals weeks before they cause forced outages — signals that reactive maintenance programs never see.
CHP Analytics Capabilities
Five AI-Driven Analytics Capabilities That iFactory Delivers for CHP Operations
Each capability addresses a specific CHP analytics gap — from combined efficiency ratio monitoring to dual-output asset condition tracking — that generic power plant or building management analytics cannot provide.
01
Dual-Output Combined Efficiency Tracking
Power-to-heat ratio, overall fuel utilization efficiency, and thermal efficiency index calculated continuously from SCADA and heat meter data — displayed as a live combined efficiency dashboard that shows exactly how much of the fuel energy is being captured as useful electrical and thermal output at any moment. When combined efficiency deviates from the baseline by more than the configured threshold, an alert is generated with the probable contributing system identified.
Combined efficiency visibility improvement
Real-time vs. monthly
02
Prime Mover Condition and Performance Trending
Gas turbine, reciprocating engine, or microturbine prime mover performance tracked continuously — heat rate deviation from design, compressor inlet temperature correction, exhaust temperature profile trending, vibration analysis, and oil analysis findings integrated into a single prime mover condition record. Fouling progression, combustion degradation, and rotating machinery wear trends visible weeks before they affect output or trigger a protection system event.
Early degradation detection advance
4–8 weeks ahead
03
HRSG and Heat Recovery System Monitoring
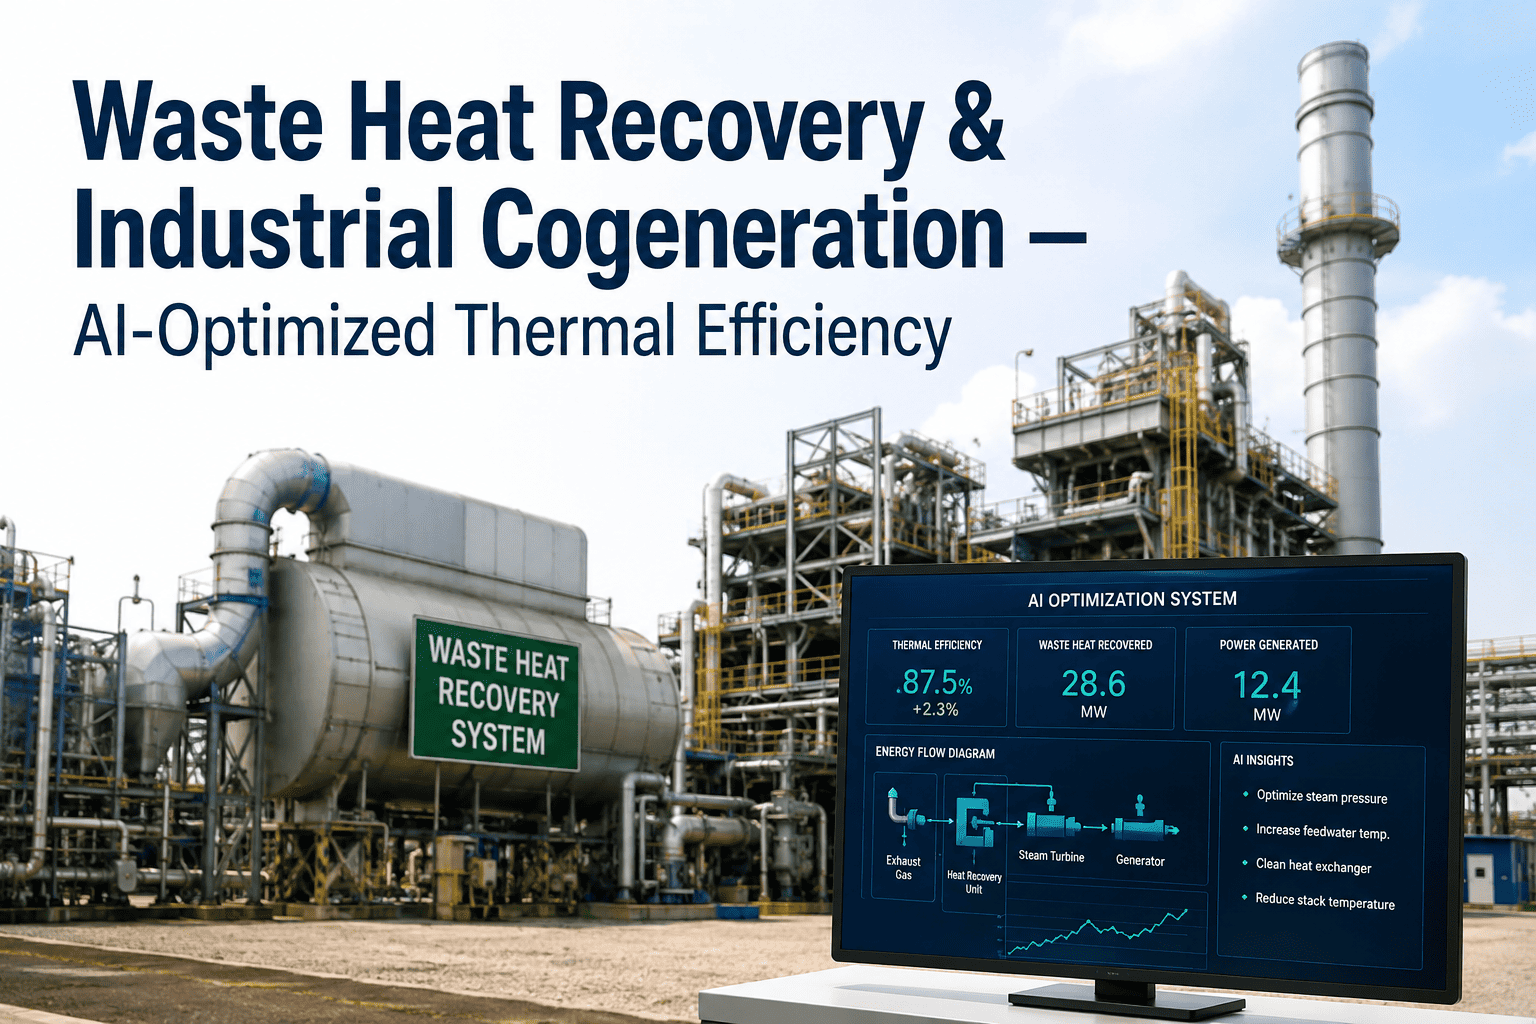
Heat recovery steam generator performance tracked via approach temperature trending, steam production rate vs. exhaust input, economizer and superheater temperature profiles, and drum level and steam quality monitoring. HRSG tube fouling detected from approach temperature deviation before it causes efficiency penalties or tube integrity concerns. Absorption chiller COP trending integrated alongside HRSG monitoring for complete thermal recovery system visibility.
HRSG fouling detection lead time
3–6 weeks before impact
04
Economic Dispatch and Load Optimization
CHP economic dispatch model continuously calculates the optimal operating point based on current thermal load demand, electrical tariff, gas price, and current plant efficiency — recommending load set points that maximize combined value output per unit of fuel consumed. When thermal demand drops below the optimal CHP operating range, the model calculates the economic break-even point between CHP generation and grid import, providing the operations team with data-driven dispatch decisions rather than fixed schedules.
Dispatch decision optimization improvement
12–18% fuel cost reduction
05
Regulatory Compliance and CHP Certification Tracking
EPA CHP Partnership program documentation, qualifying facility status reporting under PURPA, state-level renewable/efficiency incentive program data, and utility interconnection performance reporting — all generated automatically from iFactory's CHP performance records. Annual CHP efficiency certification calculations (per EPA methodology) calculated from the same operational data used for maintenance analytics, eliminating the separate data compilation exercise that currently takes days before every regulatory submission.
Compliance documentation time reduction
Days to under 60 seconds
iFactory Brings AI-Driven Analytics to Your CHP Plant's Dual-Output Operations — Thermal and Electrical, Tracked Together.
Combined efficiency monitoring, prime mover condition trending, HRSG performance analytics, economic dispatch optimization, and regulatory compliance documentation — all in one AI-driven platform configured for cogeneration operations.
Before vs. After
CHP Plant Operations — Without AI Analytics vs. With iFactory
CHP Function
Without AI Analytics
With iFactory CHP Analytics
Combined Efficiency
Monthly report assembled from multiple systems — efficiency gaps discovered 3–6 weeks after they develop
Live combined efficiency dashboard — power-to-heat ratio and fuel utilization tracked continuously, deviations flagged same day
Prime Mover Health
Scheduled major maintenance intervals — fouling and performance degradation discovered during overhaul or at forced outage
Continuous condition trending — heat rate deviation, exhaust profile, vibration, and oil analysis integrated, degradation flagged 4–8 weeks early
HRSG Monitoring
Approach temperature checked manually on rounds — HRSG tube fouling discovered during planned inspection or tube failure
Approach temperature trending per section — fouling progression detected 3–6 weeks before efficiency impact, cleaning scheduled proactively
Economic Dispatch
Fixed operating schedule regardless of thermal load, gas price, or tariff structure — suboptimal dispatch costing 12–18% in fuel economics
Dynamic dispatch model recommends optimal load set point from current thermal demand, tariff, and efficiency — continuously updated
Maintenance Triggers
Calendar-based PM intervals not aligned to actual condition — over-maintaining some systems, under-maintaining others
Condition-based work orders generated automatically when performance thresholds crossed — aligned to actual degradation, not fixed calendar
Compliance Docs
EPA CHP certification data assembled manually from multiple sources — days of effort before each regulatory submission
Regulatory documentation generated automatically from operational records — EPA efficiency certification in under 60 seconds
Measurable Outcomes
What CHP Plant Operations and Engineering Teams Measure With iFactory
40%
Fewer Forced Outages
Prime mover condition trending and HRSG monitoring eliminate the unplanned outages that reactive maintenance programs produce on cogeneration systems.
12–18%
Fuel Cost Reduction
AI-driven economic dispatch optimization aligns CHP operating point to real-time thermal load and tariff conditions — capturing fuel savings that fixed schedules cannot.
3–6 wks
Early HRSG Fouling Detection
Approach temperature trending detects heat recovery degradation weeks before it reaches the efficiency impact threshold — enabling planned cleaning vs. emergency correction.
Real-time
Combined Efficiency Visibility
Power-to-heat ratio, fuel utilization efficiency, and individual system performance visible continuously — not in a monthly report assembled after the losses have already occurred.
<60 sec
Compliance Documentation
EPA CHP certification calculations and qualifying facility performance documentation generated automatically from operational records — no manual data assembly.
14 days
Go-Live Timeline
CHP analytics configuration from SCADA and historian integration through dual-output dashboard activation — operational in two weeks without an IT infrastructure project.
Expert Perspective
What CHP Plant Managers and Cogeneration Engineers Say About AI-Driven Analytics
"
The fundamental challenge with CHP analytics is that the economics of the plant depend on a ratio — how much of the fuel energy you're capturing as useful output across both streams. If your HRSG approach temperature is rising because of tube fouling, you're losing heat recovery efficiency, which changes your power-to-heat ratio, which changes your economic dispatch calculation, which affects whether the plant is actually delivering its project justification. These are interconnected variables. The analytics program needs to show you the system as a system — not as a power plant report plus a separate heat exchanger status sheet that nobody looks at because it's in a different system. We ran our 8 MW gas-engine CHP facility for three years with standard SCADA trending and manual monthly efficiency calculations. We knew our combined efficiency was declining, but we couldn't isolate whether it was the engine, the HRSG, the absorption chillers, or the cooling tower without a week of engineering analysis. When we deployed integrated CHP analytics, the first thing we found was a 6% HRSG efficiency decline from tube fouling that had been developing for 11 months. We were burning approximately $340,000 in additional fuel annually because the heat recovery was underperforming and we were compensating with the grid rather than optimizing the dispatch set point. The fouling was visible in the approach temperature data the whole time — we just had no system that was watching it and comparing it to the baseline. After a planned cleaning and dispatch optimization adjustment, combined efficiency recovered to within 1.2% of design. That was $310,000 in annual fuel savings recovered from a problem that the data already showed us — we just didn't have a system connecting it to action."
— CHP Plant Engineering Manager, 8 MW Gas-Engine Cogeneration Facility, U.S. Northeast Industrial Campus · PE Licensed · 16 Years CHP Operations · CHP Association Technical Committee Member
$310KAnnual fuel savings recovered
11 monthsFouling undetected without analytics
6%HRSG efficiency recovered post-cleaning
Conclusion
CHP Economics Depend on a Ratio. Your Analytics Program Needs to Track That Ratio.
The economic justification for a combined heat and power facility rests on one metric: combined fuel utilization efficiency — the percentage of input fuel energy captured as useful electrical and thermal output. Every piece of equipment in the plant either supports or degrades that ratio. Prime mover fouling degrades it. HRSG tube deposit accumulation degrades it. Absorption chiller performance decline degrades it. Suboptimal economic dispatch allows it to run below its achievable level. The problem is that none of these degradation pathways are visible in standard power plant analytics software — because standard power plant analytics tracks electrical output only, and standard building management systems track thermal output only, and neither system is watching the ratio that connects them.
iFactory's CHP analytics platform closes this gap by connecting SCADA, historian, heat meter, and maintenance data into a single AI-driven analytics layer that tracks the combined efficiency ratio continuously — and connects every performance deviation to the specific system degradation causing it, and from there to a scheduled maintenance work order. The $310,000 fuel savings story above is not unusual. It is what systematically monitored CHP plants achieve compared to plants where the data exists but no system is watching it. Book a Demo to see iFactory's CHP analytics configured for your plant's prime mover type, HRSG configuration, and thermal load profile.
Frequently Asked Questions
CHP Plant Analytics in iFactory — What Cogeneration Operations Teams Ask First
Which CHP prime mover types does iFactory's analytics configuration support?
iFactory's CHP analytics module is configured for all major CHP prime mover types used in U.S. industrial and commercial applications: natural gas-fired reciprocating engines (Caterpillar, Cummins, Jenbacher, MAN), gas turbines (Solar Turbines, GE Aeroderivative, Siemens SGT), steam turbines operating in combined cycle or backpressure configurations, and microturbines (Capstone, Bladon). The performance trending parameters, baseline metrics, and degradation detection algorithms are pre-configured for each prime mover class — heat rate correction factors, exhaust temperature profiles, vibration frequency ranges, and oil analysis parameters are specific to the equipment type and not generic thresholds. For multi-unit CHP installations with different prime mover types at a single site, iFactory maintains separate performance models per unit while providing consolidated site-level combined efficiency reporting.
Book a Demo to confirm the configuration for your specific prime mover model and HRSG type.
How does iFactory integrate thermal output data from the heat recovery system alongside electrical generation data?
Thermal output integration is the core technical challenge in CHP analytics — and iFactory addresses it through three integration pathways. For plants with building automation systems (BAS) or building management systems (BMS), iFactory connects via BACnet, Modbus, or OPC-UA to pull heat meter readings, HRSG steam production data, absorption chiller COP, and district heating supply/return temperature differentials. For plants with dedicated SCADA-based heat recovery monitoring, integration uses the existing SCADA OPC-UA server or historian API. For plants with manual thermal data recording, iFactory provides a mobile data entry interface that allows operators to log heat meter readings, approach temperatures, and steam production figures on a configurable interval — which are then incorporated into the combined efficiency calculation. All three pathways produce the same combined efficiency dashboard output; the integration method is matched to the plant's existing monitoring infrastructure rather than requiring new hardware.
How does iFactory calculate and report EPA CHP efficiency for qualifying facility status and certification documentation?
iFactory calculates CHP system efficiency using the EPA's standard FERC-aligned methodology: total useful energy output (electrical + thermal) divided by total fuel input, expressed as a percentage. The calculation applies the EPA's useful thermal output qualification criteria — thermal energy delivered to a process or space conditioning application at temperatures above the ambient rejection threshold — and excludes rejected heat that does not meet qualifying output criteria. The annual CHP efficiency certification calculation is generated automatically from iFactory's operational records at any time, producing the documentation in the format required for EPA CHP Partnership program reporting, state-level CHP incentive program submissions, and utility interconnection annual performance certifications. For plants seeking or maintaining Qualifying Facility (QF) status under PURPA, iFactory generates the FERC Form 556 supporting calculation data from the same operational records.
Book a Demo to see the EPA CHP efficiency calculation demonstrated for your plant configuration.
How does iFactory's economic dispatch optimization work for CHP plants with both thermal and electrical load variability?
iFactory's CHP economic dispatch model calculates the optimal prime mover operating set point at every decision interval (configurable from 15 minutes to 1 hour) based on five real-time inputs: (1) current thermal load demand from the plant's heat distribution system, (2) current electrical tariff rate and time-of-use structure, (3) current natural gas price, (4) current plant-specific combined efficiency at the proposed load level (from the performance model), and (5) grid electricity import availability and price. The model calculates the fuel cost per unit of combined useful output at each feasible operating point and recommends the set point that maximizes combined output value per unit of fuel consumed. For plants with thermal storage (hot water or chilled water buffers), the model incorporates storage state-of-charge in the dispatch calculation — recommending pre-cooling or pre-heating during off-peak tariff periods when thermal storage can absorb excess heat recovery. The dispatch recommendation is advisory — the operations team implements it — and the model logs each recommendation against the actual operating set point to build the performance record used for dispatch strategy review.
How long does iFactory's CHP analytics configuration take from contract to live dashboard?
For a standard single-prime-mover CHP installation with SCADA-based electrical monitoring and BMS-based thermal monitoring, iFactory's CHP analytics go-live takes 10–14 days from integration start. The configuration process covers: SCADA and BMS data connection and signal mapping, prime mover performance model configuration using the unit's design specifications and commissioning test data, HRSG approach temperature baseline establishment from available historical data, combined efficiency calculation validation against known reference periods, and economic dispatch model calibration using current tariff structure and gas price. For multi-unit installations or plants with complex thermal distribution networks (multiple HRSGs, multiple absorption chillers, district heating), configuration takes 3–5 weeks. The baseline establishment period — during which iFactory profiles the plant's normal operating signature under different load conditions — runs concurrently with the integration work and does not extend the go-live timeline.
Book a Demo to receive a configuration timeline estimate for your specific CHP installation.
Your CHP Plant's Fuel Efficiency Data Already Exists. iFactory Connects It Into a Live Performance Program.
Combined efficiency tracking, prime mover condition trending, HRSG fouling detection, AI-driven economic dispatch, and EPA compliance documentation — all in one analytics platform configured for cogeneration operations and deployed in 14 days without an IT infrastructure project.