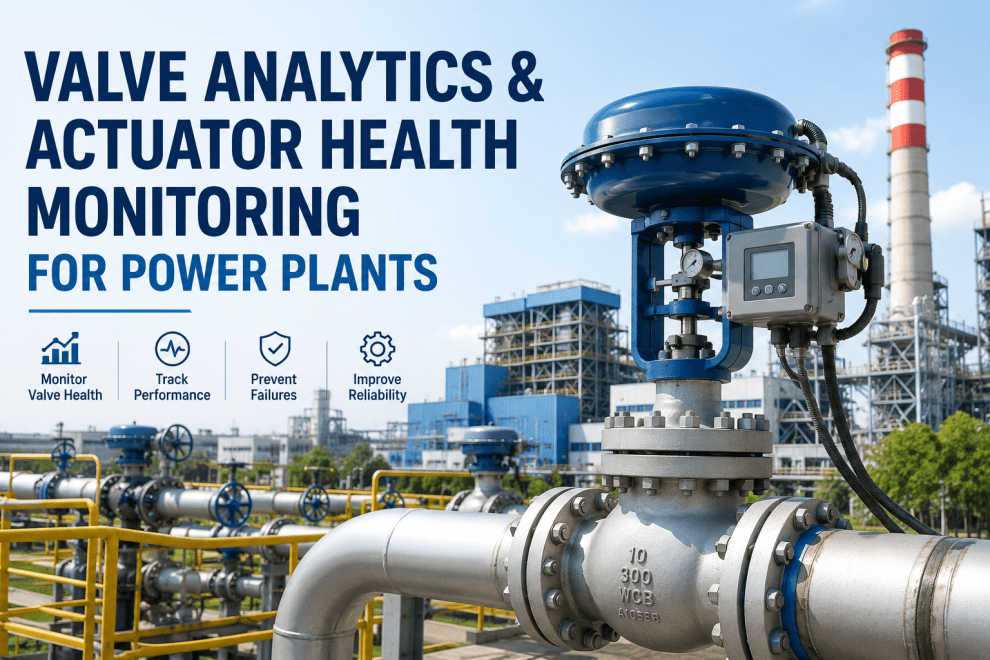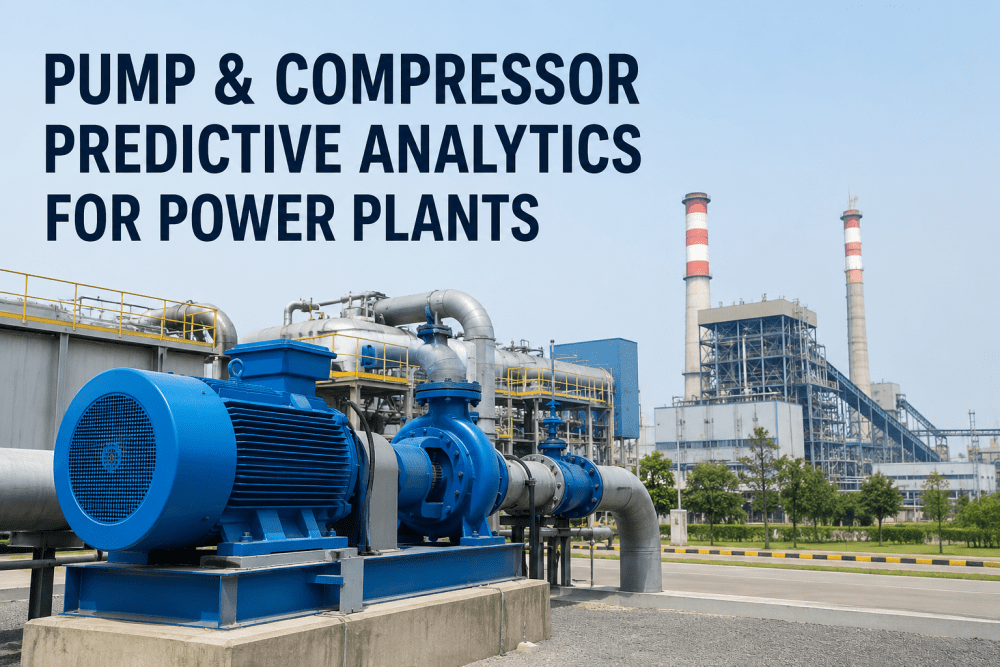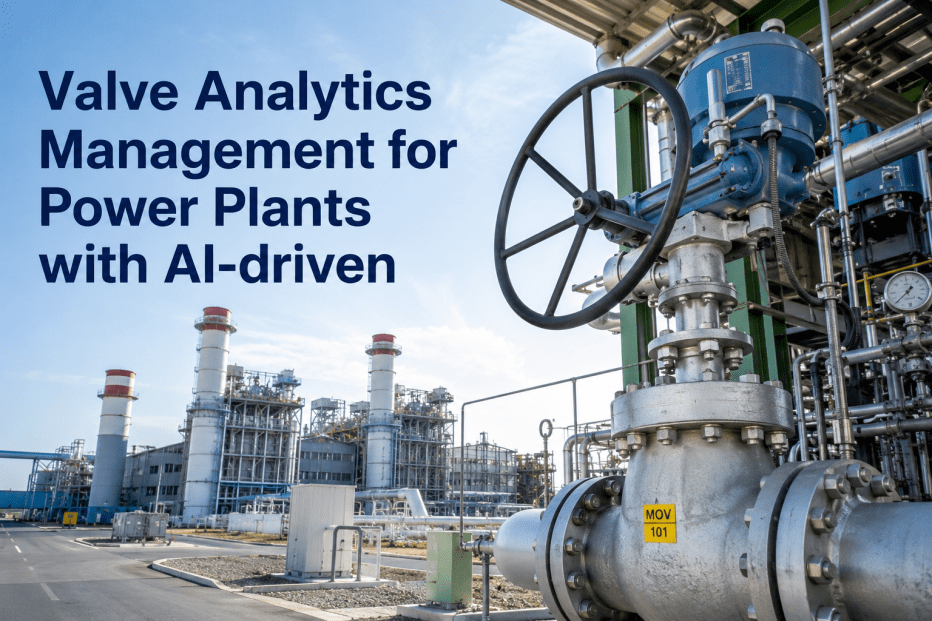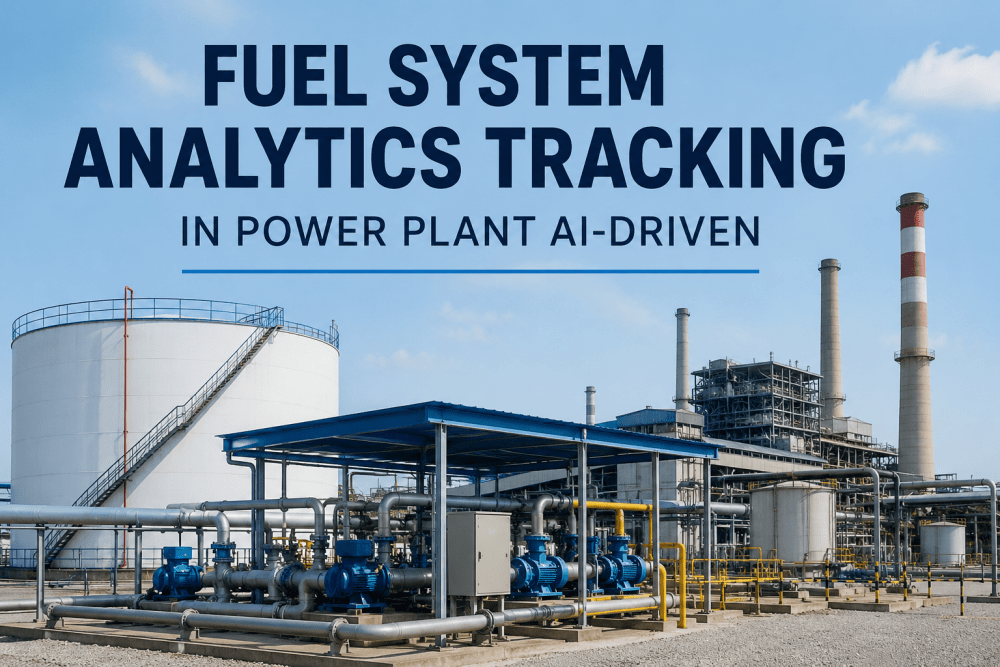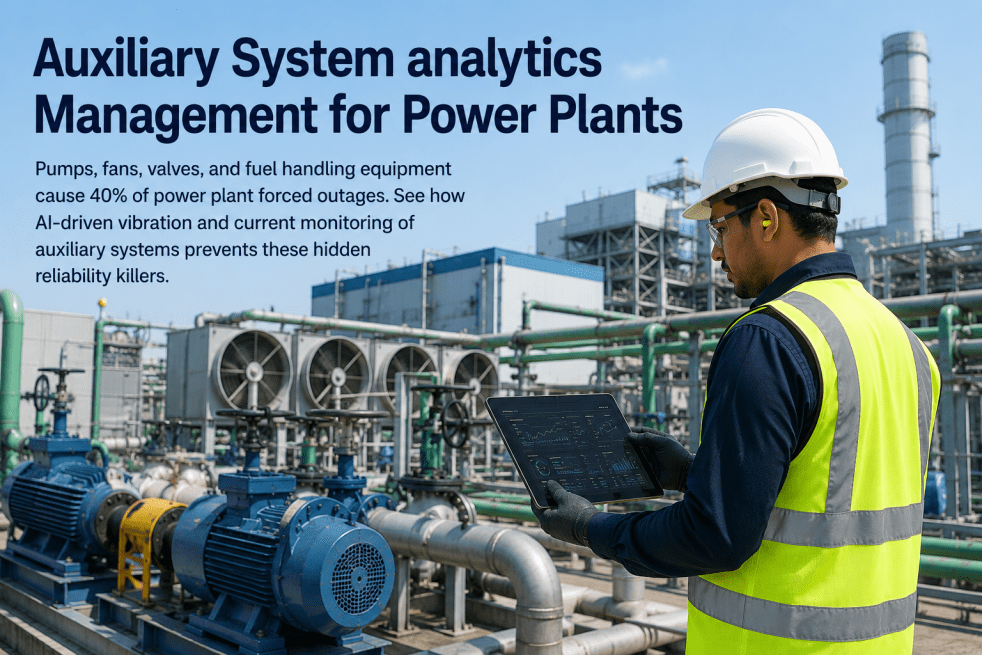
Pumps, fans, valves, and fuel handling equipment rarely make the headlines when power plant unit trips. The generator gets the incident report. The gas turbine gets the root cause analysis. But walk back through the forced outage log at any 200 to 500 MW combined cycle or steam facility and the pattern is consistent: 38 to 45 percent of unplanned outages trace back not major rotating equipment, but to the auxiliary systems that support it. A condensate pump that cavitated undetected for three weeks. A forced draft fan bearing that ran hot on the overnight shift without triggering an alarm. A fuel gas filter differential pressure that climbed steadily through a holiday weekend while nobody was watching the trend. These are not exotic failure modes. They are the kind of reliability problem that experienced plant engineers have seen dozens of times and that every operations team believes they are managing — right up until the forced outage report crosses the plant manager's desk. The reason auxiliary system failures continue to drive outage exposure at facilities that believe they have the right preventive maintenance program in place is straightforward: the data has always been available in the historian, but the analytical layer that converts that data into advance warning was either absent or applied inconsistently. AI-driven auxiliary system analytics changes that equation by monitoring vibration, motor current, differential pressure, temperature, and flow data continuously across the full BOP equipment population — not just the tier-one assets that get vibration routes — and surfacing developing failure signatures 48 to 72 hours before they become forced outage events. For U.S. power plant operations and reliability leaders, that shift from episodic monitoring to continuous AI-driven analytics on the full auxiliary population is where the remaining unplanned outage exposure has been hiding.
Why Auxiliary Systems Are the Hidden Reliability Problem at Power Plants
Every power plant reliability program is designed around equipment criticality. Tier-one assets — gas turbines, steam turbines, main generators, HRSGs — receive the most monitoring attention, the most frequent vibration routes, and the most conservative maintenance intervals. This prioritization is rational. The consequence of a tier-one failure is severe and well-documented. But the concentration of monitoring resources on tier-one assets creates a visibility gap in the auxiliary population that experience shows carries more of the actual unplanned outage exposure than the risk-ranked maintenance program accounts for.
Volume Problem
A 300 MW combined cycle facility typically has 400 to 700 individual auxiliary assets — pumps, fans, valves, dampers, conveyors, and handling equipment — that cannot all be on monthly vibration routes with existing staff levels
Detection Gap
Manual vibration routes and calendar-based PM intervals check auxiliary assets once every 30 to 90 days — a detection window that misses failure modes that progress from healthy to critical in 10 to 21 days
Consequence Underestimate
Auxiliary failures force unit derates and trips at the same cost as primary equipment events — condensate pump loss, cooling water pump failure, and forced draft fan trips all take the unit offline regardless of the asset's tier classification
Data Already Exists
Motor current, differential pressure, temperature, and flow data for most auxiliary systems is already being collected in the plant historian — the gap is the analytical layer that converts that data into condition monitoring intelligence
What iFactory AI Monitors Across the Auxiliary System Population
AI-driven auxiliary system analytics does not require retrofitting new sensors on every pump and fan in the facility. The monitoring capability is built on the sensor data that is already flowing to the plant historian — motor current signatures, differential pressure trends, temperature readings, flow rates, and valve position feedback — combined with vibration data from existing wired or wireless sensors where they exist. The table below maps the primary auxiliary equipment categories, the data sources the platform uses, and the failure modes it detects in advance of forced outage impact.
Want to see how AI monitoring would cover your specific auxiliary system population? Book a free auxiliary system analytics assessment with iFactory's power generation reliability team.
The Detection Loop: From Historian Data to Dispatched Work Order
The practical value of AI auxiliary system analytics is determined not just by detection accuracy but by how quickly a confirmed finding becomes a dispatched maintenance action. The workflow below maps the end-to-end process from data ingestion to work order creation — showing where AI eliminates the manual steps that historically added 18 to 72 hours of coordination lag between detection and response.
Continuous Data Ingestion From Existing Historian
Motor current, differential pressure, temperature, flow, vibration, and position data streams are ingested continuously from the plant historian via read-only OPC-UA or PI connection — no modifications to the production control system required. Data normalization and bad actor tag identification complete within the first two weeks of connection.
Physics-Based Baseline and Anomaly Detection Model
For each auxiliary asset, the platform builds a physics-based operating baseline from the first 14 to 30 days of connected data — establishing the expected performance envelope for that specific piece of equipment under its actual operating conditions. Motor current signature analysis, pump curve deviation detection, and differential pressure trend models run continuously against the live data streams.
Failure Mode Classification and Confidence Scoring
When a deviation is detected, the AI classifies the failure mode — bearing wear, cavitation, fouling, seal degradation, actuator degradation — and assigns a confidence score. High-confidence findings with critical consequence classification route to immediate operations notification. Medium-confidence findings route to the maintenance planner's review queue with supporting trend data attached.
Automated Work Order Generation to CMMS
Confirmed high-confidence findings generate a fully-formed work order in the connected CMMS — including equipment identifier, failure mode description, recommended inspection scope, estimated urgency window, and the supporting trend data as an attachment. The work order arrives in SAP PM, Maximo, or Infor EAM as a complete, actionable record rather than a notification requiring further manual entry. No coordinator is required to route the finding from detection to dispatch.
Traditional Monitoring vs. AI-Driven Auxiliary Analytics
The operational difference between a manual monitoring program and AI-driven auxiliary analytics is most visible in the gap between how many assets each approach covers and how quickly each detects developing problems. The comparison below maps these differences across the dimensions that determine whether an auxiliary failure becomes a work order or a forced outage.
Expert Review: What Reliability Engineers Say About Auxiliary System Analytics
"Every plant reliability program I have reviewed in the last decade has the same structural gap: an excellent monitoring program for the tier-one equipment and an essentially episodic monitoring approach for everything else. The auxiliary population is where the unaccounted-for outage exposure lives. When you apply AI monitoring to the full BOP population — using the motor current and process data already in the historian — you find things that the manual program was never designed to catch: a cooling water pump running consistently two to three percent above its design motor current for six weeks before the impeller finally fails, a fuel gas filter differential pressure trending upward across twelve days through three shift changes without triggering any alarm, an induced draft fan bearing temperature that has moved eight degrees above its established normal over three weeks. None of these were invisible — the data was there. What was missing was the analytical layer that was looking at all 450 assets continuously, comparing them against their baselines, and flagging the deviations before they became trips. The investment case is straightforward: if auxiliary failures represent 40 percent of your outage exposure and the platform costs one tenth of one forced outage event to operate for a year, the math works on the first month."
Conclusion
Auxiliary system failures represent the largest remaining category of preventable forced outage exposure at most U.S. power plants — and they persist not because the failure modes are unpredictable, but because the monitoring coverage that would detect them before they cascade to a unit trip has not been applied to the full auxiliary population. The data required to monitor most auxiliary systems continuously is already flowing to the plant historian. Motor current, differential pressure, temperature, and flow data for condensate pumps, draft fans, cooling water systems, fuel handling equipment, and instrument air are available in real time. What has been missing is the AI analytical layer that converts that existing data stream into continuous condition monitoring for 400 to 700 assets simultaneously, classifies developing failure modes against physics-based baselines, and routes confirmed findings to a dispatched work order in the CMMS — without a reliability engineer manually pulling the data and without a coordinator spending hours routing the finding through the approval chain.
The operational and financial return from deploying that capability is measurable from the first operating quarter. At a 200 to 300 MW combined cycle or steam facility, preventing three to five auxiliary-caused forced outage events per year typically covers the platform cost by a factor of four to eight — and the avoided emergency maintenance premiums and overtime costs add a second value stream on top of the outage prevention savings. For power plant operations and reliability leaders evaluating where the remaining unplanned outage exposure is concentrated at their facility, auxiliary system analytics is the answer that the outage log has been pointing to for years.
Ready to see what AI auxiliary monitoring would find at your facility? Schedule your auxiliary system analytics assessment with iFactory's power generation reliability team.
Frequently Asked Questions
Stop Letting Auxiliary Failures Drive Your Forced Outage Log
iFactory's AI-driven auxiliary system analytics covers 3 to 4 times more BOP equipment than manual vibration routes — using the sensor data already in your historian, with no control system changes, live in 4 weeks, and generating measurable outage prevention results from the first operating quarter.