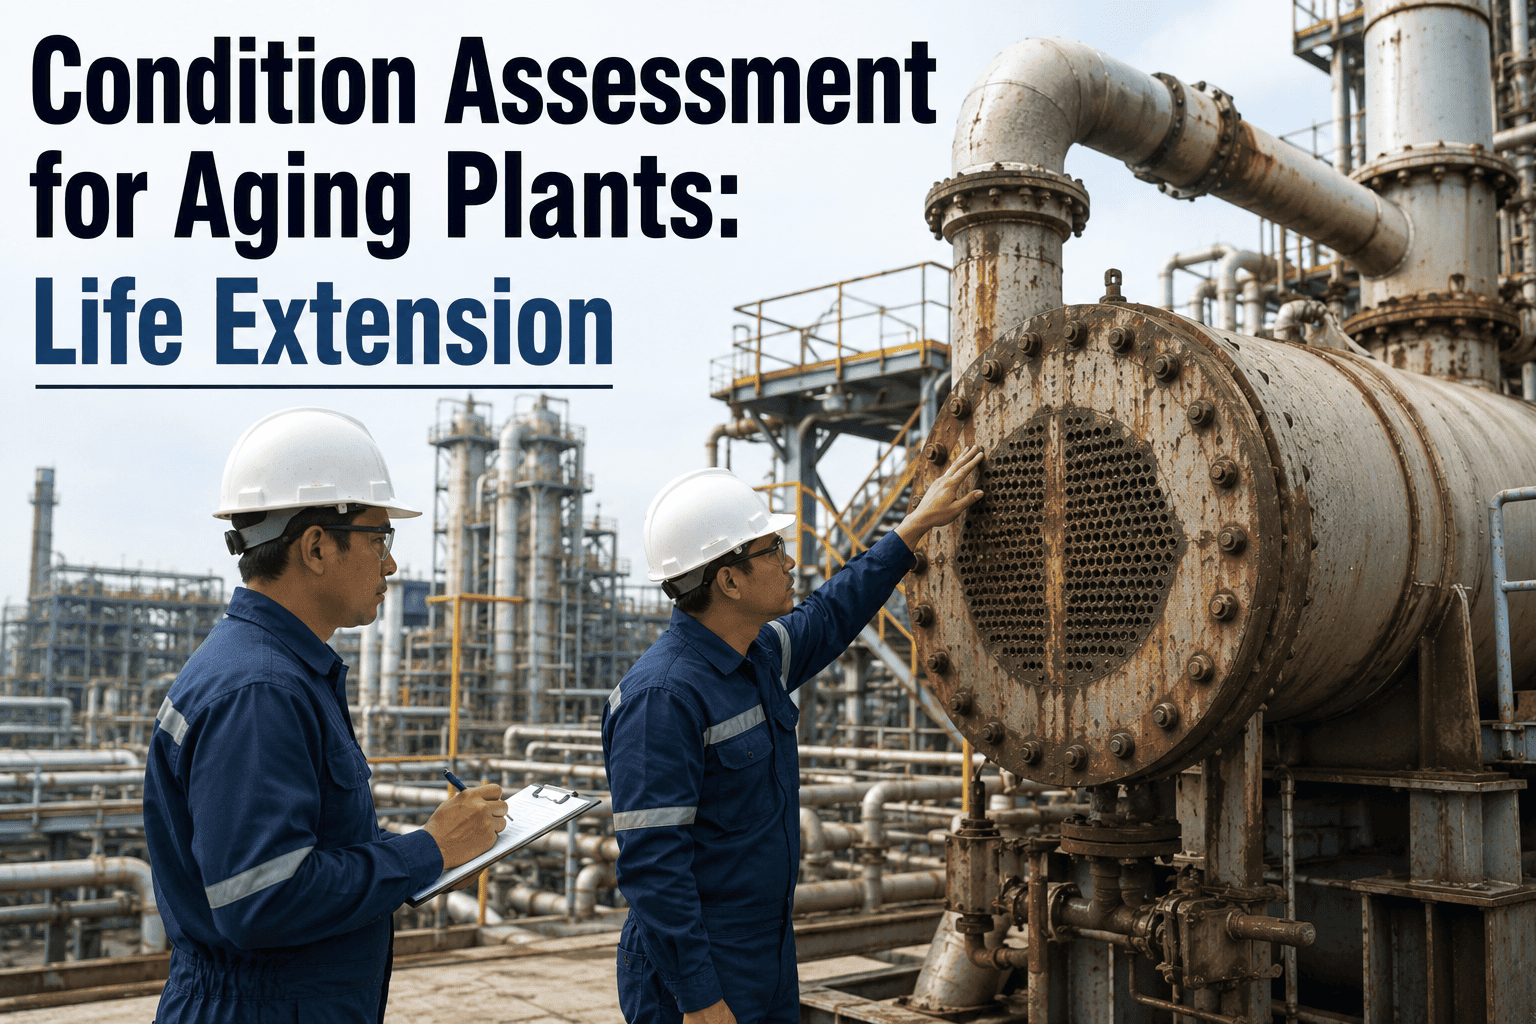
Most power plants operating in the United States today are running critical equipment well past its original design life. Gas turbines designed for 100,000 equivalent operating hours are approaching 200,000. Steam generators commissioned in the 1980s are still producing megawatts with original tube bundles. Transformers, condensers, feedwater heaters, and BOP systemthat were engineered for 30-year service envelope are now operating in year 35 or 40 — with maintenance budgets that assume they will continue doing so indefinitely.
The financial exposure created by that assumption is substantial. A single catastrophic failure of a major aging component — a generator stator ground fault, a main transformer bushing failure, a condenser tube sheet breach — generates $2 million to $8 million in combined forced outage, replacement power, emergency repair, and capacity penalty costs at a typical 200–500 MW facility. What makes aging infrastructure failures different from other forced outage events is that they are almost never sudden. They are preceded by months or years of measurable degradation — insulation resistance decline, vibration signature shifts, heat transfer coefficient deterioration, chemistry trending anomalies — that conventional DCS alarm systems and calendar-based inspection programs are not designed to detect at the pace required to prevent the failure. AI-driven analytics platforms purpose-built for aging plant infrastructure close that gap by continuously correlating thousands of sensor signals against physics-based degradation models, translating equipment condition into financial risk, and generating prioritized intervention recommendations before failure modes progress to the point of forced outage.
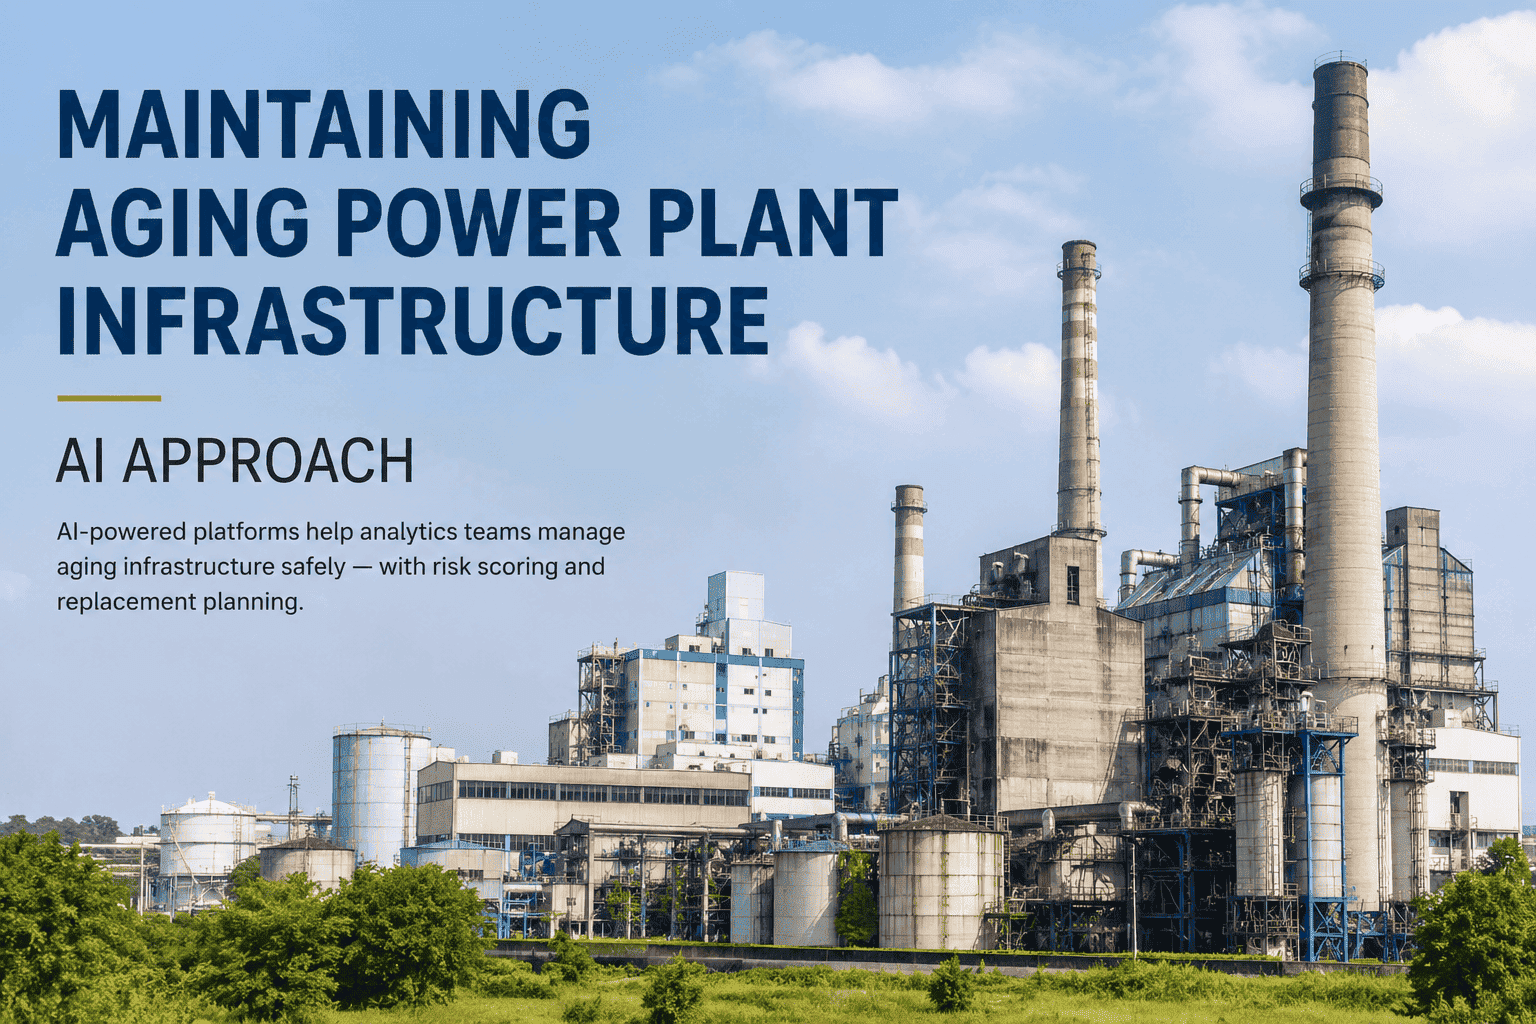
Maintaining Aging Power Plant Infrastructure: The AI Analytics Approach
AI-powered risk scoring, remaining useful life estimation, and replacement planning — purpose-built for power plants running critical equipment past original design life. Prevent multi-million dollar catastrophic failures before they start.
Ready to get a clear picture of your aging infrastructure risk? Schedule your plant assessment with iFactory's asset integrity analytics team.
The Scale of the Aging Infrastructure Problem in U.S. Power Generation
The age profile of the U.S. power generation fleet creates an equipment reliability challenge that calendar-based maintenance programs were never designed to address. The majority of coal, gas, and combined cycle plants operating today have at least one major system — and usually several — operating beyond original equipment manufacturer design life expectations. The gap between design life and actual operating age is not, by itself, a failure predictor. Equipment can operate safely and reliably well past its design envelope if degradation is monitored continuously and interventions are timed correctly. The problem is that most plants are not monitoring aging degradation continuously — they are inspecting it periodically, on schedules that were set when the equipment was new and degradation rates were predictable.
Where Aging Equipment Fails: The Five Highest-Consequence Systems
Not all aging equipment carries equal risk. The systems that generate the largest financial exposure when they fail are those that combine long lead times for replacement parts, high forced outage cost rates, and degradation modes that progress silently through conventional monitoring. AI-driven aging infrastructure analytics concentrates diagnostic capability on these five systems because they account for over 80% of aging-related forced outage costs at U.S. power plants.
Main Power Transformers and GSUs
Main power transformers and generator step-up units are the single highest-consequence aging assets at most power plants. Lead times for replacement transformers now exceed 12 to 18 months for custom-wound units, meaning a catastrophic failure removes the unit from service for an entire capacity season — or longer. AI analytics tracks the full degradation signature continuously rather than relying on annual dissolved gas analysis snapshots.
- Dissolved gas analysis trending with rate-of-change anomaly detection across all key gases
- Insulation resistance and power factor degradation rate modeling against thermal loading history
- Bushing capacitance trending for dielectric deterioration prior to flashover risk
- Cooling system performance degradation affecting thermal life consumption rate
Generator Stator Windings and Insulation Systems
Generator stator insulation degrades with every thermal cycle, and the degradation accelerates nonlinearly as the insulation system ages past its rated life. A stator ground fault or phase-to-phase failure at a plant with an aging generator can result in a 6 to 12 month forced outage for stator rewind — a repair that costs $3 million to $6 million before replacement power costs are included. AI analytics detects the subtle insulation deterioration signature months before a fault becomes imminent.
- Partial discharge trending correlated with load cycling and thermal transient history
- Stator cooling water conductivity and flow rate anomaly detection
- Insulation resistance profiling across temperature-compensated measurement windows
- Cumulative thermal life consumption modeling with remaining useful life estimation
Steam Turbine Rotors, Blading, and Valve Bodies
Steam turbine components operating past design life face creep damage accumulation, solid particle erosion from oxide scale, and stress corrosion cracking at blade root attachments — all failure modes that progress below the detection threshold of periodic borescope inspections. AI analytics continuously monitors the full operating signature of an aging steam turbine to detect developing mechanical and metallurgical issues before they result in blade liberation, rotor bore cracking, or valve body failure.
- Vibration spectrum analysis for blade damage, rub events, and rotor bow detection
- Stage efficiency degradation trending for erosion and deposit buildup quantification
- Control valve position-to-flow modeling for seat erosion and stem packing wear
- Creep life consumption estimation from integrated temperature-stress-time exposure
Condenser Tube Bundles and Tube Sheets
Condenser tube failures at aging plants are among the most operationally disruptive events because they contaminate the entire steam-side water chemistry, accelerating corrosion damage across every downstream component — boiler tubes, feedwater heaters, and steam turbine blading. A single condenser tube leak can trigger a cascade of secondary damage worth 5 to 10 times the cost of the tube repair itself. AI analytics monitors the full condenser degradation signature to detect tube thinning and tube sheet erosion before a through-wall leak occurs.
- Condenser backpressure trending corrected for cooling water temperature and flow rate
- Hotwell conductivity and sodium breakthrough monitoring for early tube leak detection
- Air in-leakage quantification from dissolved oxygen and vacuum pump performance
- Tube fouling rate modeling with cleaning interval optimization and ROI calculation
Balance-of-Plant Piping Systems and Pressure Vessels
BOP piping systems — main steam, hot reheat, cold reheat, feedwater, and extraction lines — degrade through creep, fatigue, flow-accelerated corrosion, and stress relaxation cracking at welded joints. These systems are often the oldest components at a plant and the least instrumented. A main steam pipe failure is a catastrophic safety and financial event. AI analytics uses the available sensor data in combination with operating history models to estimate remaining life and prioritize inspection locations.
- Creep and fatigue life consumption estimation from integrated temperature-pressure cycling data
- Flow-accelerated corrosion risk ranking by pipe segment, material, and flow regime
- Weld joint stress analysis correlated with thermal transient frequency and severity
- Prioritized NDE inspection location recommendations ranked by failure consequence and probability
Ready to get a clear picture of your aging infrastructure risk? Schedule your plant assessment with iFactory's asset integrity analytics team.
Aging Equipment Risk Matrix: What AI Analytics Detects Across the Plant
The following table maps the primary aging infrastructure failure modes against the specific sensor signals that AI analytics uses to detect them, the typical detection lead time before catastrophic failure, and the consequence severity without early intervention. This matrix is the analytical foundation that differentiates continuous AI-driven aging infrastructure monitoring from periodic inspection programs.
| Failure Mode | Affected System | Primary AI Detection Signals | Detection Lead Time | Avg. Outage Cost (Undetected) |
|---|---|---|---|---|
| Transformer Insulation Breakdown | Main Power Transformer / GSU | DGA gas generation rates, insulation power factor trending, bushing capacitance drift, winding temperature differential | 60–180 days | $3.0M–$8.0M |
| Stator Insulation Deterioration | Generator | Partial discharge magnitude and pattern, insulation resistance decline rate, cooling water conductivity anomaly | 90–365 days | $3.5M–$7.0M |
| Steam Turbine Creep Damage | HP / IP Rotor and Casing | Stage efficiency degradation, vibration spectrum shift, valve position-to-flow deviation, thermal stress accumulation | 30–120 days | $2.0M–$5.5M |
| Condenser Tube Through-Wall Leak | Condenser Tube Bundle | Hotwell conductivity trending, sodium breakthrough detection, backpressure-corrected performance decline | 14–60 days | $800K–$2.5M |
| Main Steam Piping Creep Rupture | High-Energy Piping | Temperature-pressure cycling accumulation, creep life fraction estimation, hanger load redistribution indicators | 180–730 days | $4.0M–$12.0M |
| Feedwater Heater Tube Failure | HP / LP Feedwater Heaters | TTD and DCA trending, drain flow anomaly, level control instability, extraction pressure deviation | 14–45 days | $400K–$1.2M |
| Cooling Tower Structural Degradation | Cooling System | Approach temperature rise uncorrected by flow, fan motor power deviation, basin conductivity trending | 30–90 days | $600K–$2.0M |
How AI-Driven Aging Infrastructure Analytics Works: From Sensor Data to Replacement Planning
The value of AI-driven aging infrastructure analytics is measured by how much of the decision chain the platform automates — from raw sensor data to a financially quantified replacement-versus-repair recommendation that a plant manager can act on without a fleet of consulting engineers. The following workflow traces that chain for a typical aging plant deployment.
Historical and Real-Time Data Integration
The platform ingests both real-time sensor streams via OPC-UA or PI historian and historical operating records — past inspection reports, outage findings, metallurgical test results, and OEM technical bulletins. For aging infrastructure analysis, this historical context is critical: a transformer that has operated at 95% rated load for 30 years has a fundamentally different remaining life profile than one that has operated at 70% for the same period. The platform builds a complete operating biography for each monitored asset from day one.
Physics-Based Life Consumption Modeling
Purpose-built degradation models — Arrhenius aging for transformer insulation, Larson-Miller creep models for high-energy piping, fatigue cycle counting for thermal-cycled components — calculate cumulative life consumption based on actual operating history rather than assumed design conditions. These models produce remaining useful life estimates that update continuously as new operating data arrives, replacing the static life estimates from the last outage inspection with dynamic, condition-based projections.
Multivariate Degradation Pattern Recognition
Machine learning models trained on confirmed aging-related failures across fleet-wide datasets identify developing degradation patterns that single-parameter trending misses. When a combination of signals — vibration spectrum changes, efficiency decline, chemistry trending anomalies — matches a known precursor pattern for a specific aging failure mode, the system classifies the developing condition with a confidence score and an estimated time-to-failure window. This pattern recognition layer catches the 72% of aging failures that have detectable precursors more than 60 days before the event.
Financial Risk Scoring and Replacement Economics
Every monitored asset receives a continuously updated financial risk score that combines probability of failure, consequence of failure, and the current replacement-versus-repair economics. A transformer with 18 months of estimated remaining life and a 14-month replacement lead time generates a fundamentally different financial risk profile than one with 5 years of remaining life. The platform expresses aging risk in the financial terms that capital planning requires — annualized risk cost, net present value of early replacement versus run-to-failure, and optimal replacement timing for budget cycle alignment.
Prioritized Capital and Maintenance Planning Integration
Findings integrate directly into the plant's CMMS and capital planning systems — SAP PM, Maximo, or Infor EAM — with asset condition scores, recommended inspection scopes, and replacement timelines pre-populated. Plant managers see a unified aging infrastructure risk dashboard that ranks all monitored assets by financial risk and remaining useful life, enabling capital allocation decisions based on actual equipment condition rather than calendar age or generic OEM replacement schedules.
Measured Outcomes: What Power Plants Achieve with Aging Infrastructure Analytics
The ROI case for aging infrastructure analytics is built on avoided catastrophic failures and optimized capital timing — the two value drivers that have the largest impact on a plant's long-term financial performance. The figures below reflect outcomes reported by U.S. power generation facilities operating AI-driven aging infrastructure analytics platforms within their first 24 months of deployment.
Ready to get a clear picture of your aging infrastructure risk? Schedule your plant assessment with iFactory's asset integrity analytics team.
Expert Review: What Aging Infrastructure Analytics Vendors Rarely Tell You
After leading aging infrastructure analytics implementations at more than twenty power plants across the U.S. — coal, gas, and combined cycle — the evaluation mistakes that cost plant owners the most money and time are remarkably consistent. Here is the checklist that separates platforms that actually prevent aging-related catastrophic failures from platforms that produce aging reports nobody reads.
Conclusion
The aging infrastructure challenge at U.S. power plants is not going away — it is accelerating. Every operating year adds another increment of creep damage, another cycle of insulation degradation, another year of corrosion accumulation on equipment that was engineered for a finite service life. The plants that manage this challenge most effectively over the next decade will be those that replace calendar-based inspection programs and age-based replacement schedules with continuous, AI-driven condition monitoring that translates equipment degradation into financial risk — and financial risk into optimally timed capital decisions.
iFactory's aging infrastructure analytics platform is purpose-built for that challenge: connecting to existing plant data systems without control system disruption, integrating historical inspection data with real-time sensor streams, modeling remaining useful life with physics-based degradation models calibrated to each specific asset, and producing the replacement-versus-repair financial analysis that capital planning requires. The platform deploys in weeks, generates actionable findings within the first month, and produces measurable ROI from the first avoided failure event.
Ready to get a clear picture of your aging infrastructure risk? Schedule your plant assessment with iFactory's asset integrity analytics team.
Frequently Asked Questions
Purpose-Built Aging Infrastructure Analytics for Power Plants
From transformer life extension to steam turbine creep monitoring, iFactory delivers AI-driven aging infrastructure intelligence for plants running equipment past design life — deployable in weeks, with ROI measurable from the first avoided failure.