Most power plant maintenance teams have access to the same CMMS reports month after month — MTTR trending slightly up, PM compliance sitting in the high seventies, corrective-to-preventive ratio never quite where should be — but without a clear reference point for what good actually looks like at a comparable facility, those numbers are hard to act on. Industry benchmarks exist, but they are typically buried in NERC reliability reports and utility association surveys, and academic studies that describe fleet-level averages rather than giving plant management the specific KPI targets that should trigger a program review. iFactory's AI-driven analytics platform solves this in two ways: it continuously calculates the plant's actual performance on every major maintenance and reliability KPI using live CMMS and historian data, and it compares that performance against configurable benchmarks drawn from the industry databases and iFactory's own power plant analytics network. The result is not a static benchmark report reviewed annually — it is a live performance dashboard that tells the maintenance team, on any given day, exactly where the plant stands on MTBF, MTTR, PM compliance, corrective work ratio, spare parts availability, and maintenance cost per MWh against the benchmarks that matter for their plant type and age. This guide covers the key KPIs, the industry benchmarks, and how AI-driven analytics accelerates the performance improvement process from benchmark awareness to measurable results. Need to understand where your plant stands right now? Talk to our support team for a benchmarking assessment.
Power Plant AI-driven · KPI Benchmarking · Reliability Performance
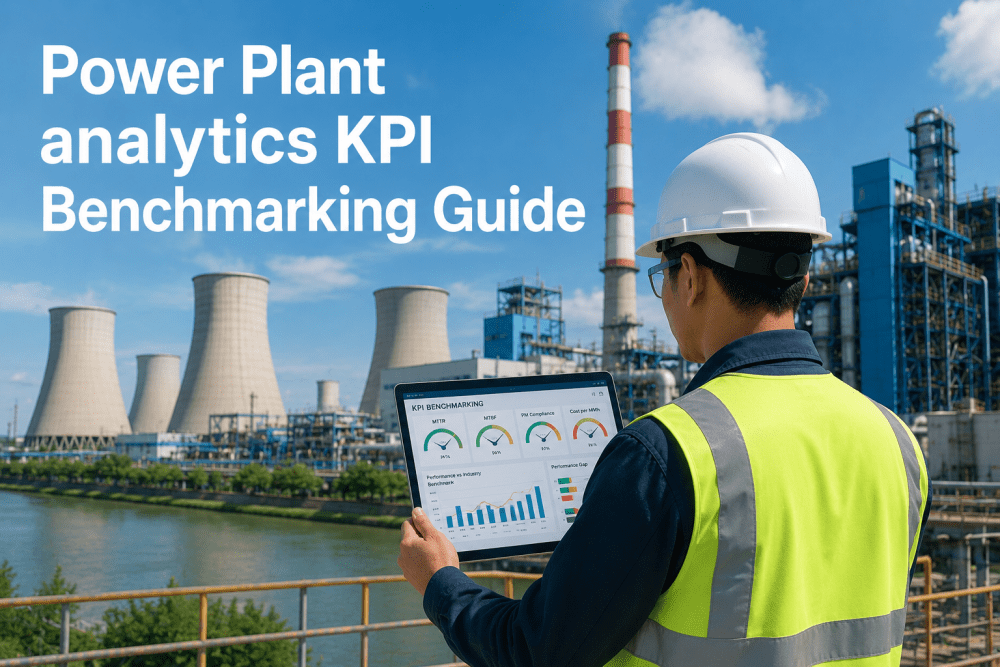
Power Plant Analytics KPI Benchmarking: See Where You Stand. Know What to Fix. Prove the Improvement.
iFactory's AI-driven analytics platform compares your plant's MTTR, MTBF, PM compliance, corrective work ratio, and maintenance cost per MWh against industry benchmarks — live, continuously, on the metrics that distinguish top-quartile performance from the industry average.
Top 25%
of power plants achieve MTBF 3–5× higher than the industry average — the gap is analytics, not equipment
68–85%
PM compliance range between bottom and top quartile plants — top quartile average is 91%+
$4–$14
Per MWh maintenance cost range — top-quartile plants run $4–$6, average plants $9–$14
2.4×
Higher corrective-to-preventive work ratio at plants without AI-driven analytics vs. benchmarked peers
The Benchmarking Gap
Why Most Power Plants Benchmark Annually — and Why That Isn't Fast Enough
The traditional benchmarking cycle at most power plants is a once-a-year activity: pull the annual maintenance data, compare it to the NERC GADS report or EPRI benchmarking survey, identify the gaps, and set targets for next year. By the time the analysis is complete, the data is 12 months old and the performance gaps have already compounded. AI-driven analytics changes this from a backward-looking annual exercise to a continuous forward-looking performance management program.
Annual Benchmark
Data 12 Months Old
Survey data collected. KPI gaps identified. Improvement targets set for next year. By the time action starts, the underlying conditions have already changed.
Quarterly Review
Data 3 Months Old
Maintenance reports reviewed quarterly. Trends visible in arrears. Corrective action taken after gaps have compounded for a full quarter.
AI-Driven — Now
Live Benchmark Comparison
Every KPI calculated from live CMMS and historian data. Benchmark comparison updated continuously. Performance gaps flagged the week they open — not the year after they closed.
Predictive — Next
AI-Forecasted KPI Trajectories
AI models forecast where each KPI is heading based on current trend velocity — flagging benchmark deviations before they materialize, not after they show in the report.
6 Core KPIs
The Power Plant Analytics Benchmark KPIs — What Each Measures and Where Top-Quartile Plants Stand
These six KPIs account for the majority of maintenance and reliability performance variance between top-quartile and average power plants. Each one is calculated automatically in iFactory from CMMS work order data and historian records — no manual extraction required.
KPI 01
Mean Time Between Failures (MTBF)
Average operating time between unplanned failure events per asset class. Top-quartile combined cycle plants run MTBF of 4,200–6,800 hours on major rotating equipment. Average plants run 1,400–2,800 hours. The gap is almost entirely explained by predictive maintenance program maturity and PM compliance — not by equipment differences.
Top-Q: 4,200–6,800 hrs
vs. average 1,400–2,800 hrs on major rotating equipment
KPI 02
Mean Time to Repair (MTTR)
Average elapsed time from failure detection to return to service. Top-quartile plants achieve MTTR of 2.1–3.8 hours on corrective maintenance events; average plants run 6.4–11.2 hours. The primary drivers of MTTR gap are parts availability at time of failure, work order completeness before crews arrive, and technical documentation accessibility.
Top-Q: 2.1–3.8 hrs
vs. average 6.4–11.2 hrs per corrective maintenance event
KPI 03
PM Schedule Compliance
Percentage of scheduled preventive maintenance work orders completed on time vs. planned due date. Top-quartile plants sustain 91–96% PM compliance. Average plants run 68–79%. Plants below 70% PM compliance consistently show 2–3× higher corrective work order volume and 25–40% higher annual maintenance cost than top-quartile peers of similar age and type.
Top-Q: 91–96%
vs. average 68–79% PM completion rate
KPI 04
Corrective-to-Preventive Work Ratio
Ratio of unplanned corrective work orders to planned preventive work orders. Top-quartile plants run a C:P ratio of 0.3–0.5 (30–50 corrective for every 100 preventive). Average plants run 1.1–1.8. A ratio above 1.0 indicates the maintenance program is primarily reactive — spending more labor on fixing failures than preventing them. iFactory calculates this ratio by asset class, flagging asset categories driving the C:P average up.
Top-Q: 0.3–0.5 ratio
vs. average 1.1–1.8 corrective-to-preventive ratio
KPI 05
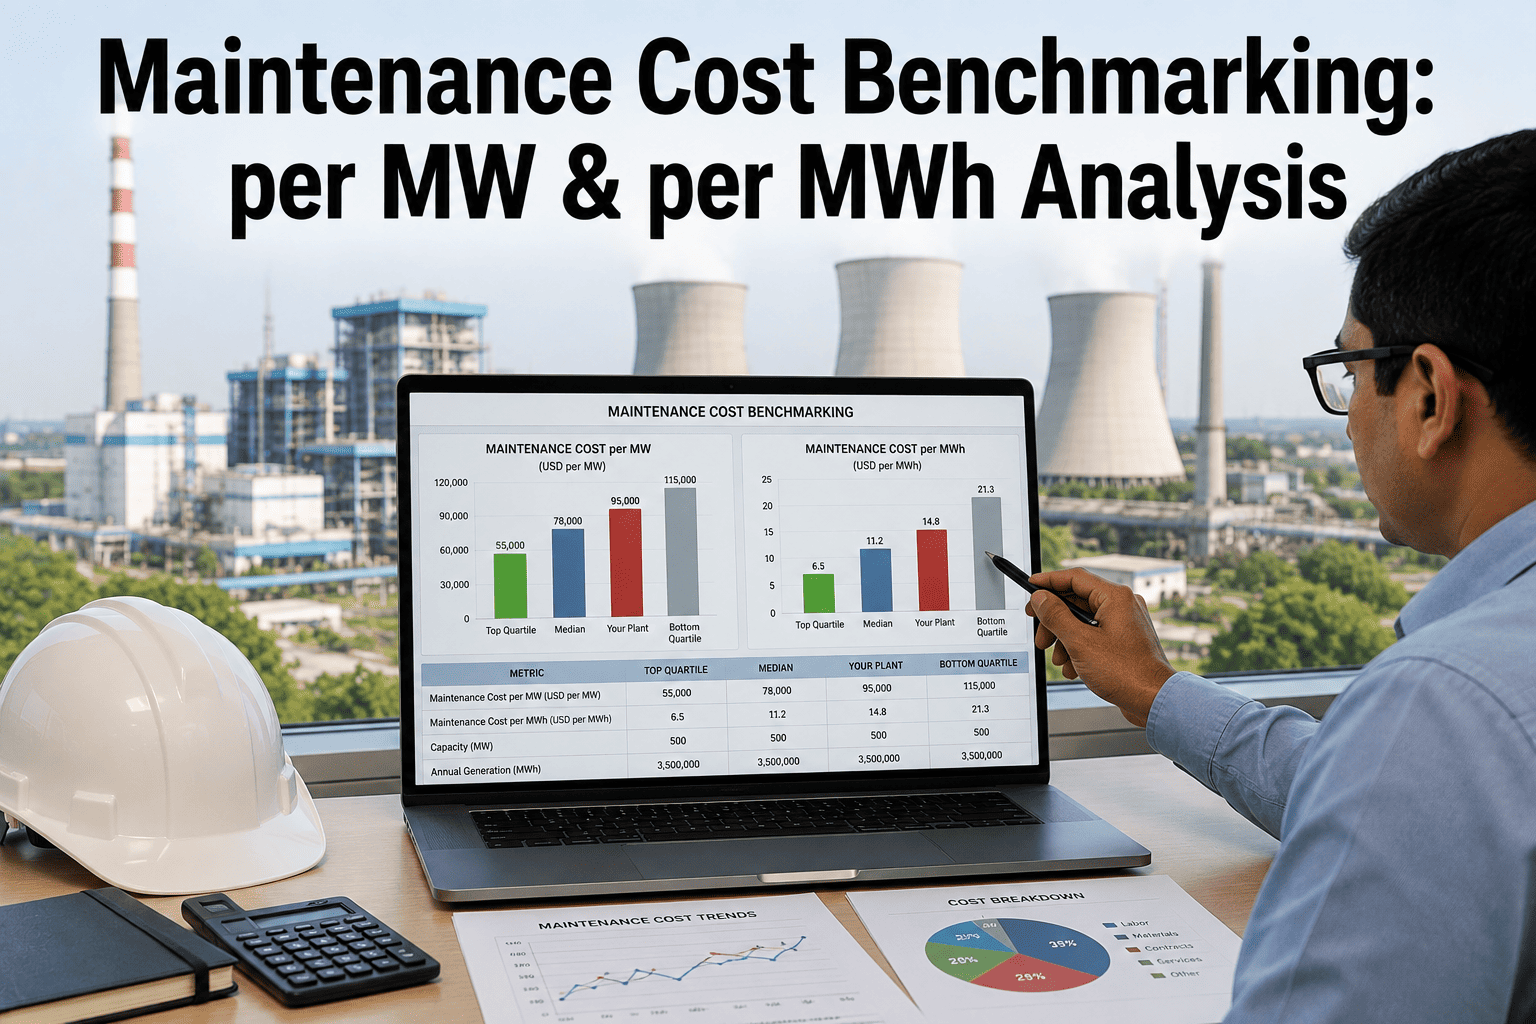
Maintenance Cost per MWh
Total direct maintenance expenditure (labor, parts, contractor) divided by net generation output. Top-quartile combined cycle plants achieve $4.20–$5.80 per MWh. Average plants run $9.10–$13.80 per MWh. Coal plants show wider variance: top-quartile $5.50–$8.00, average $12–$18. This KPI is the most direct financial expression of maintenance program effectiveness and the primary metric used for fleet-level performance comparison.
Top-Q: $4–$6/MWh
vs. average $9–$14/MWh for combined cycle plants
KPI 06
Parts Availability Rate
Percentage of corrective work orders where the required parts were available in the plant warehouse at the time of work order generation — without emergency procurement. Top-quartile plants achieve 94–98% parts availability on corrective events. Average plants run 71–82%. Emergency parts procurement premiums (3–5× standard cost) at average plants account for 12–22% of total annual parts spend.
Top-Q: 94–98%
vs. average 71–82% parts availability at work order generation
The AI Benchmarking Loop
How iFactory Calculates, Compares, and Acts on KPI Benchmarks — Continuously
The value of KPI benchmarking is not in knowing the gap — it is in closing it systematically. iFactory connects the benchmark comparison to the specific analytics actions that move each KPI toward top-quartile performance, closing the loop between measurement and improvement.
CMMS + Historian
Live work order + operating data
KPI Engine
MTBF · MTTR · PM% · C:P · $/MWh
Gap Dashboard
Live benchmark position per KPI
Improvement Actions
PM schedules · PdM alerts · PO triggers
Each improvement action feeds new performance data back into the KPI engine — tightening benchmark gaps continuously rather than waiting for the next annual survey cycle to measure progress.
See Your Plant's Actual KPI Position Against Industry Benchmarks — Live, From Your Existing CMMS Data.
No manual data extraction. No annual survey. No spreadsheet. iFactory calculates MTBF, MTTR, PM compliance, C:P ratio, maintenance cost per MWh, and parts availability from your live CMMS data and shows you exactly where the performance gaps are today.
Performance Tiers
Bottom Quartile vs. Top Quartile Power Plant Analytics Performance — The Defining Differences
Bottom Quartile Plant
Reactive · Underbenchmarked · High Cost
PM compliance below 72% — corrective work volume 2–3× higher than top-quartile peers
C:P ratio above 1.4 — more reactive repair hours than planned maintenance hours
MTTR 6–11 hours — work orders generated without parts confirmed available or procedures attached
Maintenance cost $12–$18/MWh — emergency procurement and overtime labor inflating the run rate
Parts availability below 74% — 20%+ of corrective events require emergency procurement
KPI gaps discovered annually in benchmark survey — 12-month lag between gap formation and corrective action
Top Quartile Plant
Predictive · Benchmarked · Cost-Efficient
PM compliance 91–96% — AI-driven scheduling maintains compliance against actual run hours, not fixed calendar
C:P ratio 0.3–0.5 — predictive maintenance converts most potential failures into planned interventions
MTTR 2.1–3.8 hours — automated work order preparation ensures parts, procedures, and labor ready before crew arrives
Maintenance cost $4–$6/MWh — proactive program eliminates emergency premiums and overtime spikes
Parts availability 94–98% — AI-driven reorder automation ensures parts in stock before work order demand arises
KPI gaps flagged live — benchmark deviations trigger program reviews within days, not months
Industry Benchmark Data
Power Plant Analytics KPI Benchmarks — Where Top, Average, and Bottom Quartile Plants Stand
PM Compliance — Top Quartile Target91–96%
PM Compliance — Industry Average68–79%
Corrective-to-Preventive Ratio — Top Quartile0.3–0.5
Parts Availability at Work Order — Top Quartile94–98%
Maintenance Cost/MWh — Top Quartile (Combined Cycle)$4–$6
MTBF Improvement Achievable with AI-Driven PdM2–4× baseline
Expert Perspective
What Plant Management and Reliability Teams Say About Live KPI Benchmarking
The shift from annual benchmark surveys to continuous AI-driven KPI comparison fundamentally changes how plant management allocates maintenance investment — because it changes the decision-making cycle from annual to weekly.
"We had been running NERC GADS benchmarking every year for about a decade — comparing our forced outage rate and capacity factor to fleet averages, identifying where we were below median, and writing improvement plans that mostly got implemented over the following 18 months. When we moved to continuous KPI tracking with live benchmark comparison, the first thing that changed was the conversation frequency. Instead of one annual benchmark review with the plant manager, we were having weekly discussions about specific KPIs that were drifting away from top-quartile targets. The second thing that changed was the specificity. Annual benchmarks tell you your PM compliance is below median. Live benchmarking tells you it's below median specifically on auxiliary cooling systems, and it drifted 8 percentage points in the last six weeks, and it's correlated with three specific asset classes whose PM intervals were last revised four years ago. That's actionable in a week. The annual version takes 14 months to translate into an action. In the first year of continuous benchmarking we closed the gap on four of our six core KPIs — two of them moved from below-median to top-quartile range. The total maintenance cost impact was $1.8 million against a combined cycle plant of our size. Annual benchmarking told us the gap existed. Continuous benchmarking told us exactly which lever to pull and when."
— Plant Manager, 680 MW Combined Cycle Plant, U.S. Gulf Coast · 22 Years Power Plant Operations · EPRI Performance Benchmarking Committee Member
4 of 6KPIs closed gap in year one
$1.8MMaintenance cost impact
2 KPIsReached top-quartile range
How iFactory Delivers This
The Analytics Layer That Connects Benchmark Data to Program Actions
iFactory calculates all six core KPIs from your live CMMS and historian data — no manual extraction, no spreadsheet. The benchmark comparison dashboard shows your plant's position against top-quartile, median, and bottom-quartile benchmarks for your plant type. When a KPI drifts below your configured benchmark target, iFactory generates an alert with the specific asset classes, work order patterns, or procurement events driving the deviation — so the corrective action is identified at the same time as the gap.
Gap detected → Root cause identified → Action triggered — same day
Conclusion
KPI Benchmarking Is Only Useful When It's Fast Enough to Act On
The power plants in the top performance quartile are not there because they have better equipment. They are there because they track the right metrics continuously, compare them to meaningful benchmarks in real time, and translate performance gaps into specific program actions quickly enough that gaps close before they compound. Annual benchmarking identifies the destination. Continuous AI-driven benchmarking gives the navigation — showing exactly which KPI is drifting, which asset class is causing it, and which program adjustment closes the gap fastest.
iFactory's KPI benchmarking dashboard delivers this continuous comparison from your existing CMMS and historian data — no new sensors, no infrastructure project, and no manual data assembly. The benchmark position is calculated automatically, the gaps are flagged in real time, and the improvement levers are identified at the asset class level rather than the plant average level. Book a Demo to see your plant's current KPI position benchmarked against top-quartile peers for your plant type and age.
Frequently Asked Questions
Power Plant KPI Benchmarking — What Maintenance and Plant Management Teams Ask First
Which industry benchmark databases does iFactory use for power plant KPI comparison?
iFactory's benchmarking framework draws on three benchmark tiers. The primary public benchmarks are sourced from NERC GADS (Generating Availability Data System) for availability and forced outage metrics, EPRI's maintenance benchmarking surveys for maintenance cost per MWh and PM compliance data, and EIA Form 923 data for plant-level generation and fuel consumption. The secondary tier is iFactory's own analytics network benchmark database — anonymized aggregate KPI data from iFactory-connected power plants organized by plant type (combined cycle, coal, peaker, nuclear-adjacent), age tier, and capacity class. The tertiary tier is the plant's own configurable benchmark targets — which the maintenance team can set based on internal improvement goals, utility fleet standards, or PPA performance requirements. All three tiers are independently selectable in the benchmark comparison dashboard.
Book a Demo to see the benchmark database selection applied to your plant type and capacity class.
How accurate are the KPI calculations if the plant's CMMS has data quality issues — missing failure codes, incomplete work order closure, or inconsistent PM categorization?
CMMS data quality is the most common implementation challenge in any KPI benchmarking program, and iFactory addresses it in three ways. First, the platform's natural language processing layer classifies incomplete or inconsistently coded work orders using the free-text description fields — extracting probable failure mode, asset system, and work type from unstructured text where structured fields are blank. Second, iFactory's data quality dashboard scores the completeness of each KPI's underlying data inputs and shows which fields need improvement to increase calculation confidence — giving the maintenance team a prioritized data quality improvement list rather than simply reporting low-confidence calculations. Third, KPI calculations display confidence intervals alongside point estimates — so the maintenance team knows that a calculated MTBF of 2,400 hours is based on 94% complete data versus a calculated MTTR of 4.2 hours based on 67% complete data. Data quality improvement is treated as a program deliverable, not a prerequisite.
How do the benchmark comparisons account for differences in plant age, fuel type, and capacity factor that affect KPI performance expectations?
iFactory's benchmark comparison engine applies five normalization factors to ensure the comparison is meaningful rather than misleading. Plant type (combined cycle, coal, peaker, simple cycle, hydro) is the primary segmentation — maintenance cost per MWh benchmarks for a peaker plant are completely different from a baseload combined cycle. Plant age tier (0–10 years, 10–20 years, 20+ years) adjusts MTBF and corrective work benchmarks for the well-documented degradation curve that increases failure frequency with equipment age. Capacity factor adjusts PM compliance and maintenance cost benchmarks for plants running above or below fleet average utilization. Fuel type adjusts heat rate and combustion-related maintenance benchmarks. Climate zone adjusts auxiliary cooling and freeze-protection maintenance benchmarks for plants in extreme temperature regions. After normalization, the comparison shows the plant's position against genuinely comparable peers — not against a fleet average that includes plants with fundamentally different operating profiles.
Book a Demo to see the normalization factors applied to your plant's specific profile.
How does iFactory connect a KPI gap identification to a specific corrective action in the maintenance program?
KPI gap attribution is the most operationally valuable feature of the benchmarking dashboard — and the one that most differentiates live AI-driven benchmarking from static annual surveys. When a KPI deviates from its benchmark target, iFactory's gap attribution engine analyzes the underlying work order data to identify the specific asset classes, work order types, or procurement events driving the deviation. For example: if PM compliance drops 6 percentage points below target, the attribution engine identifies that 78% of the compliance shortfall is concentrated in three asset categories — auxiliary cooling pumps, instrument air compressors, and lube oil conditioning equipment — and that the primary cause is PM interval misalignment with actual run hours rather than scheduling or labor availability issues. This attribution converts the abstract KPI gap into a specific program adjustment: reconfigure PM intervals for those three asset categories to match actual operating cycle, not OEM defaults. The corrective action is identified at the time of gap detection, not after a separate investigation.
How long does it take for iFactory's KPI benchmarking dashboard to become operational after CMMS integration?
Initial KPI dashboard activation typically takes 3–6 weeks from CMMS integration start for a plant with 12+ months of existing work order history. The integration process establishes the data connection, maps the plant's CMMS data schema to iFactory's KPI calculation framework, runs the initial data quality assessment, and activates the benchmark comparison dashboard with the appropriate normalization factors for the plant type and profile. KPIs with high data completeness are available from day one of activation; KPIs with data quality gaps show confidence intervals and generate the improvement recommendations needed to close those gaps over time. The benchmark comparison is live from activation — showing the plant's initial benchmark position on all six core KPIs against the applicable benchmark tier. For plants with less than 12 months of CMMS history (new units or recent CMMS migrations), iFactory can supplement initial KPI calculations with paper-based historical records or fleet-level data from sister plants.
Book a Demo to receive an activation timeline estimate for your specific CMMS and plant configuration.
Know Where You Stand. Know What to Fix. Prove the Improvement — Live, From Your CMMS Data.
iFactory's KPI benchmarking dashboard calculates MTBF, MTTR, PM compliance, corrective-to-preventive ratio, maintenance cost per MWh, and parts availability from your live CMMS data — comparing each metric against top-quartile, median, and bottom-quartile benchmarks for your plant type, and flagging gaps with specific root cause attribution the same day they open.