Reliability-Centered Maintenance (RCM) was never designed to be a manual framework. When it was formalized in the 1970s for commercial aviation, the core logic was sound: analyze every failure mode by its operational consequencet then assign most cost-effective maintenance task to address it. What the methodology lacked was a mechanism capable of executing that logic at the speed and scale modern power generation demands. AI-driven analytics closes that gap. By embedding RCM methodology into a live data environment — where sensor streams, digital twins, and machine learning models operate continuously — U.S. power plants can transform RCM from a periodic planning exercise into an autonomous, always-on reliability engine. This guide breaks down how that integration works, what it delivers operationally, and how plant leaders can build a realistic path from static RCM documentation to AI-automated execution.
HERO
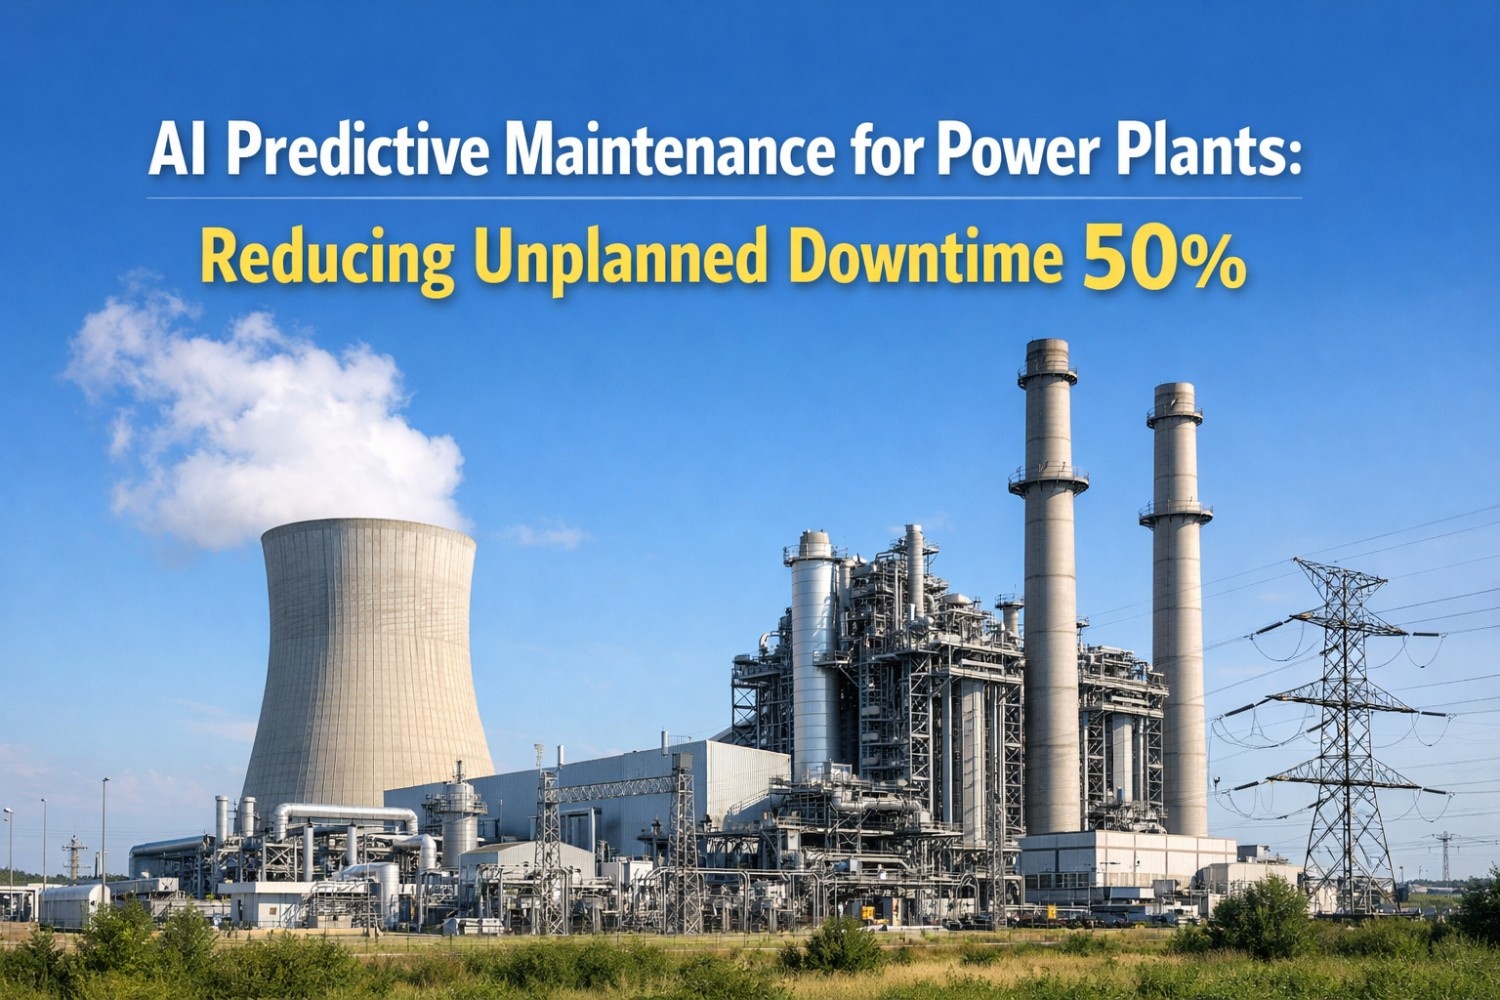
Reliability-Centered Analytics Guide 2026
Reliability-Centered Analytics for Power Plants
How AI-driven analytics automates RCM methodology — from failure mode identification to consequence-based task assignment and continuous execution
73%
Reduction in Undetected Failure Modes
$310K
Avg. Savings Per Avoided Critical Failure
38%
Drop in Preventive Maintenance Waste
2.4x
Faster RCM Analysis vs. Manual Teams
SECTION 1: THE RCM FRAMEWORK
The RCM Framework: Seven Questions That Drive Every Maintenance Decision
RCM methodology is built on a structured decision logic that asks seven fundamental questions about every asset in a generation portfolio. In a traditional implementation, a cross-functional team works through these questions manually — a process that can take months for a single asset class and produces static documentation that ages the moment operating conditions change. AI-driven analytics does not replace this logic; it executes it continuously and at fleet scale.
Q1
What are the functions and performance standards?
Define what each asset is required to do and the performance threshold it must meet. AI platforms establish dynamic performance baselines from historical sensor data — more accurate than design-spec assumptions, especially for assets operating outside their original envelope.
Q2
In what ways can it fail to fulfill its functions?
Identify functional failure modes. Machine learning models trained on vibration, temperature, and pressure data surface failure signatures that manual analysis routinely misses — particularly in early-stage degradation before operator-detectable symptoms appear.
Q3
What causes each functional failure?
Trace each failure mode to its root cause mechanism. AI fault trees link sensor anomaly patterns to specific physical failure mechanisms — bearing wear, insulation degradation, erosion — with causal confidence scores rather than binary alerts.
Q4
What happens when each failure occurs?
Describe the failure effect on operations, safety, and output. Digital twins simulate failure progression under current operating conditions, giving engineers a quantified picture of consequence before the physical event occurs.
Q5
In what way does each failure matter?
Classify consequence: safety, environmental, operational, or non-operational. AI platforms map sensor-detected anomalies directly to consequence categories, enabling automatic prioritization without manual triage at each event.
Q6
What can be done to prevent each failure?
Identify proactive maintenance tasks — condition monitoring, scheduled restoration, scheduled discard. Predictive models generate task recommendations based on real-time degradation rate, not calendar intervals, eliminating both over-maintenance and under-maintenance simultaneously.
Q7
What if no proactive task can be found?
Default actions: redesign, run-to-failure with consequence mitigation, or one-time changes. AI platforms flag assets where no predictive signature is detectable and recommend appropriate default strategies — preventing the most costly default: doing nothing while assuming the asset is covered.
iFactory's AI-driven analytics platform executes RCM methodology continuously across your entire asset fleet — from failure mode detection to consequence-based task assignment. Book a technical demo to see how your current FMEA documentation maps to live AI execution.
SECTION 2: FAILURE MODE CRITICALITY
Failure Mode Identification and Criticality Ranking: Where AI Changes the Equation
The analytical bottleneck in traditional RCM is failure mode identification. A manually assembled FMEA (Failure Mode and Effects Analysis) for a combined-cycle generation facility can document several hundred failure modes — but only captures the modes the team knows to look for. AI-driven analytics expands that coverage by surfacing statistically anomalous patterns in sensor data that correspond to failure mechanisms no analyst anticipated. The second bottleneck is criticality ranking. Static FMEA matrices assign risk priority numbers based on estimated severity, occurrence, and detectability. Those numbers are point-in-time judgments that do not update as asset condition, operating profile, or fleet failure history evolves. AI platforms replace static RPNs with dynamic criticality scores that recalculate continuously as new data arrives.
Dimension
Traditional RCM / FMEA
AI-Driven RCM Analytics
Failure Mode Coverage
Limited to known failure modes documented by the team; misses novel degradation signatures
Unsupervised ML identifies anomaly clusters corresponding to undocumented failure mechanisms
Criticality Assessment
Static RPN scores assigned during FMEA workshop; updated annually at best
Dynamic criticality scores recalculated continuously from live sensor data and fleet failure history
Analysis Cycle Time
3–6 months per major asset class with dedicated reliability engineering team
Continuous; new anomaly signatures scored and classified within minutes of detection
Task Assignment
Manual CMMS work order creation based on static maintenance intervals
Automated work order generation triggered by condition thresholds, pushed directly to CMMS
Fleet Learning
Failure knowledge siloed by site; no systematic cross-asset pattern sharing
Fleet-wide failure patterns train shared models; a failure at Site A improves detection at Sites B and C
Documentation Burden
Substantial manual documentation effort; FMEA often outdated before next review cycle
Automated audit trail of every anomaly, classification, and action — always current, audit-ready
iFactory's AI-driven analytics platform executes RCM methodology continuously across your entire asset fleet — from failure mode detection to consequence-based task assignment. Book a technical demo to see how your current FMEA documentation maps to live AI execution.
SECTION 3: CONSEQUENCE CATEGORIES
Consequence-Based Task Assignment: Matching Maintenance Intensity to Failure Impact
The defining principle of RCM is that maintenance resources should be allocated proportional to the consequence of failure — not the age of the asset or the convenience of the maintenance schedule. AI-driven platforms operationalize this principle by classifying every detected anomaly into a consequence category and then triggering the appropriate response automatically. The four consequence categories in RCM methodology map directly to the response tiers that an AI platform should execute.
Category A — Highest Priority
Safety and Environmental Consequence
Failures with direct potential for personnel injury, equipment destruction, or environmental violation. In power generation, this category typically covers main transformer failure, high-pressure turbine blade fracture, and hydrogen seal system degradation on generators. AI platforms assign maximum detection sensitivity to these failure modes — running continuous monitoring with anomaly thresholds set well below alarm levels to maximize warning lead time. Automated escalation protocols trigger immediate operator notification, protective action recommendations, and CMMS work order creation without human initiation. The cost justification for intensive monitoring in this category is not ROI-driven — it is regulatory and operational survival.
Common Power Plant Examples
H2 seal system degradationMain transformer thermal runawayHigh-pressure turbine blade wearGas system overpressureControl system cybersecurity breach
AI Platform Response
Continuous anomaly scoring at maximum sensitivity; automated protective action triggers; immediate multi-channel operator alert; digital twin failure progression simulation; regulatory notification workflow initiation
Category B — High Priority
Operational Consequence
Failures that do not directly threaten safety but produce measurable loss of generation capacity, output quality, or dispatch capability — all of which have direct revenue impact. Cooling system degradation, heat recovery steam generator tube fouling, and gas turbine compressor wash intervals fall into this category for most combined-cycle facilities. AI platforms optimize task timing for operational consequence failures based on the economic trade-off between degradation cost accumulation and the production impact of the maintenance window. Digital twins are particularly valuable here — they quantify the efficiency penalty of continued operation against the cost of forced derate or outage, enabling planners to choose the economically optimal intervention point rather than defaulting to fixed intervals.
Economic optimization of intervention timing; digital twin efficiency penalty quantification; automated scheduling recommendation in CMMS; remaining useful life projection with confidence intervals
Category C — Standard Priority
Non-Operational Consequence
Failures that have no immediate safety, environmental, or production impact but do create repair costs and maintenance resource demand. Auxiliary system components — pumps, fans, HVAC, lighting — typically fall into this category. The RCM principle here is cost minimization: allocate only the monitoring and maintenance intensity needed to manage repair cost, without over-investing in predictive infrastructure for assets whose failure consequence is minor. AI platforms handle non-operational consequence assets through lower-frequency monitoring cycles and simplified anomaly detection models, reserving full analytical depth for higher-consequence asset classes. This tiered resource allocation is one of the most concrete ways AI-driven RCM reduces total maintenance cost per MWh.
Common Power Plant Examples
Auxiliary cooling fansSecondary instrumentationHVAC systemsLighting and facility systemsNon-critical pumps
AI Platform Response
Reduced monitoring frequency; simplified anomaly thresholds; cost-optimized maintenance intervals; batch work order grouping to minimize trip costs
Category D — Critical Detection
Hidden Failure Consequence
Failures that are not detectable during normal operations — typically protective devices, backup systems, and redundant safety circuits. These failures are the most dangerous category in RCM methodology because the asset appears functional until the primary system it protects fails, at which point both systems are unavailable simultaneously. In power generation, emergency shutdown systems, backup cooling circuits, and protection relay logic fall into this category. AI platforms address hidden failures through automated functional testing schedules and by monitoring the health indicators that precede hidden failure events — capacitor charge levels, relay response times, and backup circuit insulation resistance — even when the protection system appears operationally inactive.
Automated functional test scheduling; health indicator monitoring during standby state; protection system availability tracking; automatic test result logging for NERC CIP compliance documentation
iFactory's AI-driven analytics platform executes RCM methodology continuously across your entire asset fleet — from failure mode detection to consequence-based task assignment. Book a technical demo to see how your current FMEA documentation maps to live AI execution.
SECTION 4: IMPLEMENTATION WORKFLOW
RCM-to-Analytics Implementation Workflow: From Static Documentation to Live Execution
The practical challenge for most U.S. power plants is not understanding the value of AI-driven RCM — it is translating existing RCM documentation, FMEA spreadsheets, and maintenance procedures into a live analytics framework without disrupting current operations. The workflow below reflects a validated sequencing approach for facilities that already have some RCM documentation in place and want to convert it into an automated execution layer.
01
Phase 1 — Months 1–2
RCM Documentation Audit and Asset Criticality Ranking
Inventory all existing FMEA documentation, maintenance procedures, and historian failure event records. Map documented failure modes to sensor data streams — identifying which failure mechanisms already have detectable sensor signatures and which require additional instrumentation. Establish a formal asset criticality ranking using a weighted scoring matrix that incorporates consequence category, failure frequency, and current detection capability. This ranking becomes the deployment priority sequence for the AI platform.
Sensor Infrastructure Completion and Data Pipeline Establishment
Deploy supplemental sensors identified in the gap analysis. Integrate existing historian, SCADA, and DAS streams into a unified data pipeline using OPC-UA or MQTT normalization. Establish consistent asset tagging conventions across all data sources — the single most common cause of AI model underperformance is inconsistent tagging that fragments what should be a unified asset signal. Validate data quality on all instrumented failure mode signatures before AI model training begins.
Output: Unified real-time data stream; validated sensor coverage for all Tier 1 failure modes
03
Phase 3 — Months 4–7
AI Model Training on RCM-Mapped Failure Signatures
Train fault detection models using historical sensor data aligned to documented failure events. Feed existing FMEA failure mode descriptions into the model training framework as supervised labels — dramatically accelerating the transition from generic anomaly detection to RCM-specific fault classification. For failure modes without historical event data, deploy unsupervised anomaly detection on 90-day clean baselines. Validate model accuracy against held-out historical failure events; target 90%+ detection rate with false positive rate under 5% before production deployment.
Output: Validated AI fault detection models mapped to RCM failure mode library; live anomaly scoring active
04
Phase 4 — Months 7–10
Consequence-Based Response Automation and CMMS Integration
Configure consequence-tier response protocols: define automated escalation paths, alert routing, and CMMS work order generation rules for each consequence category. Integrate the AI platform with existing CMMS (IBM Maximo, SAP PM, Oracle eAM) via bidirectional API — AI-generated work orders flow into the maintenance queue, and completed work records flow back to update asset history and retrain models. Establish approval workflows for automated actions, starting with low-consequence categories and expanding based on operator confidence in model accuracy.
Output: Automated RCM task assignment active; CMMS bidirectional integration live; consequence-tiered response protocols in production
05
Phase 5 — Months 10–12
Digital Twin Integration and Scenario-Based Maintenance Planning
Deploy physics-based digital twins for the highest-criticality assets in the RCM register — typically main turbines, generators, and critical transformers. Synchronize twins with live sensor feeds. Commission scenario modeling workflows for maintenance planning: reliability engineers can now run what-if simulations on the twin — quantifying the consequence of deferred maintenance, the risk of alternative operating configurations, and the projected remaining useful life under current degradation trajectories — before committing to physical action.
Output: Digital twins live on Tier 1 assets; scenario-based RCM planning active; full AI-driven RCM execution layer operational
06
Month 12+
Continuous RCM Refinement and Fleet Learning
The RCM framework becomes self-improving. Every avoided failure, every completed work order, and every confirmed fault detection feeds back into model retraining. Fleet-level analytics surface failure patterns across sites — a bearing failure mode identified at one gas turbine improves early detection on identical units across the portfolio. Reliability engineers shift from manual FMEA updates to reviewing AI-flagged failure mode candidates and approving model updates. The RCM document becomes a living system, not a periodic deliverable.
iFactory's AI-driven analytics platform executes RCM methodology continuously across your entire asset fleet — from failure mode detection to consequence-based task assignment. Book a technical demo to see how your current FMEA documentation maps to live AI execution.
SECTION 5: METRICS AND ROI
RCM Analytics Performance Metrics: What to Measure and Why
One of the most common mistakes in AI-driven RCM deployment is measuring the wrong outcomes. Technology adoption metrics — model uptime, alert volume, dashboard usage — tell you whether the platform is running, not whether it is working. The metrics below are the operational KPIs that directly validate whether AI-driven RCM is executing its core purpose: matching maintenance intensity to failure consequence and reducing the total cost of unreliability.
Failure Detection
Fault Detection Rate
Target: >90%
Percentage of actual failure events preceded by an AI-generated alert. The primary validation metric for RCM-mapped fault detection models.
False Positive Rate
Target: <5%
Percentage of alerts that do not correspond to actual fault conditions. High false positive rates erode operator trust and lead to alarm fatigue — the failure mode of the analytics system itself.
Mean Warning Lead Time
Target: >14 days
Average time between first AI alert and actual failure event. Longer lead times allow planned maintenance windows rather than emergency response.
Maintenance Efficiency
PM Task Elimination Rate
Target: 25–40%
Percentage of calendar-based preventive maintenance tasks eliminated or extended after AI-driven RCM confirms they address failure modes without detectable precursors or with minimal consequence.
Condition-Based Task Coverage
Target: >70%
Percentage of maintenance tasks triggered by condition data rather than calendar intervals. Tracks the shift from time-based to condition-based maintenance execution.
Maintenance Cost per MWh
Target: −25% vs. baseline
Total O&M expenditure divided by net generation. The composite outcome metric for maintenance efficiency — captures both avoided emergency costs and eliminated unnecessary PM spend.
Reliability Outcomes
Forced Outage Rate
Target: −40% vs. baseline
Unplanned generation loss hours divided by available generation hours. The headline reliability metric — directly reflects whether RCM failure mode coverage is translating into avoided events.
MTTR (Mean Time to Repair)
Target: −50% vs. baseline
Average time from failure detection to full restoration. AI-driven fault identification and digital twin diagnostics reduce MTTR by eliminating diagnostic uncertainty before the maintenance crew arrives.
Asset Remaining Useful Life Accuracy
Target: ±15% of actual
Accuracy of digital twin RUL projections vs. actual failure timing. Validates the planning value of scenario-based maintenance decisions and justifies capital deferral decisions.
iFactory's reporting layer tracks all six RCM performance dimensions automatically — delivering live KPI dashboards, compliance-ready audit trails, and continuous model accuracy reporting without manual data compilation. Book a platform walkthrough to see the analytics layer in a generation environment comparable to yours.
EXPERT REVIEW
Expert Review
Marcus T., Senior Reliability Engineer
Combined-Cycle and Peaker Fleet, Mid-Atlantic Region
"We had a solid RCM program on paper — two years of FMEA documentation, a criticality register, and a maintenance strategy library that our reliability team had spent considerable effort developing. The problem was that the documentation was essentially a snapshot from the last review cycle. By the time a failure mode moved from 'theoretical' to 'actively degrading,' our FMEA hadn't been updated to reflect it, so the maintenance response was still the original calendar-based interval, not a condition-based intervention. When we integrated iFactory's AI platform with our RCM library, the first thing that changed was detection lead time. We started seeing confirmed anomaly signatures on failure modes that our FMEA had classified as 'low occurrence probability' — which just meant we hadn't documented enough historical events to calibrate the probability correctly. In the first eight months, the AI flagged four developing fault conditions that matched RCM failure modes we had de-prioritized. Two of those resulted in planned interventions that avoided what our reliability team estimated would have been forced outage events. The more meaningful long-term change has been in how we approach FMEA updates. Instead of a scheduled six-month review cycle, our RCM documentation now updates dynamically as the AI identifies new failure signatures and the fleet learning layer confirms patterns across sites. Our reliability engineers spend less time maintaining the document and more time using it."
4
Fault Events Caught Early in 8 Months
2
Forced Outages Avoided
Dynamic
FMEA Now Self-Updating
CTA SECTION 2
Ready to Convert Your RCM Documentation Into a Live Analytics Execution Layer?
iFactory maps your existing FMEA failure modes directly to AI detection models — accelerating deployment and preserving the reliability engineering investment your team has already made. Get a site-specific RCM integration assessment for your asset mix.
No. A complete FMEA accelerates AI model training by providing labeled failure mode descriptions, but it is not a prerequisite for deployment. Unsupervised anomaly detection models can begin delivering value from 90 days of clean baseline sensor data — identifying statistically anomalous patterns regardless of whether those patterns are already documented in an FMEA. As AI-detected anomalies are confirmed and classified, they populate the RCM failure mode library dynamically. Plants without existing FMEA documentation often find that the AI-first approach surfaces failure modes that a manual FMEA workshop would have missed entirely, particularly for assets with limited failure history in the operating record.
Not every failure mode has a detectable sensor signature, and a well-implemented AI-driven RCM framework acknowledges this explicitly. For failure modes with no viable condition monitoring approach, the platform flags them for default action assignment — the RCM decision logic for non-detectable failures. This typically means either scheduled restoration or discard tasks at intervals determined by failure probability data, or a run-to-failure strategy with pre-planned consequence mitigation if the failure's operational impact is low enough to justify it. The AI platform's role in these cases is administrative: tracking task compliance, logging completion, and updating asset history. It does not attempt to force condition-based monitoring onto failure mechanisms where physics does not support it.
Predictive maintenance is a detection capability — it identifies that something is degrading and alerts an operator. AI-driven RCM is a decision framework — it identifies what is degrading, classifies the failure mode and its consequence, determines the appropriate maintenance response based on RCM decision logic, and executes that response automatically in the CMMS. Predictive maintenance tells you a bearing is failing. AI-driven RCM tells you it is a Category B operational consequence failure, assigns a condition-based inspection task with the appropriate priority level, routes it to the correct maintenance team, and logs the event in the asset history for model retraining. The distinction matters operationally: predictive maintenance still depends on human judgment at every decision point; AI-driven RCM automates the decision logic and reserves human judgment for exception management.
AI-driven RCM platforms create continuous, timestamped audit trails of every failure mode detection, consequence classification, task assignment, and maintenance execution event. For NERC FAC-001, FAC-002, and TOP standards, the platform's automated documentation demonstrates that facility ratings are continuously verified against actual operating conditions — not just at annual review. For NERC MOD standards, digital twin scenario modeling provides documented evidence of operational capability assessments. The platform's automated protective relay testing schedules and completion logs directly support NERC PRC compliance. Compared to manual documentation practices, AI-driven RCM platforms reduce audit preparation time from days to hours and virtually eliminate the data gaps that generate audit findings.
AI-driven RCM shifts the reliability engineer's role rather than replacing it. The platform automates high-volume, repetitive analytical tasks — anomaly scoring, failure mode classification, routine task assignment — and surfaces the exceptions that require human expertise: novel failure signatures that do not match existing RCM categories, consequence classifications where engineering judgment must weigh competing factors, and capital planning decisions informed by digital twin projections. Reliability engineers in AI-driven environments consistently report that their domain expertise is applied to higher-leverage decisions, and that their institutional knowledge is captured more effectively because the AI framework forces explicit failure mode documentation rather than allowing expertise to remain tacit. The professional development trajectory shifts toward model oversight, scenario interpretation, and strategic asset planning — a more analytically demanding and professionally rewarding role than manual FMEA documentation maintenance.
CONCLUSION
Conclusion: RCM Methodology Is Only as Effective as the System That Executes It
Reliability-Centered Maintenance has always been sound in theory. The constraint was never the analytical framework — it was the execution layer. Manual FMEA workshops produce documentation that ages faster than it can be updated. Calendar-based task intervals apply average maintenance intensity to every asset regardless of its actual condition. And consequence classifications made during a quarterly planning meeting do not adapt when an asset's degradation rate accelerates between review cycles.
AI-driven analytics provides the execution layer that RCM methodology was always missing. When machine learning models run continuously against live sensor data, when digital twins simulate failure progression before it occurs, and when consequence-based task assignment happens automatically rather than waiting for a human triage cycle — the gap between RCM theory and operational reality closes. U.S. power plants that make this transition do not simply improve their maintenance metrics. They build a compounding operational advantage: a system that gets more accurate with every failure event, every completed work order, and every month of accumulated fleet data. The plants that convert their RCM documentation into a live analytics execution layer in 2026 will be operating with a measurably different cost and reliability profile than those that do not within 18 months.
Ready to Turn Your RCM Framework Into an Autonomous Analytics Engine?
Get a site-specific RCM analytics readiness assessment — including an ROI model based on your asset criticality register, current FMEA coverage, and historical forced outage profile. No obligation, no generic demo.