Most power plants send oil samples to an external lab, wait 5 to 10 business days for results, receive a PDF report, and then manually re-enter those findings into a CMMS work order — if they act on them at all. The rotating equipment that oil analysis is designed to protect is degrading silently between the sample date and the moment someone finally reviews the report The gap between a contaminated oil sample and a corrective maintenance action is where bearing failures, gear damage, and compressor wear escalate from manageable to catastrophic.
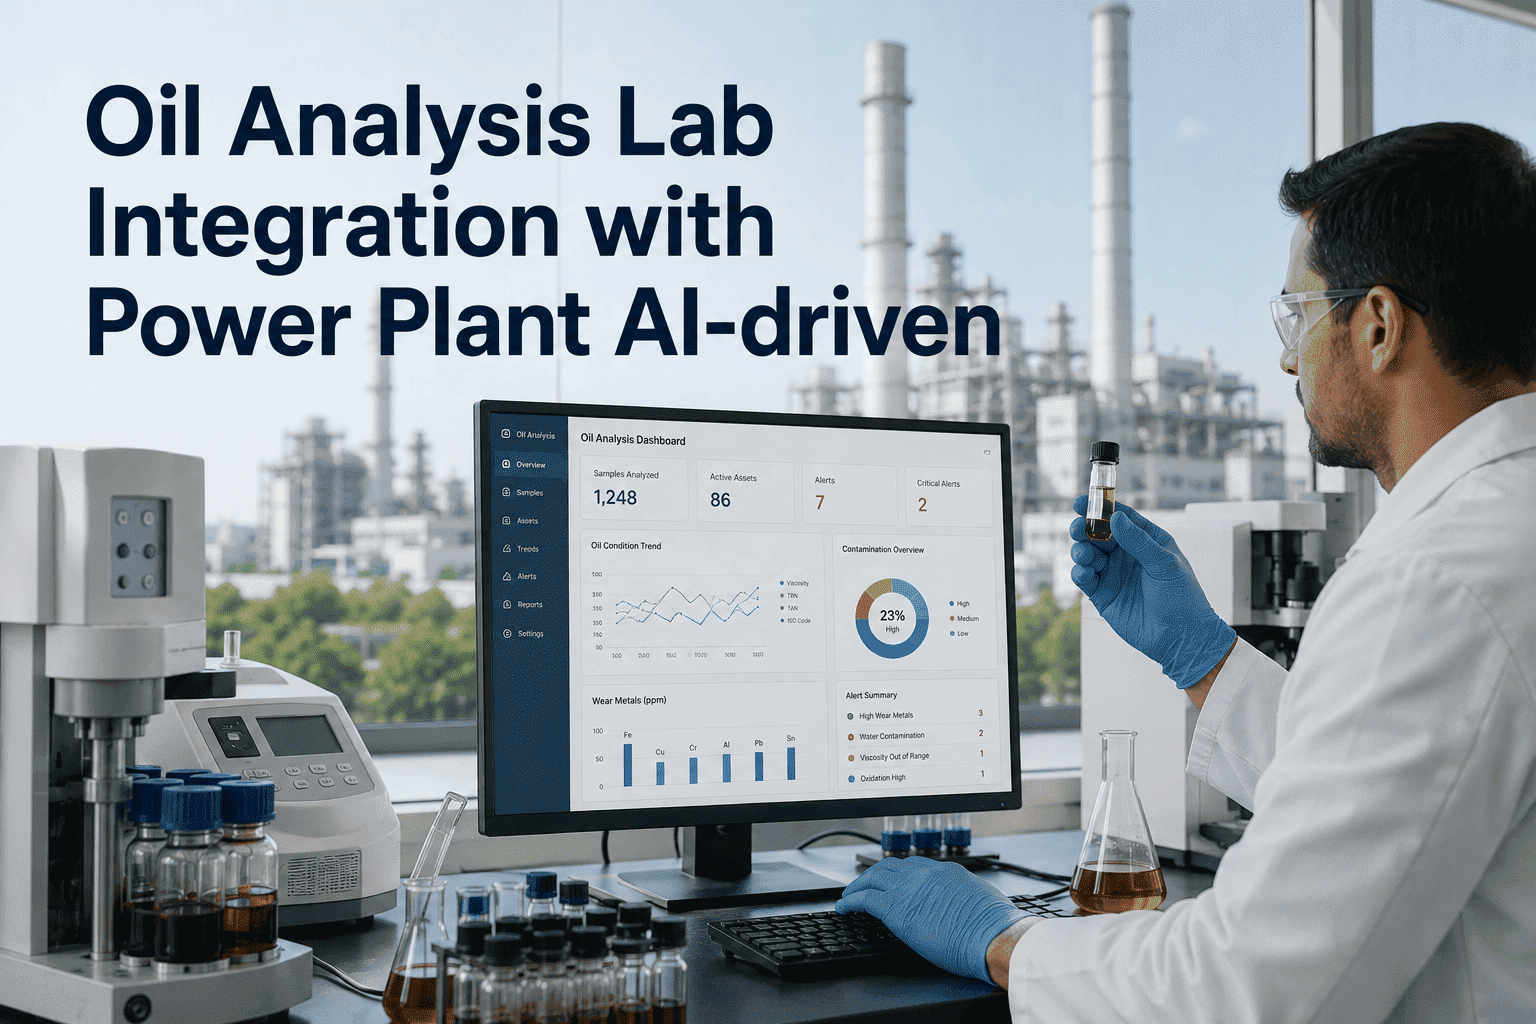
Oil analysis has been a proven predictive maintenance discipline for decades. The data it generates — viscosity trends, particle counts, water contamination levels, additive depletion rates, and wear metal signatures — is among the most reliable early-warning intelligence available for rotating equipment health. Yet in most power plants, that data sits in lab PDFs and email inboxes, disconnected from the CMMS, disconnected from the DCS historian, and disconnected from any automated alerting that could turn a rising iron particle count into a scheduled inspection before it becomes an unplanned outage. AI-driven oil analysis integration changes that architecture entirely — automating result ingestion, trend alerting, contamination tracking, and work order generation from a single connected platform.
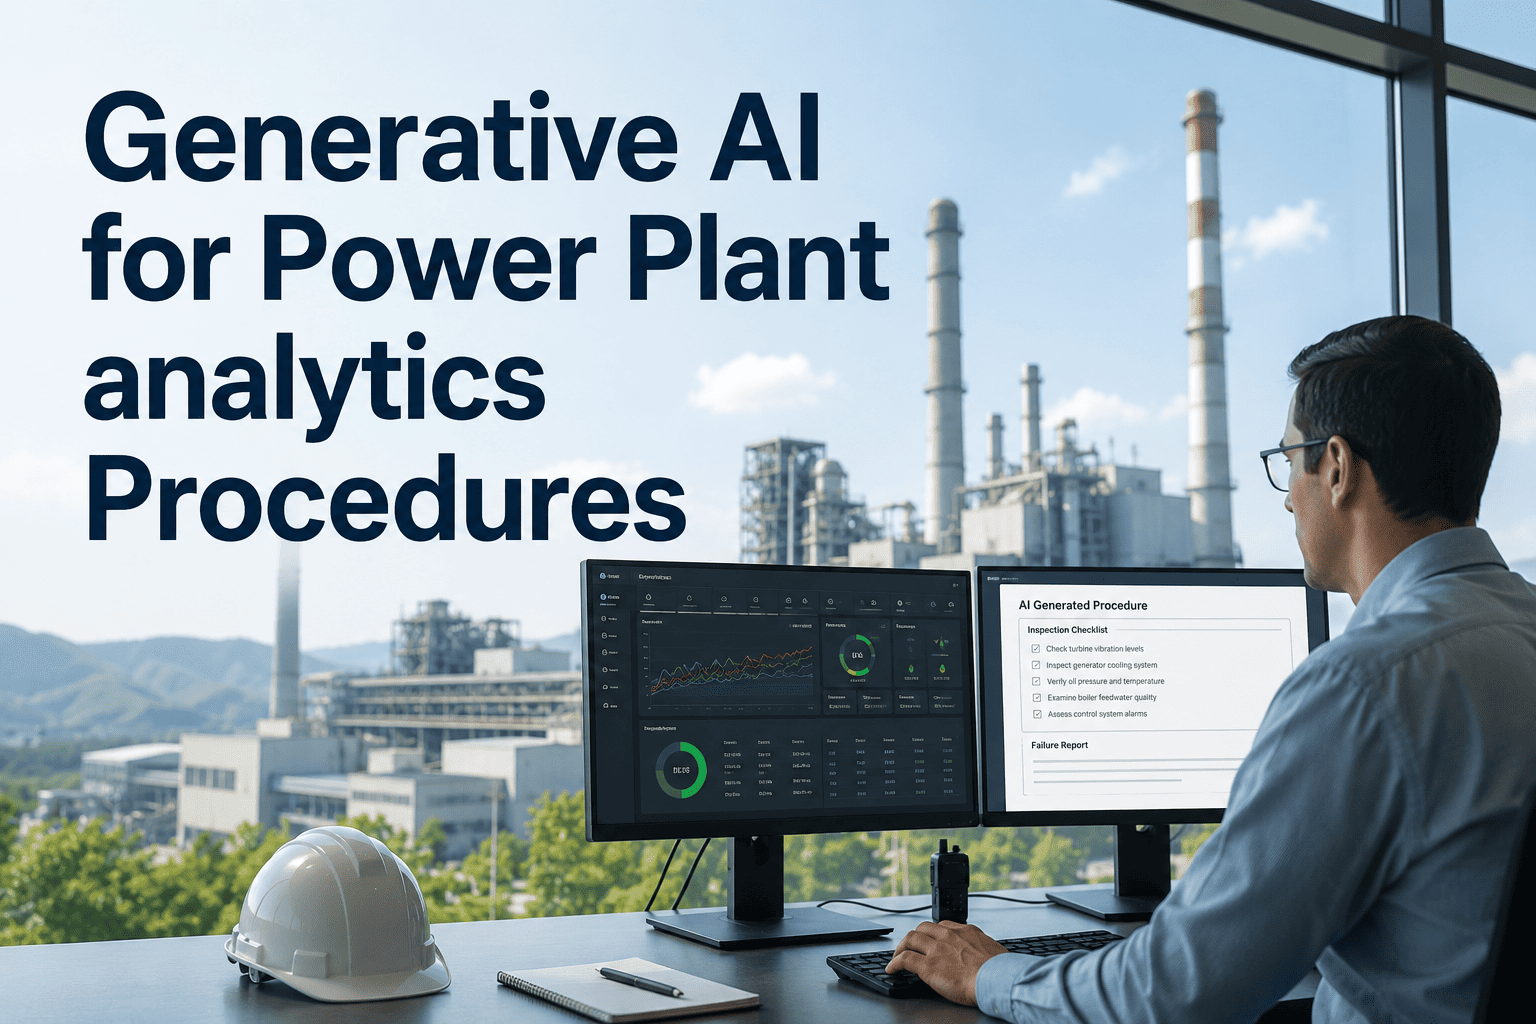
Oil Analysis Lab Integration with Power Plant AI-Driven Maintenance
Automate oil sample result ingestion, trend alerting, and contamination tracking inside your AI-driven platform — extending rotating equipment life and preventing lubrication-related failures before they reach the shop floor.
Why Oil Analysis Data Never Reaches the Maintenance Decision Layer
The problem with oil analysis at most power generation facilities is not the quality of the laboratory science — it is the last mile between lab results and maintenance action. Samples are collected on a schedule, shipped or couriered to an external lab, and results are returned in PDF format to a single inbox, often belonging to a reliability engineer who may be managing dozens of other data streams simultaneously. The workflow from that point forward depends entirely on individual attention and manual effort.
The consequence of this disconnection is systematic. Each result that arrives as a standalone PDF carries no memory of the previous six samples on the same asset. There is no automated comparison to the established baseline, no alert when iron particle counts cross the action threshold, and no linkage to the maintenance history that would tell a reliability engineer whether the trending wear signature matches the component replaced eighteen months ago. AI-driven integration provides that institutional memory automatically — ingesting every result, building the trend baseline, and alerting the right person with the right context the moment a parameter crosses its action limit.
Lab Results as Isolated PDFs
When oil analysis results arrive as standalone PDF files, there is no mechanism to compare them to historical baselines, flag anomalies automatically, or trigger any downstream action. Each report exists in isolation from every previous report on the same asset.
No Automated Threshold Alerting
ISO and OEM wear metal action limits are known quantities, but without automated comparison against incoming lab data, breaching a limit only produces a response if someone manually reviews every result against every threshold for every asset — a task that is reliably incomplete under operational workload.
Trend Blindness Across Sample Intervals
A single elevated iron reading may not require immediate action. A four-sample trend of progressively rising iron concentration almost certainly does. Without automated trending across sample history, the pattern is invisible — and the failure mode it represents is already progressing.
Disconnection from CMMS Work Orders
Even when a reliability engineer identifies an actionable finding, manually creating a CMMS work order with the correct asset ID, sample date, parameter values, and recommended action scope adds friction that frequently gets deferred — especially during high-activity operational periods.
Want to see how oil analysis integration applies to your specific lab partnerships and rotating equipment portfolio? Book a 30-minute technical assessment with iFactory's reliability analytics team.
How AI-Driven Oil Analysis Integration Works: The Technical Architecture
Connecting an oil analysis lab program to an AI-driven maintenance platform requires handling three distinct data flows: structured result imports from lab partners, automated threshold evaluation against asset-specific baselines, and bidirectional communication with the CMMS to generate and track corrective work orders. The following workflow maps how a purpose-built integration handles each layer without requiring changes to existing lab partnerships or sample collection procedures.
Automated Lab Result Ingestion via API or Structured File Import
The platform connects to major oil analysis laboratory partners — including Bureau Veritas, Intertek, Polaris Laboratories, and others — via direct API integration or structured XLSX/CSV file import. Results are ingested automatically as they are released by the lab, eliminating the manual PDF review step entirely. For labs without API capability, a monitored email folder integration captures PDF reports and extracts structured data using document parsing — no manual re-entry required.
Asset Mapping and Sample Chain Association
Each ingested result is mapped to the specific asset in the equipment hierarchy using sample point IDs, equipment tags, or asset numbers drawn from the existing CMMS asset register. This mapping links every new result to the complete sample history for that asset — building the longitudinal dataset that makes trend analysis possible. Assets with multiple sample points (main bearing, gearbox, hydraulic reservoir) are tracked independently with separate baseline profiles.
Multi-Parameter Threshold Evaluation and Trend Scoring
Incoming results are evaluated simultaneously against three reference frameworks: ISO 4406 cleanliness codes for particle contamination, OEM-specified wear metal limits for the asset class, and the asset's own established baseline range derived from its historical sample population. The AI trend scoring layer evaluates the rate of change across the last three to eight samples — distinguishing a stable elevated reading from an accelerating wear signature that indicates active component degradation.
Contamination Source Classification
When contamination is detected, the platform classifies the probable source using the wear metal signature pattern — distinguishing iron-dominant signatures consistent with ferrous component wear from silicon-dominant signatures indicating external particulate ingress, from copper-dominant signatures pointing to bearing cage or bushing degradation. This classification drives the recommended inspection scope in the generated work order, directing technicians to the most probable failure location rather than a generic inspection.
Automatic Work Order Generation with Full Sample Context
Results that breach action thresholds or exhibit concerning trend trajectories automatically generate draft work orders in the connected CMMS — pre-populated with asset identification, sample date, the specific parameters that triggered the alert, the trend context from prior samples, the contamination source classification, and the recommended inspection or corrective action scope. Supervisors receive a mobile push notification with one-tap approval. Time from lab result release to actionable CMMS work order drops from days to under fifteen minutes.
Sampling Interval Optimization and Fleet-Level Reporting
Over time, the platform analyzes the historical relationship between sampling frequency and detection lead time for each asset class — recommending interval adjustments that increase detection sensitivity on high-risk assets while reducing unnecessary sampling on assets with consistently clean histories. Fleet-level contamination reports identify systemic issues (seal failures across a turbine fleet, lube system contamination in a common supply header) that are invisible when results are reviewed asset by asset in isolation.
Want to see how oil analysis integration applies to your specific lab partnerships and rotating equipment portfolio? Book a 30-minute technical assessment with iFactory's reliability analytics team.
Lab Partner Compatibility and Integration Methods
Compatibility with existing lab relationships is the first operational question plant reliability teams ask when evaluating oil analysis integration platforms. A purpose-built integration should support the major commercial laboratory partners serving U.S. power generation facilities, along with in-house lab data management systems, without requiring plants to change their sampling procedures or renegotiate lab contracts.
| Lab Partner / Data Source | Integration Method | Parameters Ingested | Result Latency | Typical Setup Time |
|---|---|---|---|---|
| Bureau Veritas | Direct API — result push on release | Full wear metals, viscosity, particle count, water, TAN/TBN | Real-time on lab release | 2–4 days |
| Intertek Caleb Brett | API + CSV scheduled export | Wear metals, viscosity, cleanliness code, water, oxidation | Within 1 hour of release | 3–5 days |
| Polaris Laboratories | API integration (LubeWare) | Full elemental analysis, PQ index, viscosity, water % | Real-time on lab release | 2–3 days |
| TestOil / OELCHECK | Structured CSV/XLSX import | Full wear metals, viscosity, cleanliness, additive package | Within 2 hours of file receipt | 3–5 days |
| In-House Lab (LIMS) | LIMS API or structured export | All parameters from in-house LIMS configuration | Real-time on entry | 4–7 days |
| Generic PDF Reports | Monitored inbox + PDF parsing | All tabular parameters extractable from structured PDF | Within 30 minutes of receipt | 5–8 days |
| Manual Entry Fallback | Structured web form + mobile app | All parameters — manual field entry with validation | Immediate on submission | Same day |
Oil Analysis Response: Before and After AI-Driven Integration
The operational difference between a conventional oil analysis program and an AI-driven integrated workflow is most visible in the sequence of events between sample collection and corrective maintenance action. The comparison below maps that sequence for a representative finding — elevated iron and silicon contamination on a gas turbine main bearing oil circuit — across both approaches.
Measured Outcomes: What Plants Report After Oil Analysis AI Integration
The business case for oil analysis AI integration follows a direct chain from faster contamination detection to earlier corrective action, from earlier corrective action to arrested component degradation, and from arrested degradation to measurable reductions in bearing replacements, gear damage, and lubrication-related forced outages. The results below reflect outcomes from U.S. power generation facilities across gas turbine, steam turbine, and combined cycle asset classes within the first 18 months of deployment.
Ready to connect your oil analysis program to automated trend alerting and work order generation? Book a 30-minute technical assessment with iFactory's rotating equipment analytics team.
Expert Review: What Reliability Engineers Should Demand from an Oil Analysis Integration Platform
Having designed and evaluated oil analysis programs at more than fifteen power generation facilities, the evaluation errors that produce the most disappointing integration outcomes follow a consistent pattern. Here is the checklist every reliability engineer should run before committing to an oil analysis integration platform.
Conclusion
The oil analysis integration problem at U.S. power plants is not a scientific problem — it is a data flow problem. The laboratory science is sound. The wear metal thresholds are well established. The failure modes that oil analysis can detect are documented and understood. The gap is the connection between the lab result and the maintenance action, and that gap is where bearing failures progress, where gear damage escalates, and where contamination that could have been corrected with a $2,000 oil change becomes a $300,000 component replacement.
AI-driven oil analysis integration closes that connection without changing lab partnerships, sampling procedures, or equipment. The result is a rotating equipment program where every actionable finding generates a contextualized, asset-specific work order in minutes rather than days — and where the historical sample data that has been accumulating for years finally produces the early-warning intelligence it was always designed to generate.
Ready to connect your oil analysis results to automatic, prioritized maintenance actions? Schedule your oil analysis integration assessment with iFactory's rotating equipment analytics team.
Frequently Asked Questions
Connect Your Oil Analysis Program to Automatic, Prioritized Maintenance Actions
iFactory's oil analysis AI integration platform automates result ingestion, trend alerting, contamination classification, and work order generation — deployable in 3 to 6 weeks, with no changes to existing lab partnerships or sampling procedures.