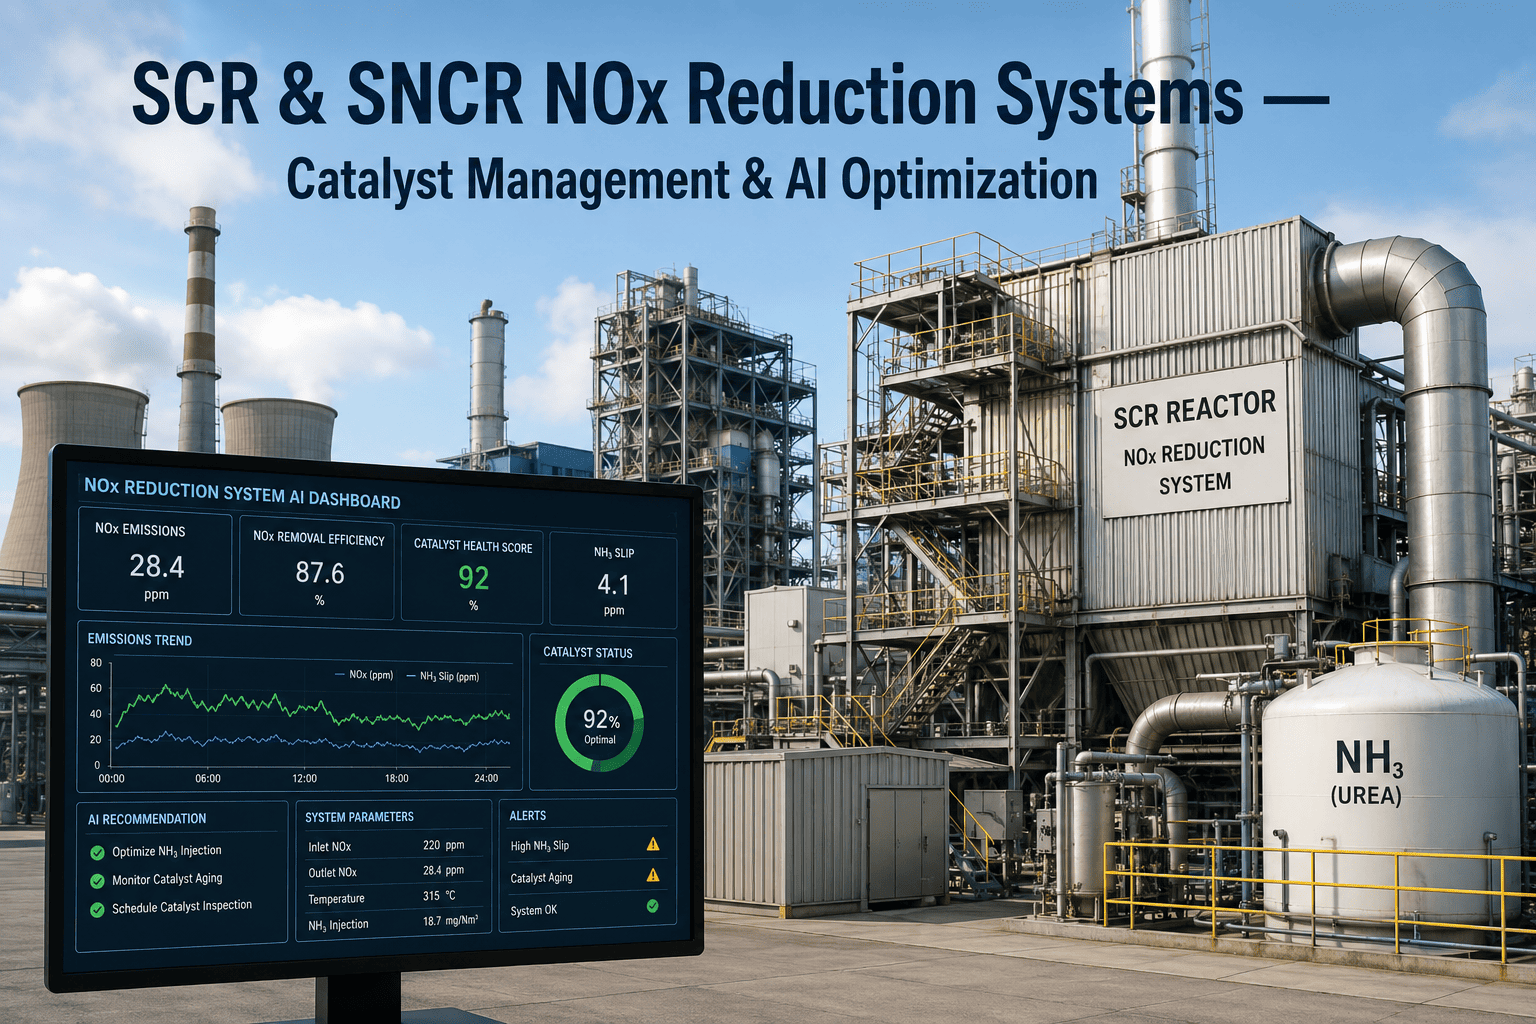
Catalyst deactivation never announces itself. Activity falls off gradually over years of service, and for most of that time ammonia slip stays low enough that nobody worries about it, right up until the last year or two when slip begins climbing sharply and a plant that thought it had another season of margin suddenly does not. Process engineers who manage SCR and SNCR systems already know this pattern from experience, but the real problem is timing the catalyst replacement or AIG tuning early enough to avoid a forced outage without replacing catalyst that still has useful life left in it. AI-powered catalyst management tracks activity trends, ammonia slip, and core sample data together so the remaining-life projection is based on this specific unit's actual deactivation curve rather than a generic vendor estimate, and reviewing that curve against your own K-value history is easiest during a working session with our team.
SCR & SNCR CATALYST MANAGEMENT
Know Exactly How Much Catalyst Life Is Left
AI-powered tracking of catalyst activity, ammonia injection performance, and core sample trends gives process engineers an accurate remaining-life projection instead of a guess based on the original vendor warranty.
Why Ammonia Slip Rises Faster Than Expected Near End of Life
Catalyst activity does not decline in a straight line. It degrades slowly for most of its service life, then the curve steepens right as a plant is least prepared for it.
Years 1-3
Activity loss of roughly 5-15% per year, slip stays well under limit
Years 4-6
Deactivation continues steadily, margin to the slip limit narrows
Final Stretch
Ammonia slip increases sharply as activity nears the design limit
5 to 15% Per Year
Typical annual activity loss rate for coal-fired SCR catalyst under normal conditions
Up to 30% Per Year
Accelerated deactivation rate possible with high-arsenic coal exposure
2 to 10 PPM
Typical permitted ammonia slip range most operating permits allow
What Actually Deactivates SCR Catalyst
Arsenic Poisoning
A leading deactivation agent in many U.S. coals, capable of accelerating activity loss well beyond the normal rate in severe cases.
Calcium Oxide Fouling
Alkaline ash components bind to active catalyst sites, gradually reducing the surface area available for the NOx reduction reaction.
NH3/NOx Misdistribution
Uneven ammonia injection across the catalyst face creates localized high-slip zones long before overall activity drops.
Physical Plugging
Dislodged liner insulation and ash bridging can blind catalyst channels, reducing effective volume without any chemical deactivation at all.
SCR vs SNCR: Different Chemistry, Different Maintenance Profile
Turn Your Core Sample History Into a Real Remaining-Life Number
Bring your last few years of K-value and ammonia slip data and see what the actual deactivation trend says about replacement timing.
How AI Catalyst Life Prediction Works
1
Core Sample Collection
Catalyst core samples taken during planned outages measure activity constant, surface area, and chemical poison concentration.
2
K-Value Trend Analysis
Activity results are trended year over year, building an actual deactivation curve specific to the unit's fuel and operating history.
3
Ammonia Slip Correlation
Slip readings are cross-checked against activity data to confirm whether AIG tuning or catalyst age is driving the trend.
4
Remaining Life Projection
The model projects when activity will fall below the compliance threshold, giving a realistic replacement window rather than a fixed vendor estimate.
5
Replacement Planning
The projected timeline feeds directly into outage scope and procurement planning, avoiding both a surprise slip exceedance and a premature replacement.
Frequently Asked Questions
STOP GUESSING AT CATALYST REPLACEMENT TIMING
Build a Remaining-Life Projection From Your Own Plant Data
See how activity trending and slip correlation can turn catalyst replacement from a surprise into a planned outage decision.