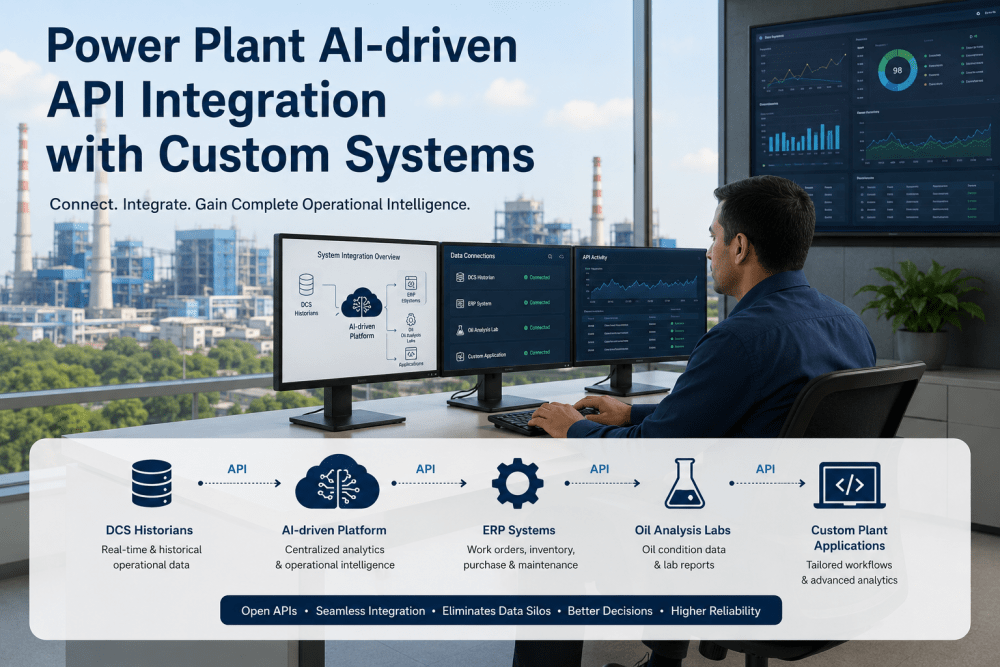
Most power plants operating in the United States today are running their most critical maintenance decisions from a combination of systems that were never designed to work together: a CMMS that holds maintenance history but not real-time operating data, a historian that holds operating data but is rarely connected to maintenance workflows, paper shift logs that capture what the operator noticed but not what the sensors measured, spreadsheets maintained by individual engineers that contain institutional knowledge that disappears when those engineers retire. This is not a technology failure — it is an architecture failure. The data exists. The sensors are running. The historians are filling up. The CMMS is generating and closing work orders. The gap is that none of these systems are connected in a way that allows the analytics platform to synthesize them into the operational intelligence that drives better maintenance decisions, better outage planning, and better cost management. Digital analytics transformation at a power plant is the process of closing that architecture gap — moving from disconnected point systems to an integrated AI-driven analytics platform that connects historian data, CMMS records, shift observations, and inspection findings into a single operating picture. This guide is a practical roadmap for that transition: how to phase it, what the quick wins look like, how to build stakeholder buy-in from the control room to the board, and what the operational and financial benchmarks look like at each stage of the transformation.
From Paper Logs to AI-Driven Analytics.
In 90 Days.
A practical three-phase roadmap for moving your power plant from disconnected spreadsheets and paper shift logs to a fully integrated AI-driven analytics platform — with documented quick-win milestones at 30, 60, and 90 days.
Why Power Plants Stay on Paper Longer Than Any Other Industrial Facility
Power plants have a higher resistance to operational technology change than almost any other industrial facility type, and this resistance is rational rather than simply organizational. The consequences of a control system failure or data flow disruption at a power plant are not comparable to a similar disruption at a manufacturing facility. A plant that loses its SCADA connection for four hours during a transition does not just lose production visibility — it potentially loses the ability to respond to a protection system event. This means that any analytics transformation must be designed from the first conversation around the principle that the control system architecture is untouched, the protection systems are unaffected, and the new data connections are read-only observers rather than active participants in the control loop.
NERC CIP Compliance Risk
Any new data connection to BES-classified cyber assets requires documented change management and CIP access control review — teams often default to doing nothing rather than navigating an unfamiliar approval process
Institutional Knowledge Silos
Senior operators and engineers carry decade-long equipment knowledge in their heads and in personal spreadsheets — organizational resistance to analytics platforms often reflects fear of that knowledge becoming less valuable rather than opposition to technology itself
Disconnected Budget Ownership
Maintenance budget, IT budget, and capital investment budget for controls systems are typically owned by different departments with different approval cycles — analytics transformation projects that span all three face fragmented funding approval that delays or derails deployment
Failed First-Generation Deployments
Most power plants attempted some form of digital analytics initiative between 2014 and 2020 — many of those deployments failed to generate ROI because they required extensive consultant support, produced dashboards rather than decisions, or were abandoned when the champion engineer left
The Three-Phase Digital Transformation Roadmap
A power plant digital analytics transformation that succeeds operationally and financially is built in three phases, each with a defined scope, a measurable milestone, and a value delivery point that builds organizational confidence and budget justification for the next phase. The phases are designed so that Phase 1 delivers standalone value — not just a foundation for future phases — which means the organization is not committing to the full three-year vision before it has seen meaningful results at the 90-day mark.
Historian Connection and Priority Asset Monitoring — Months 1-3
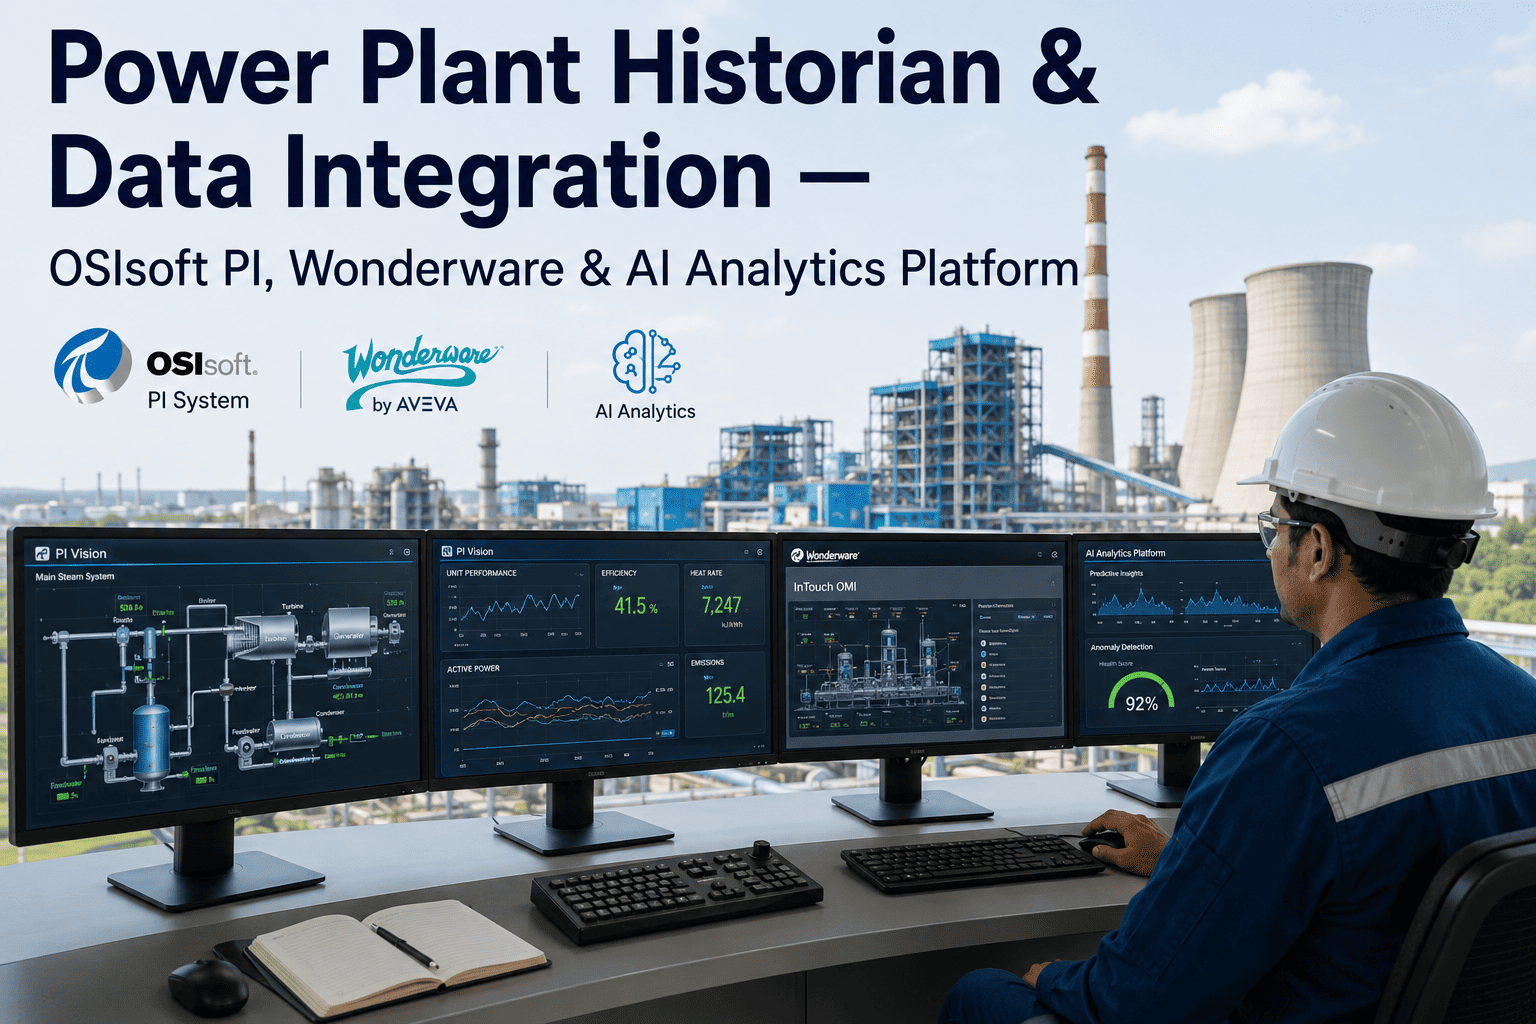
Connect the plant historian (OSIsoft PI, Aveva, or equivalent) to the analytics platform using a read-only API connection. Configure asset models for the 20-40 highest-consequence pieces of auxiliary and BOP equipment: condensate pumps, cooling water pumps, cooling tower fans, air compressors, instrument air dryers, and fuel system components. Establish healthy-condition baselines from six to twelve months of historian data. Activate AI anomaly detection and configure automated CMMS work order generation for high-confidence findings. Deliverable: first AI-generated condition-based work order within 30 days of historian connection. Milestone metric: 10 or more anomalies detected and verified against equipment findings within 90 days.
Digital Shift Operations and Full Auxiliary Coverage — Months 4-9
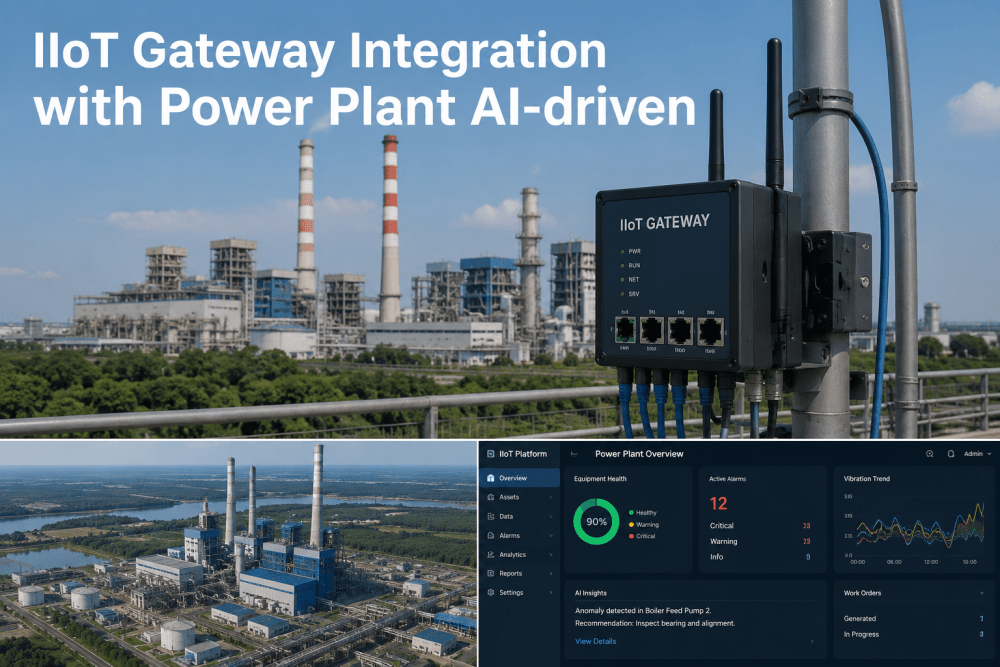
Replace paper shift logs with digital shift reporting integrated with the historian and CMMS. Expand IIoT gateway coverage to all auxiliary equipment not covered by the historian connection — field-level PLC connections, vibration sensors on rotating equipment not monitored by the DCS, and HART field device diagnostics. Connect the CMMS work order history to the analytics platform so that maintenance records inform the AI models' baseline calculations. Activate performance monitoring for heat rate, auxiliary power consumption, and availability metrics against fleet or industry benchmarks. Deliverable: full auxiliary equipment population monitored, digital shift reports replacing paper logs, performance benchmarks live. Milestone metric: 25% reduction in paper-based maintenance communication, measurable improvement in auxiliary-fault-to-work-order response time.
Outage Planning Optimization and Fleet-Level Analytics — Months 10-18
Connect the analytics platform to the long-range maintenance planning system and outage scheduling tools. AI-driven remaining life projections feed the outage scope development process — equipment showing high probability of needing replacement or major service within the next 12-24 months is automatically surfaced for outage scope review before the scope freeze date. If the facility operates multiple units or the organization manages a fleet, activate cross-unit benchmarking that identifies performance outliers and propagates best-practice maintenance approaches across sites. Activate regulatory compliance documentation automation: inspection reports, SRV test records, and environmental monitoring reports generated from the analytics platform's connected data. Deliverable: AI-informed outage scope, fleet-level benchmarking live, regulatory documentation automated. Milestone metric: first outage scope influenced by AI remaining life projections, measurable reduction in outage scope change-order activity.
Want to see a site-specific transformation roadmap mapped to your facility's historian infrastructure, CMMS, and operational priorities? Book a free digital transformation assessment with iFactory's power plant advisory team.
Building Stakeholder Buy-In: From Control Room to Board
The technical deployment of a digital analytics platform is straightforward once the historian connection is established. The organizational deployment — getting the operators, maintenance engineers, planners, and plant management to use and trust the platform's outputs — is where most power plant analytics initiatives succeed or fail. The four stakeholder groups that must be engaged differently are the control room team, the maintenance workforce, plant management, and corporate or board-level sponsors.
The Before vs. After Operating Model: What Changes and What Stays the Same
The most common concern about digital analytics transformation at power plants is that it changes the fundamental operating model in ways that create new risks or require organizational capabilities that the facility does not currently have. Understanding exactly what changes and what stays the same is essential for managing this concern accurately.
Quick-Win Milestones: What to Show at 30, 60, and 90 Days
Every successful power plant digital transformation deployment has a defined quick-win milestone plan that demonstrates value at 30, 60, and 90 days — before skeptics have time to conclude that the platform is producing dashboards rather than decisions. These milestones are not aspirational targets; they are design outputs of the Phase 1 deployment scope.
Expert Review: What Senior Plant Engineers Say About the Transformation Decision
"I have been involved in three separate digital analytics transformation initiatives at power plants over the last eleven years — one that failed in the first year, one that delivered partial value and then stalled, and one that is still running today and has fundamentally changed how the plant manages maintenance and outage planning. The difference between the failed deployment and the successful one was not the software. It was not the data quality. It was the deployment sequence and the stakeholder engagement strategy. The failed deployment tried to go from paper logs to full AI-driven analytics in a single six-month implementation. It overwhelmed the operations team, created organizational resistance from the maintenance workforce who felt they were being evaluated by an algorithm, and produced a dashboard that senior management could not connect to actual cost savings. The successful deployment started with fifteen assets and a single metric: how many anomalies did the AI detect in 90 days and how many were confirmed by physical inspection? When the answer at 90 days was nineteen out of twenty-three detected anomalies confirmed — including two that would likely have caused forced outage events — the organizational skepticism evaporated. The maintenance team started trusting the alerts because they had seen them verified. Management approved Phase 2 funding before we asked for it because the 90-day cost avoidance calculation covered Phase 1 investment three times over. My advice to any plant engineer considering this transition: start small, demonstrate fast, and let the data convert your skeptics. The technology works. The deployment sequence is what determines whether it delivers or disappoints."
Conclusion
Digital analytics transformation at a power plant is not a technology deployment — it is an organizational transition that happens to involve technology. The historian is already collecting the data. The CMMS is already tracking the maintenance history. The sensors on the rotating equipment are already measuring the conditions that precede failures. The transformation is the act of connecting these data sources through an AI analytics platform that synthesizes them into the operational intelligence that allows the maintenance team to act before equipment fails, the outage planning team to build scope from actual equipment condition rather than scheduled calendar intervals, and plant management to manage maintenance cost and reliability from a complete real-time picture rather than a 90-day lag report.
The three-phase roadmap — historian connection and priority asset monitoring, digital shift operations and full auxiliary coverage, outage planning optimization and fleet analytics — is designed to deliver measurable value at each phase before committing to the next. The 30-60-90 day milestone framework gives every stakeholder a specific, verifiable proof point that the platform is generating decisions rather than dashboards. And the stakeholder buy-in strategies address the specific concerns that have derailed most prior power plant analytics initiatives — not with executive presentations, but with verified findings and documented avoided costs delivered in the first three months of deployment.
Ready to start your power plant's digital analytics transformation with a structured, low-risk Phase 1 deployment? Schedule your free transformation assessment with iFactory's power plant advisory team today.
Frequently Asked Questions
Start Your Power Plant's Digital Analytics Transformation With a 90-Day Quick Win
iFactory's three-phase digital transformation framework connects your historian, CMMS, and operational data into an AI-driven analytics platform that delivers measurable results — first automated work orders at 30 days, verified avoided-cost events at 90 days, and a fully documented ROI before Phase 2 begins.