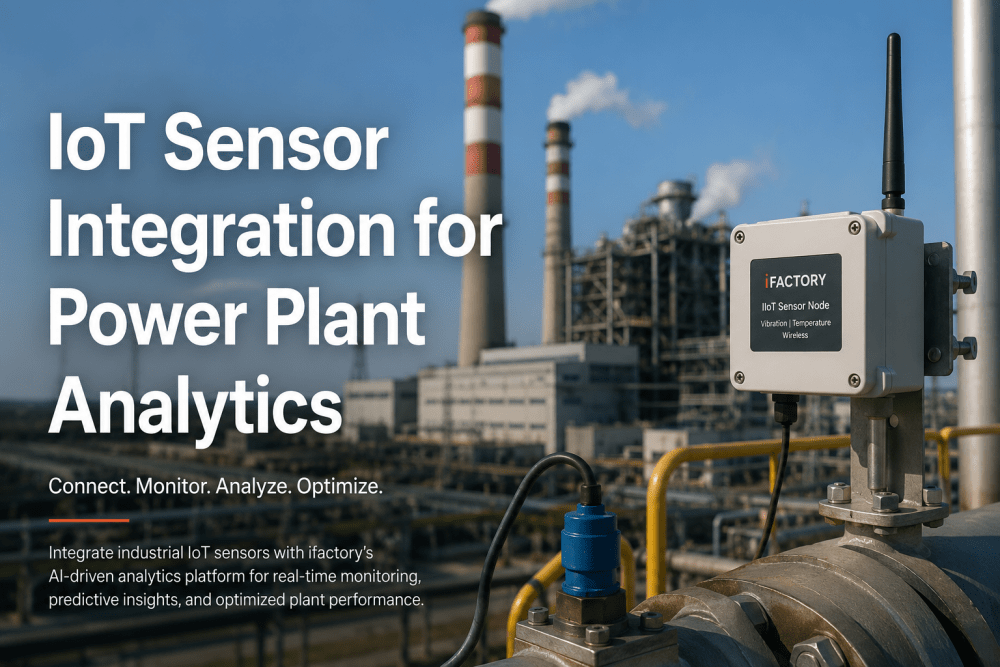
Somewhere in your OSIsoft PI or Wonderware historian sits ten, fifteen, sometimes twenty years of tag data — every temperature excursion, every pressure swing, every startup and shutdown sequence the plant has ever logged. Most of it has never been analyzed for anything beyond the occasional trend chart pulled during an incident investigation. For a Process Engineer, that's not a storage problem, it's a missed opportunity: the historian already contains the evidence needed to build predictive maintenance models, benchmark process efficiency, and catch slow drift long before it becomes a deviation report. iFactory AI connects directly to your existing PI, Wonderware, or DCS historian and turns that archive into a live analytics layer instead of a passive record — Book a Demo to see your own historian data run through it.
Why Historian Data Sits Underused in Most Power Plants
Historians were built to solve a storage problem, not an analysis problem. OSIsoft PI, Wonderware Historian, and similar systems are excellent at compressing and archiving millions of time-series tags reliably over decades, but they were never designed to run predictive models, correlate cross-asset patterns, or flag subtle degradation trends automatically. As a result, most of that data gets pulled manually — a process engineer exports a trend during a troubleshooting exercise, builds a spreadsheet, and closes the investigation without the analysis feeding back into a repeatable model. The knowledge generated in that one investigation rarely gets systematized.
iFactory AI addresses this by sitting on top of your existing historian rather than replacing it. The platform connects through native PI or Wonderware connectors, maps tags to asset and process context, and applies continuous AI analysis — anomaly detection, correlation analysis, predictive maintenance modeling — to data that would otherwise remain locked in periodic manual exports. This means the years of historical operating data your plant has already collected become the training foundation for every predictive model the platform builds, rather than starting from zero.
Raw tag data — temperature, pressure, flow, vibration, electrical — accumulated over years of plant operation.
Direct connection to the historian's native interface, extracting tags without disrupting existing polling or storage configuration.
Tags are mapped to specific assets, process units, and operating modes so analysis reflects real plant structure, not raw signal names.
Predictive maintenance, anomaly detection, and performance benchmarking models run continuously against live and historical data.
What Changes Once Historian Data Is Actively Analyzed
The gap between a historian used purely for storage and one feeding active AI analysis shows up most clearly in how process engineers spend their time and how early problems get caught. The comparison below reflects patterns observed across facilities before and after connecting historian data into an active analytics layer.
- Trend analysis happens reactively, after an incident or deviation is already reported
- Cross-asset correlation requires manually exporting and merging multiple tag sets
- Slow drift in process efficiency goes unnoticed until a quarterly report surfaces it
- Institutional knowledge from past investigations rarely gets systematized into reusable models
- Anomaly detection runs continuously, flagging deviations as they emerge in near real time
- Cross-asset patterns are correlated automatically across the full historian dataset
- Process efficiency drift is caught within days rather than surfacing at quarter end
- Every investigation contributes to a growing library of validated predictive models
Historian Platform Compatibility and Integration Detail
| Historian Platform | Connector Type | Typical Tag Volume Supported | Setup Time |
|---|---|---|---|
| OSIsoft PI | PI Web API / AF SDK native connector | 10,000–500,000+ tags | 1–2 weeks |
| Wonderware Historian | OLE DB / Historian Client connector | 5,000–200,000 tags | 1–3 weeks |
| AspenTech IP.21 | SQLplus / native API connector | 5,000–150,000 tags | 2–3 weeks |
| DCS-Native Historian | OPC HDA or vendor-specific export | Varies by DCS platform | 2–4 weeks |
Process Engineering Use Cases Built on Historian Data
Efficiency Drift Detection
Continuous comparison of current process efficiency against historical baselines, flagging gradual degradation in heat rate, combustion efficiency, or heat exchanger performance before it becomes a measurable production loss.
Cross-Asset Correlation
Automated correlation analysis across historian tags from multiple assets, surfacing relationships between upstream process changes and downstream equipment stress that manual trend review would likely miss.
Startup/Shutdown Pattern Analysis
Analysis of historical startup and shutdown sequences to identify which transient conditions correlate with accelerated wear, informing revised operating procedures for future cycles.
Predictive Maintenance Training Data
Years of historian data covering both normal operation and past failure events provide the training foundation for predictive maintenance models, improving accuracy from the first deployment.