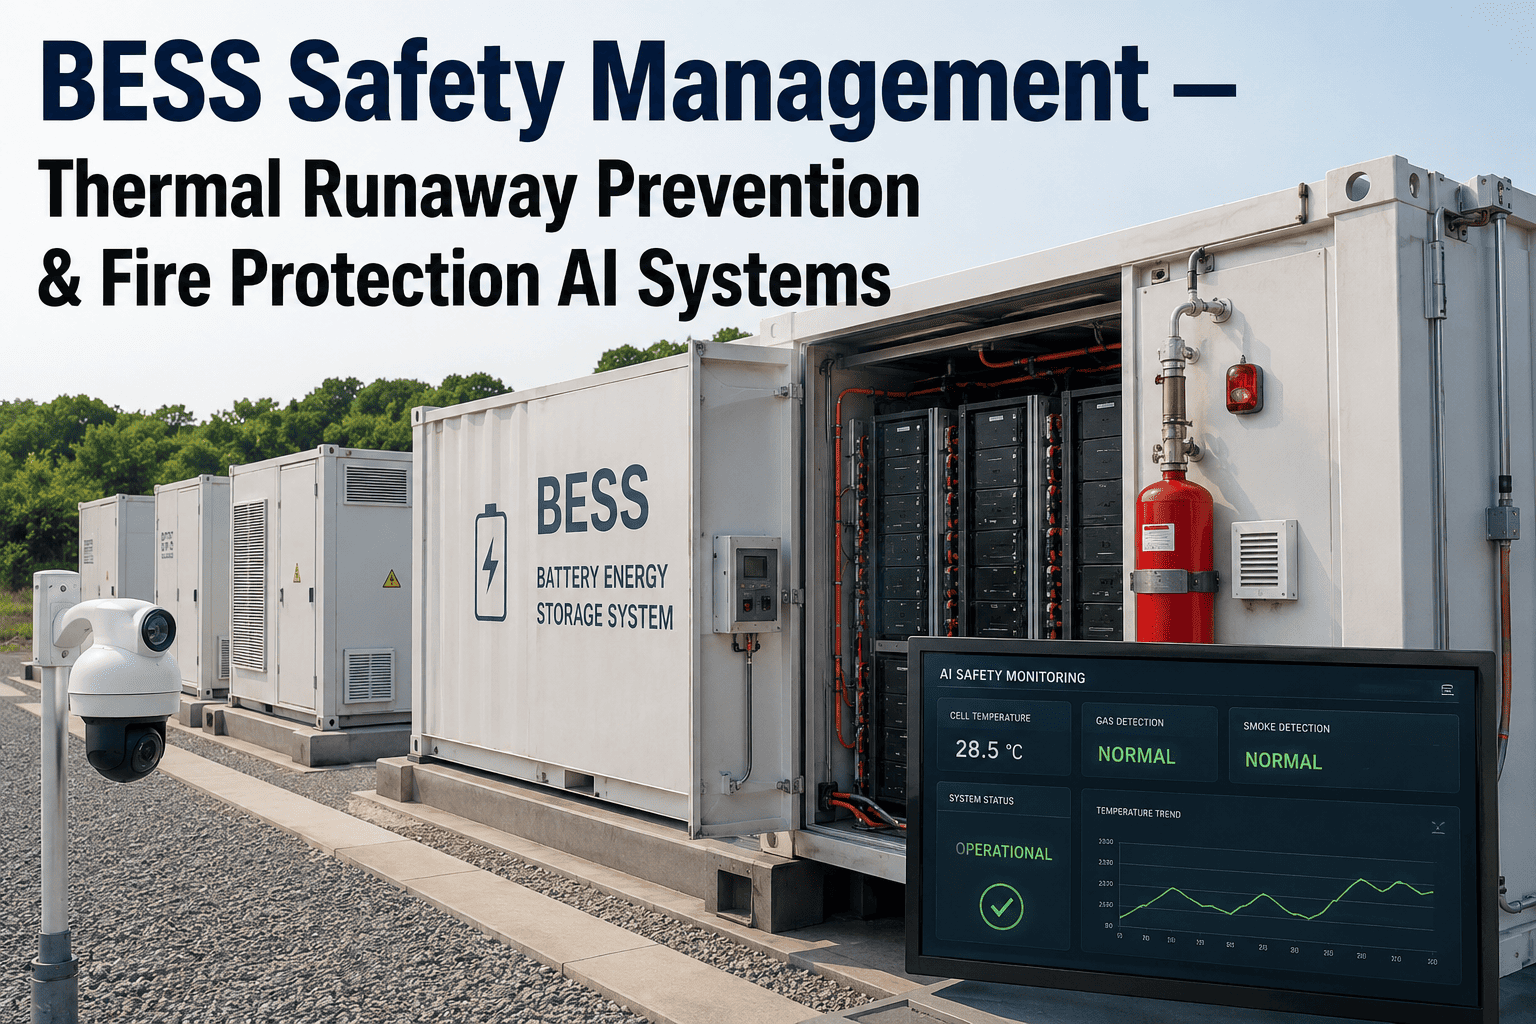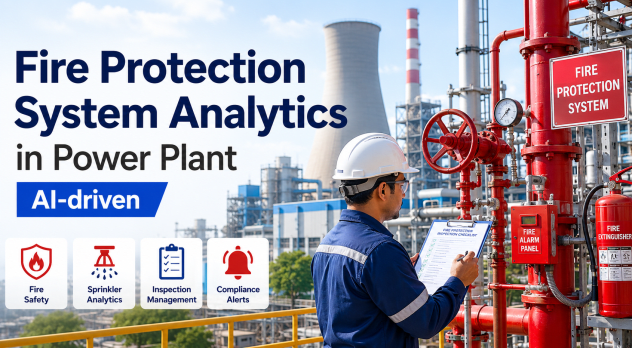
In a power plant, fire is not a hypothetical risk—it is a statistical inevitability without rigorous detection and suppression system analytics. Facilities that Book a Demo with iFactory are discovering that intelligent fire system analytics don't just improve compliance—they reduce the risk of catastrophic fire events by detecting suppression system degradation months before a failure occurs.
The "Suppression Visibility Gap" in Power Generation Fire Safety
Why Quarterly Inspections Are Not Enough for Critical Fire Protection Assets
Power plants operate with a complex array of fire protection systems—deluge valves in transformer yards, pre-action systems in turbine buildings, gaseous suppression in control rooms, and foam concentrate systems in fuel oil handling areas. Each of these systems has specific inspection and testing requirements under NFPA standards, yet most facilities manage these requirements through manual spreadsheets and paper logs. Safety managers exploring this shift typically begin by scheduling a session to book a demo and assess how their current fire system monitoring infrastructure maps against continuous analytics requirements.
The challenge is compounded by the diversity of fire risks across different plant zones. A hydrogen seal oil system in a generator bay requires hydrogen-specific flame and gas detection calibrated to a different sensitivity than the thermal cameras monitoring a coal conveyor belt.
5 Root Causes of Fire Protection System Failure in Power Plants
Diagnosing the Blind Spots in Your Fire Safety Infrastructure
The True Cost of Unmonitored Fire Protection Assets
Annualized Risk Profile of Common Fire System Failure Modes in a 500 MW+ Power Plant
A failure in the fire protection system is never a "safety-only" event—it is a production and financial event. If a deluge valve fails to actuate during a transformer fire, the resulting damage can take a unit offline for months. If a gaseous suppression system in a control room has lost its agent concentration, the entire plant loses its ability to protect critical control electronics. When your fire protection analytics are limited to manual inspection logs, you are managing these risks reactively. The table below outlines the annualized risk and cost profile of common fire system failure modes.Book a Demo
| Failure Mode | Primary Asset Impact | Secondary Operational Risk | Annualized Cost Range |
|---|---|---|---|
| Deluge Valve Stiction | Transformer Yard Protection Loss | Extended Unit Outage (3-9 months) | $850K – $2.4M |
| Suppression Agent Leakage | Control Room Fire Protection Gap | Critical Electronics Exposure | $180K – $520K |
| Detector Drift / Contamination | False Alarm / Missed Detection | Dispatch Response & Nuisance Trips | $95K – $240K |
| Fire Pump Bearing Wear | Sprinkler System Pressure Loss | Complete Zone Protection Failure | $220K – $680K |
| Hydrogen Sensor Drift | Generator Bay Detection Gap | Explosion Risk Exposure | $150K – $400K |
The 5-Step Framework for Fire Protection Analytics Deployment
Fire Safety Compliance & Regulatory Risk Management
NFPA Standards, OSHA Requirements, and the Cost of Non-Compliance
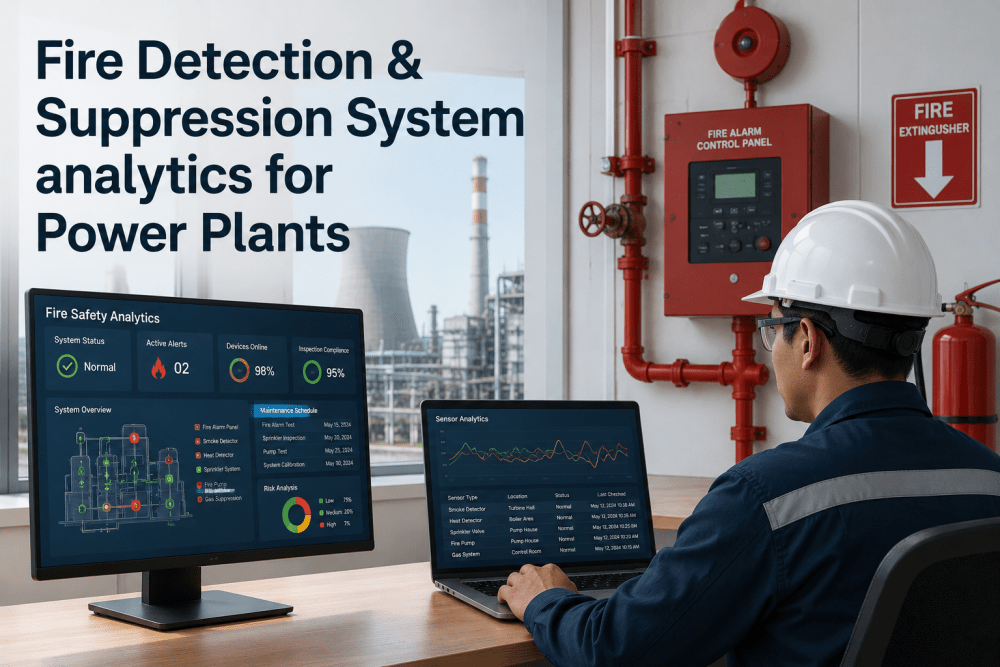
Power plants operate under a dense regulatory framework for fire protection—NFPA 25 for sprinkler systems, NFPA 72 for detection and alarm systems, NFPA 850 for power plant fire protection, and OSHA 29 CFR 1910 Subpart L for general fire safety. Each standard imposes specific inspection, testing, and documentation requirements that, if missed, can result in significant fines and increased liability exposure. iFactory's compliance module automates the scheduling and documentation of every required inspection, test, and maintenance activity, providing an unbroken audit trail that satisfies regulatory requirements and reduces the administrative burden on fire protection engineers. For plant safety teams, iFactory is not just an analytics tool—it is the central nervous system of the facility's fire protection compliance program. Book a Demo to see our NFPA compliance automation in action.
Frequently Asked Questions
What fire protection system components can iFactory monitor in real-time?
iFactory monitors a comprehensive range of fire protection assets including deluge and pre-action valve position status, sprinkler system pressure and flow, clean agent cylinder weight and pressure, foam concentrate levels, fire pump vibration and discharge pressure, jockey pump cycling frequency, smoke and flame detector calibration status, hydrogen/methane/CO gas sensor health, and water storage tank levels.
How does the platform differentiate between a real fire event and a false alarm from steam or dust?
iFactory's AI engine uses multi-sensor correlation to validate fire events. For example, in a turbine building, a steam leak may trigger a single heat detector, but a real fire would show a correlated temperature rise, smoke density increase, and potentially a pressure drop in the suppression system. The platform learns the normal ambient profile of each zone and flags events only when the multi-parameter signature exceeds the fire-specific threshold, reducing false alarms by up to 89% compared to single-sensor detection.
Does iFactory integrate with existing fire alarm control panels and NFPA documentation requirements?
Yes. iFactory connects to fire alarm control panels via dry contacts, Modbus, BACnet, or API integration to ingest alarm and supervisory signals. The platform then correlates these signals with suppression system health data and automatically generates inspection and testing documentation in NFPA-compliant formats, including time-stamped records of all tests, sensor calibration results, and system impairment logs.
What is the typical ROI for deploying fire protection analytics at a power plant?
The ROI is driven by three primary factors: avoided fire event losses (a single transformer fire can cost over $2 million), reduced manual inspection labor (analytics automate 60-70% of routine inspection tasks), and decreased false alarm costs (eliminating unnecessary fire department dispatches and production interruptions). Most power generation facilities see full payback within 9 to 14 months. iFactory provides a detailed ROI model during live demo sessions tailored to your plant's specific fire protection configuration and risk profile.
How does the platform handle hydrogen detection in generator bay environments?
iFactory's hydrogen detection analytics module continuously monitors hydrogen sensor readings in generator seal oil systems and hydrogen cooling zones. The platform tracks sensor calibration drift against known hydrogen background levels, correlates readings with generator operating conditions (load, seal oil temperature, hydrogen purity), and provides early warning of sensor degradation before it compromises the detection system's ability to identify a hydrogen leak—a critical safety requirement for large synchronous generators.